Core dump epidemiology: fixing an 18-year-old bug
By Nathan Bronson, Member of Technical Staff
OpenAI’s models and agents increasingly rely on scalable data infrastructure in order to search for relevant data at inference time: when the models are thinking about your question. Some of these services are written in C++, whose low-level control of the system lets us maximize performance and minimize memory usage. Those efficiency benefits are important as we scale, but C++’s lack of memory safety means that bugs can cause crashes by writing to incorrect or non-existent memory addresses.
A few months ago we observed some crashes from inside the Rockset service, a bespoke part of our ChatGPT data infrastructure which is key to many data plugins and to searching over conversations. In each of these crashes, a normal C++ function seemed to finish and then return to a bogus address, causing the kernel to stop the program because the instruction pointer no longer pointed at code. Sometimes the return address slot in the stack frame was NULL. Sometimes the stack pointer CPU register itself seemed to be off by 8 bytes, as if %rsp had somehow been decremented in the middle of normal execution. In both cases the crash happened on return.
These are not normal failure modes for application code. A stray write that lands only on a saved return address is possible, but extremely unlikely. A bug that misaligns %rsp by 8 without involving inline assembly, setcontext, or longjmp (none of which we use) is even stranger, because compiled code only adjusts that register directly in the function prologue and epilogue. Every hypothesis we (or ChatGPT) could think of had strong evidence against it, so the bug seemed impossible.
What we assumed was one problem eventually turned out to be two unrelated bugs, coincidentally discovered at the same time. First, silent hardware corruption on one Azure host, where the CPU just didn’t do math correctly. Second, an 18-year-old race condition in GNU libunwind, an unnoticed bug in a widely used open source library.
This post is the story of how we identified and fixed seemingly inexplicable crashes by thinking like an epidemiologist and building a high-quality data set about the entire population of crashes.
First debugging attempt: carefully examining a few core dumps
First, let’s go deeper on Rockset. It’s a cloud-native data system for search and real-time analytics that we use for many internal use cases at OpenAI, such as sync connectors (Rockset was acquired by OpenAI in 2024). Streaming updates are used to maintain an up-to-date index of a workspace’s knowledge base so that ChatGPT can search for relevant information when answering questions or performing actions.
Rockset’s execution layer is written in C++. The C++ language provides low-level access to the CPU, which is good for performance and efficiency, but it means that application bugs can lead to invalid memory accesses and segfaults. To help track these down we use folly’s fatal signal handler to log a stack trace when a crash happens, and we upload the corresponding core dumps (a snapshot of the state of the program when it crashed) to Azure blob storage for later analysis. All of Rockset’s query processing leaves are replicated, which minimizes the client impact of a crash. However, each segfault corresponds to a bug that needs to be fixed to meet our reliability and quality goals.
Our initial approach was to treat these cores like a conventional debugging problem: inspect a few core dumps very closely, form hypotheses, and rule them out one by one.
Most of the crashes occurred in a method called DocumentTree::updateDocument. In these crashes it appeared that updateDocument had called some unknown function X, the stack had become corrupted while X was active, then X had returned to an address that wasn’t executable code. In some cases X’s just-popped frame looked valid except that its saved return address was NULL. In other cases the stack pointer itself looked wrong, but the next valid frame still seemed to be updateDocument.
We didn’t know when the stack was getting corrupted, which left a huge search space. updateDocument is a large method that undergoes a lot of inlining, so the number of candidates for X was overwhelming.
Was this a bug in our C++ code? A compiler or linkage issue? A problem in one of our runtime libraries? A Linux kernel bug around signal delivery or context switching? Something even rarer? If this was a stray write, why wasn’t it caught by our ASAN staging environment?
We tried to use our application-level logs to identify all occurrences of the problem, but stack-corruption bugs are hard to classify from logs alone because the logged stack traces are themselves corrupted or missing. We weren’t able to construct a log query that didn’t have both false positives and false negatives. We manually inspected more cores and found some additional examples, but that process was too labor-intensive to give us a trustworthy data set.
At this stage of the investigation, we (incorrectly) ruled out a hardware bug, because we saw crashes across multiple regions and multiple hardware types, so we were still looking for software-only causes. For a few days, we went super-deep on a single misaligned-%rsp crash, reconstructing the pre-crash history using stack and register contents. This produced some possible clues, but because we didn’t let go of our initial conclusions that all of the bugs had the same cause, this didn’t get us unstuck.
Clues from the stack
Before getting to the turning point of our investigation, it’s important to explain what kind of information we were extracting from the core files.
Rockset is compiled with -fno-omit-frame-pointer, so the active stack frame is always reachable through %rbp, and callers form a linked list of frame pointers.
On Linux x86_64, the AMD64 System V ABI also reserves 128 bytes below %rsp as the red zone. That region is available to userspace code and, importantly, the kernel promises not to clobber it when it delivers a signal, as part of the ABI contract.
The red zone was central to our debugging of a post-return crash, because it preserves some information from before the return. When a SIGSEGV is triggered, folly’s fatal signal handler runs on the crashing thread’s stack. Stack frames that are no longer active (because their function has returned) will get clobbered by the signal handler, except for the last 128 bytes. That’s why we can say things like “X’s just-popped stack frame looked valid, except for a NULL return address.” The red zone preserves some of the inactive frames, or sometimes just the tail of one inactive frame.
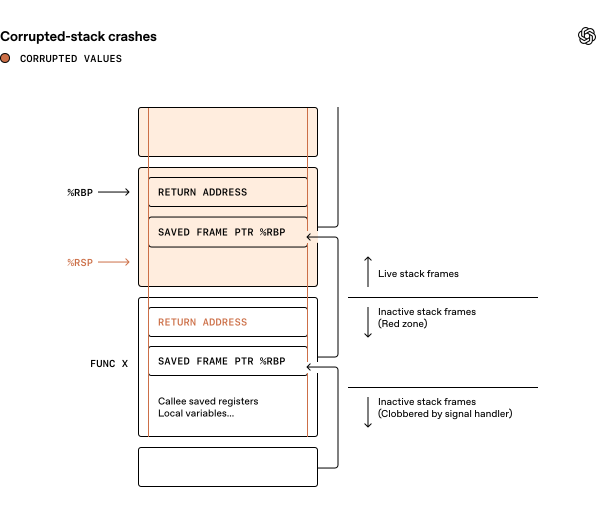
We found one misaligned-stack crash in which all of the functions involved were very small. That let us see that %rsp had become misaligned during execution of a relatively simple function, and that more calls had succeeded afterward. The program only crashed when the active function finally tried to return. None of those code paths used exceptions, inline assembly, setcontext, or longjmp, so if the stack pointer truly changed in the way the core suggested, no plausible bug in userspace code explained the issue.
That pushed us toward the kernel.
Rockset uses signals more aggressively than most programs. Query execution is broken into many lightweight tasks that exchange data. This is important for handling high-QPS workloads efficiently, but it makes per-query CPU accounting awkward as work for many queries is multiplexed onto the same thread pool.
Our solution is something we call coarse_thread_cputime_clock, which approximates clock_gettime(CLOCK_THREAD_CPUTIME_ID, ...) cheaply enough to sample at every task boundary. The timer_create API can be used to schedule a periodic signal delivery based on several notions of the passage of time, including the accumulation of CPU time. We schedule a signal (SIGUSR2) to be delivered every few milliseconds of CPU time, at which point the signal handler updates a thread-local value. Even though many tasks don’t see the coarse clock advance while they are executing, summing all of the deltas produces an unbiased estimate of the actual CPU time for a query.
Because we deliver signals so often, a rare kernel bug around context switching or signal delivery seemed plausible. We spent time reading bug reports, kernel source code, and the Azure-specific kernel patches. We tried stress tests. We weren’t able to find anything that seemed related.
At that point we decided to step back and try a different approach.
Doctor or epidemiologist?
There are two broad ways to debug a problem like this.
One is to act like a doctor of sorts: focus on one patient, run lots of tests, and try to diagnose a single case from detailed evidence.
The other is to act more like an epidemiologist: look at the entire population and ask whether there are patterns that a single case cannot reveal. Did the bug start at a specific release? Does it correlate with one hardware SKU (the specific CPU and server model), one region, or one kernel version? Are there multiple distinct clusters hiding inside what looks like one syndrome?
We had mostly been in doctor mode. The key shift was deciding that we needed to gather high-quality population data.
Cleaning the data
Our previous attempts to automatically find all of the instances of the problem failed because we were trying to use text searches over the logs. The core dumps themselves have a lot more information, but looking at them manually didn’t scale. We decided to invest the effort to build a pipeline that could automatically analyze the core dumps.
We had ChatGPT write a script that downloaded a prefix of each core file, extracted the registers, filtered known false positives using the logs, and automatically labeled the crash as return-to-null, misaligned-stack, or other. Then we ran that script in parallel over every production Rockset core dump from the previous year.
This was the turning point.
Once we had a clean data set, correlations appeared immediately. What we had been treating as one weird bug was actually two separate crash populations.
The return-to-null cores were spread across many clusters and geographic regions. Their frequency had increased recently, but there was no crisp start date and no clean infrastructure boundary.
The misaligned-stack crashes looked completely different. They all came from one region, had a clear start date, and never happened on nodes that had been running for a long time. Even though they involved multiple Azure VMs (virtual machines hosted in the cloud), the pattern looked like one physical machine with bad hardware causing problems for whichever VM happened to land on it.
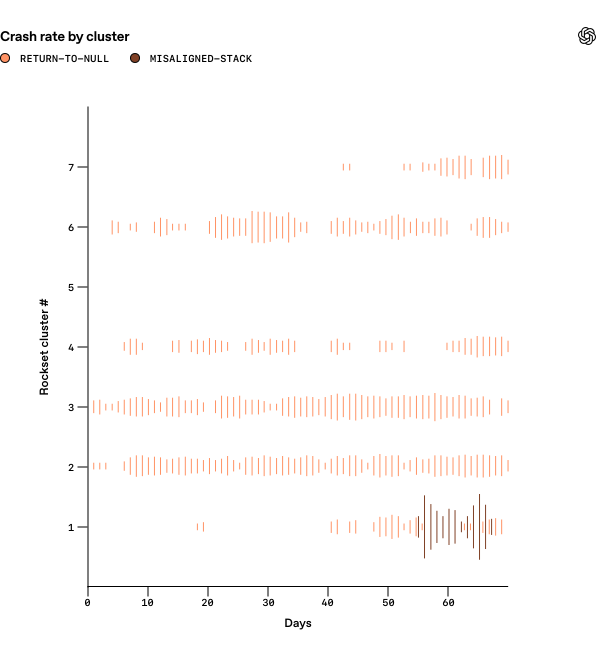
That was the moment we realized we had been mentally conflating two bugs. Because we had been mixing counterexamples from both bugs, we couldn’t find