A mosaic of whole-body representations on the human precentral gyrus
Abstract
Understanding how the body is represented in the motor cortex is key to understanding how the brain controls movement. Although the motor cortex has been mapped in animal models at a fine scale1,2,3,4,5,6,7,8,9,10, characterization in humans remains primarily limited to low-resolution recording11,12,13,14,15,16 and stimulation techniques17,18,19,20. Here we created a comprehensive map of the human motor cortex at single-neuron resolution, spanning microelectrode array recordings from 20 arrays across 8 individuals with paralysis from spinal cord injury, amyotrophic lateral sclerosis or brainstem stroke, all enrolled in brain–computer interface clinical trials. These arrays broadly sample the crown of the precentral gyrus (PCG; thought to be composed largely of the premotor cortex (Brodmann area 6)). We found that body parts were highly intermixed, such that the entire body was represented in all sampled locations of the PCG, although the relative strength of body parts was roughly consistent with the motor homunculus17,18. We also found two speech-preferential areas with a broadly tuned, orofacial-dominant area in between them. Throughout the PCG, movement representations of the four limbs were interlinked, with homologous movements of different limbs (for example, toe curl and hand close) having correlated representations. These data provide evidence consistent with an intermixed, interrelated and behaviour-centred organization of the motor cortex3,21. The resulting map also provides important targeting information for brain–computer interfaces that seek to restore motor function.
Main
Nearly a century ago, Penfield and colleagues pioneered the motor homunculus, a topographical map of the human PCG, by electrically stimulating the cortical surface and observing which body parts moved in response17,18. Since that time, the motor cortex has been mapped extensively in non-human primate models using single-neuron recordings6,7,8, microstimulation of both short and long durations1,2,3,4,5 and lesion and inactivation studies4,9,10. This body of work has provided strong evidence that the motor cortex is more fractionated and intermixed than originally implied by the motor homunculus, with related body parts overlapping in the primary motor cortex2,22,23 (for example, wrist and fingers) and whole-body regions overlapping in the premotor cortex6,7,24 (for example, arm and face). Long stimulation durations have more recently revealed that the motor cortex is also organized by behaviour in ethological ‘action maps’ as opposed to a pure body part organization3,4,21,25.
In humans, however, exploration of the motor cortex has largely been limited to lower-resolution recording techniques—such as electrocorticography11,12,13 and functional magnetic resonance imaging (fMRI)14,15,16,26—as well as gross stimulation mapping in the operating room17,18,19,20. Studies reporting the effects of lesions27,28 and stimulation17,18,19,20 have found results that suggest a separation of leg, arm and face movement regions in the human PCG (that is, stimulation at any single location does not typically cause simultaneous arm, leg and face movement, with some exceptions19,29). On the other hand, fMRI and electrophysiological studies have emphasized a greater degree of intermixing13,14,15,16, including beta power modulation and blood-oxygenation-level-dependent deactivation spreading far from the somatotopic hotspot16,30, overlapping receptive fields14 and intereffector regions with whole-body intermixing15,31. However, these experiments cannot resolve detailed representations at the single-neuron level, and thus the representation of the body in the human motor cortex remains relatively unknown at a single-neuron scale. The crown (exposed surface) of the human PCG is thought to be anatomically composed largely of Brodmann area 6 (a premotor area), with the primary motor cortex lying within the central sulcus32,33,34. If the crown of the human PCG is functionally homologous to the macaque premotor cortex, we might expect to find dense intermixing of arm and leg movements dorsally3,7,24,35, and arm and orofacial movements ventrally3,6,24.
In previous work using microelectrode arrays capable of recording brain activity at single-neuron resolution, we have shown that a small, anatomically distinct area of the cortex in the dorsal PCG (referred to as the ‘hand knob’36) contained intermixed representations of the entire body37,38 (including all four limbs and head and face movements), where the limbs were interrelated with a compositional neural code. However, it is unknown whether a similar organization exists in the middle and ventral PCG; in addition to providing fundamental insight into the neural representation of movement in humans, an answer to this question is needed to inform the design of brain–computer interfaces (BCIs) that restore motor function to people with paralysis, including speech.
Here we revisit the motor representation of the whole body across a wide span of the PCG using microelectrode recordings from 8 human participants (Fig. 1a) implanted with 20 microelectrode arrays as part of BCI clinical trials. These participants had either spinal cord injury, amyotrophic lateral sclerosis (ALS) or brainstem stroke, resulting in severe motor impairment with varying levels of residual movement across individuals. All clinical trial procedures were conducted with oversight from ethics, institutional and regulatory bodies; before enrolment, an extensive consent process engaged potential participants and reinforced that no direct benefit from study participation was expected (see Methods). These neural recordings collectively sampled the length of the PCG spanning from the canonical arm area (near the superior frontal sulcus) to the canonical tongue and throat area (near the Sylvian fissure), and together constitute, to our knowledge, the first comprehensive motor map of the crown of the human PCG at single-neuron resolution.
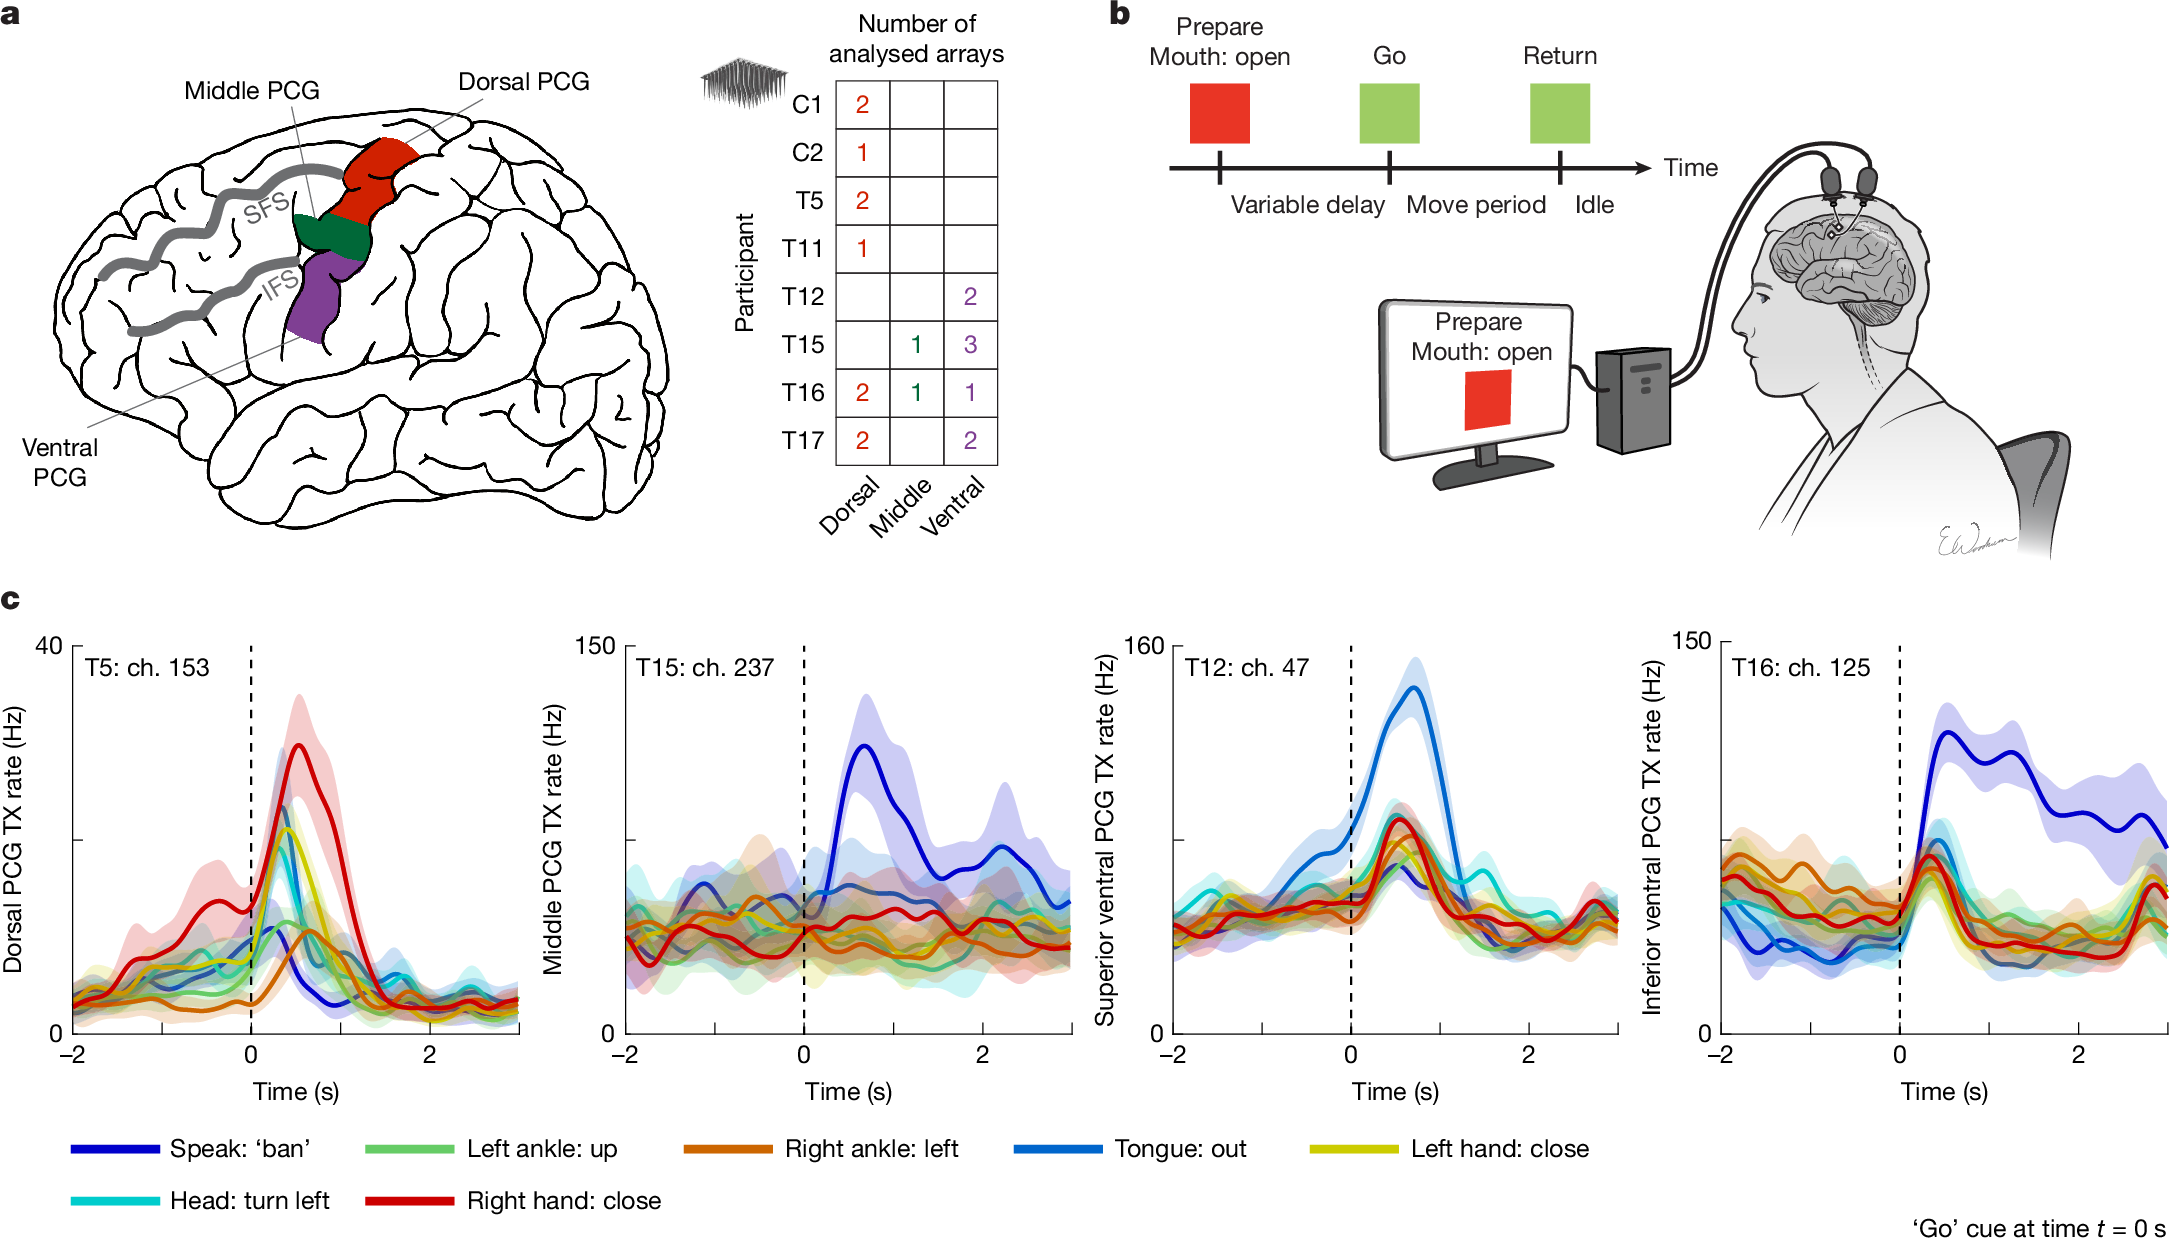
a, Diagram of the dorsal, middle and ventral regions of the PCG sampled in this study. Neural activity was analysed from a total of 20 microelectrode arrays distributed across 8 participants with paralysis (right table). Four additional microelectrode arrays were recorded but excluded from analysis due to lack of tuning to any movement (see Methods). All arrays were placed in the left PCG (and all participants except T12 and T15 were right handed). IFS, inferior frontal sulcus; SFS, superior frontal sulcus. b, Neural tuning to 46 attempted movements across the body was evaluated for each participant using an instructed delay task while they were positioned upright, either seated in a chair or in a bed at an incline. c, Example responses from microelectrodes within the three sampled regions of the PCG that show broad tuning to speech and movements of the arms, legs, face and head. Each line shows the mean threshold crossing (TX) rate across all trials of a single-movement condition, and the shaded regions show 95% confidence intervals (CIs). TX rates are a measure of spiking activity on an electrode and were denoised by convolving with a Gaussian smoothing kernel (120 ms s.d.). Black vertical dashed lines indicate the ‘go’ cue. Ch., channel.
Neural tuning to the whole body in the PCG
We assessed neural tuning to speech and movements of the face, head, arms and legs in eight participants in a visually cued movement task (Fig. 1b and Supplementary Tables 1 and 2). If participants could not physically complete a movement due to paralysis, they were instructed to attempt to complete the movement in a light, controlled and isolated manner, to the best of their ability (see Supplementary Video 1 for example movements from T12, who retained the greatest residual arm and leg movement among the participants). Example electrodes demonstrating strong neural tuning to various movements are shown in Fig. 1c.
To quantify neural tuning at a coarse scale, we measured the degree to which the neural population activity evoked by each movement differed from a ‘do nothing’ baseline condition (Fig.