A disease model resource reveals core principles of tissue-specific cancer evolution
TL;DR
The study introduces the Mouse Cancer Cell line Atlas (MCCA), a resource of 590 models, to explore tissue-specific cancer evolution driven by KRAS mutations. It reveals that KRAS dosage, tissue-specific evolutionary requirements, and context-dependent genetic interactions shape cancer development patterns across different organs.
Key Takeaways
- •The MCCA provides a comprehensive mouse cancer cell line resource with molecular and phenotypic data, enabling cross-species comparisons and immunocompetent transplantation studies.
- •Mutant KRAS dosage gain through allelic imbalance has cell-type-specific effects, influencing cancer initiation timing and developmental reprogramming, particularly in pancreatic cancer.
- •Tissue- and stage-specific evolutionary needs, such as differentiation blocks in the intestine, select for KRAS-collaborating alterations, dictating cancer progression patterns.
- •Context-dependent epistatic interactions between KRAS and tumor suppressors explain the frequency, zygosity, and acquisition chronology of cancer gene alterations across different entities.
Tags
Abstract
Oncogenes such as KRAS display marked tissue specificity in their oncogenic potential, genetic interactions and phenotypic effects, but the underlying determinants remain largely unresolved1,2,3,4,5. Here, to address these questions, we developed the Mouse Cancer Cell line Atlas, a broad-utility resource of 590 comprehensively characterized models across a wide range of entities (www.mcca.tum.de). Comparative and functional studies using this platform, human cohorts and mice identified core principles underlying tissue-specific evolution of KRAS-initiated cancers. First, we show that mutant KRAS dosage gain through allelic imbalance exerts cell-type-specific effects, defining its timing across entities, as exemplified by dosage-sensitive developmental reprogramming during pancreatic cancer initiation. Second, we highlight how tissue- and stage-specific evolutionary requirements, such as block of differentiation in the intestine, select for KRAS-collaborating alterations. Third, we identified context-dependent epistatic KRAS–tumour suppressor interactions and show that reciprocal dosage sensitivities dictate the entity-specific patterns of cancer gene alterations, explaining their frequency, zygosity and acquisition chronology. These findings highlight how intrinsic and acquired determinants instruct cancer evolution in different tissues, with predictable molecular patterns, temporal dynamics and phenotypic outcomes. Our study provides major advances towards a mechanistic understanding of cancer genomes.
Clinicogenomic landscape of pancreatic adenocarcinoma identifies KRAS mutant dosage as prognostic of overall survival
The origins and genetic interactions of KRAS mutations are allele- and tissue-specific
Main
Cancer genome sequencing efforts have catalogued genetic alterations for all major human cancer types and revealed considerable differences between tissues1,2,3. However, the causes and evolutionary principles shaping cancer genomic landscapes are only partly understood4,5. Cell types differ in their susceptibility to transformation by individual oncogenes, and cancer types initiated by the same oncogene vary in their aggressiveness. Moreover, the same oncogene collaborates with distinct secondary alterations in different tissues, and heterogenous patterns of allelic imbalance at cancer genes further complicate the picture. Mechanistically, these and many other observations in cancer evolution remain largely unexplored.
Comprehensively characterized human cell line collections, such as the Cancer Cell Line Encyclopedia (CCLE)6,7, have become indispensable resources and sources of major discoveries in cancer research8. Although the mouse is the most important mammalian model organism9,10,11, there is no comparable pan-cancer cell line resource available for this species. The mouse offers some unique opportunities, such as the possibility to engineer defined molecular contexts or to model rare cancer types and assemble required sample sizes. Complementarity to human resources also emerges from the possibility to capture desired timepoints or conditions, such as treatment-naive contexts or defined progression stages. Likewise, the potential transplantability of mouse cell lines into immunocompetent hosts can be decisive in a broad spectrum of research contexts, such as the study of cancer ecosystems or the testing of (immuno)therapies9,12.
To address the need for such a mouse resource, we assembled cancer cell lines from a broad spectrum of cancer types. The collection encompasses 590 models, for which we provide multilayered molecular, phenotypic and clinical metadata through an interactive web portal (www.mcca.tum.de). We developed analytical tools to infer immunophenotypes from genomic sequencing data to guide the in vivo use of Mouse Cancer Cell line Atlas (MCCA) lines in immunocompetent settings. By combining MCCA data analyses with functional studies in mice and human investigations, we set out to examine cellular, molecular and temporal parameters in the evolution of cancers initiated by KRAS. Through analysis of prototype entities originating from terminally differentiated or stem cells (pancreas, lung and intestine), we describe hallmark events and mechanisms underlying tissue-specific oncogenesis. Overall, our study supports a deterministic model of cancer evolution that explains genomic alteration patterns in different cancer types.
Development and characterization of the MCCA
To address the limited availability of non-human cell line resources, we developed the MCCA (Fig. 1a,b). We derived primary cell cultures (hereafter, cell lines) from 81 mouse models of cancer, encompassing tumours induced by engineered oncogene/tumour suppressor alleles or exogenous triggers (Supplementary Table 1). Alongside established genetically engineered mouse models, we also developed models to study genetic, inflammation-associated or irradiation-induced cancers. Examples include genetically engineered cholangiocarcinomas, Helicobacter-induced stomach adenocarcinomas or numerous cancer types triggered by γ-irradiation (Supplementary Table 1). Moreover, we characterized 36 publicly available cancer cell lines commonly used in basic and translational research. In total, the MCCA encompasses 590 cell lines, covering 22 lineages and 46 disease types (Supplementary Table 1). To ensure the long-term preservation of cell lines and the high-quality nature of related data, we established rigorous protocols for MCCA handling and characterization (Methods and Extended Data Fig. 1a–j).
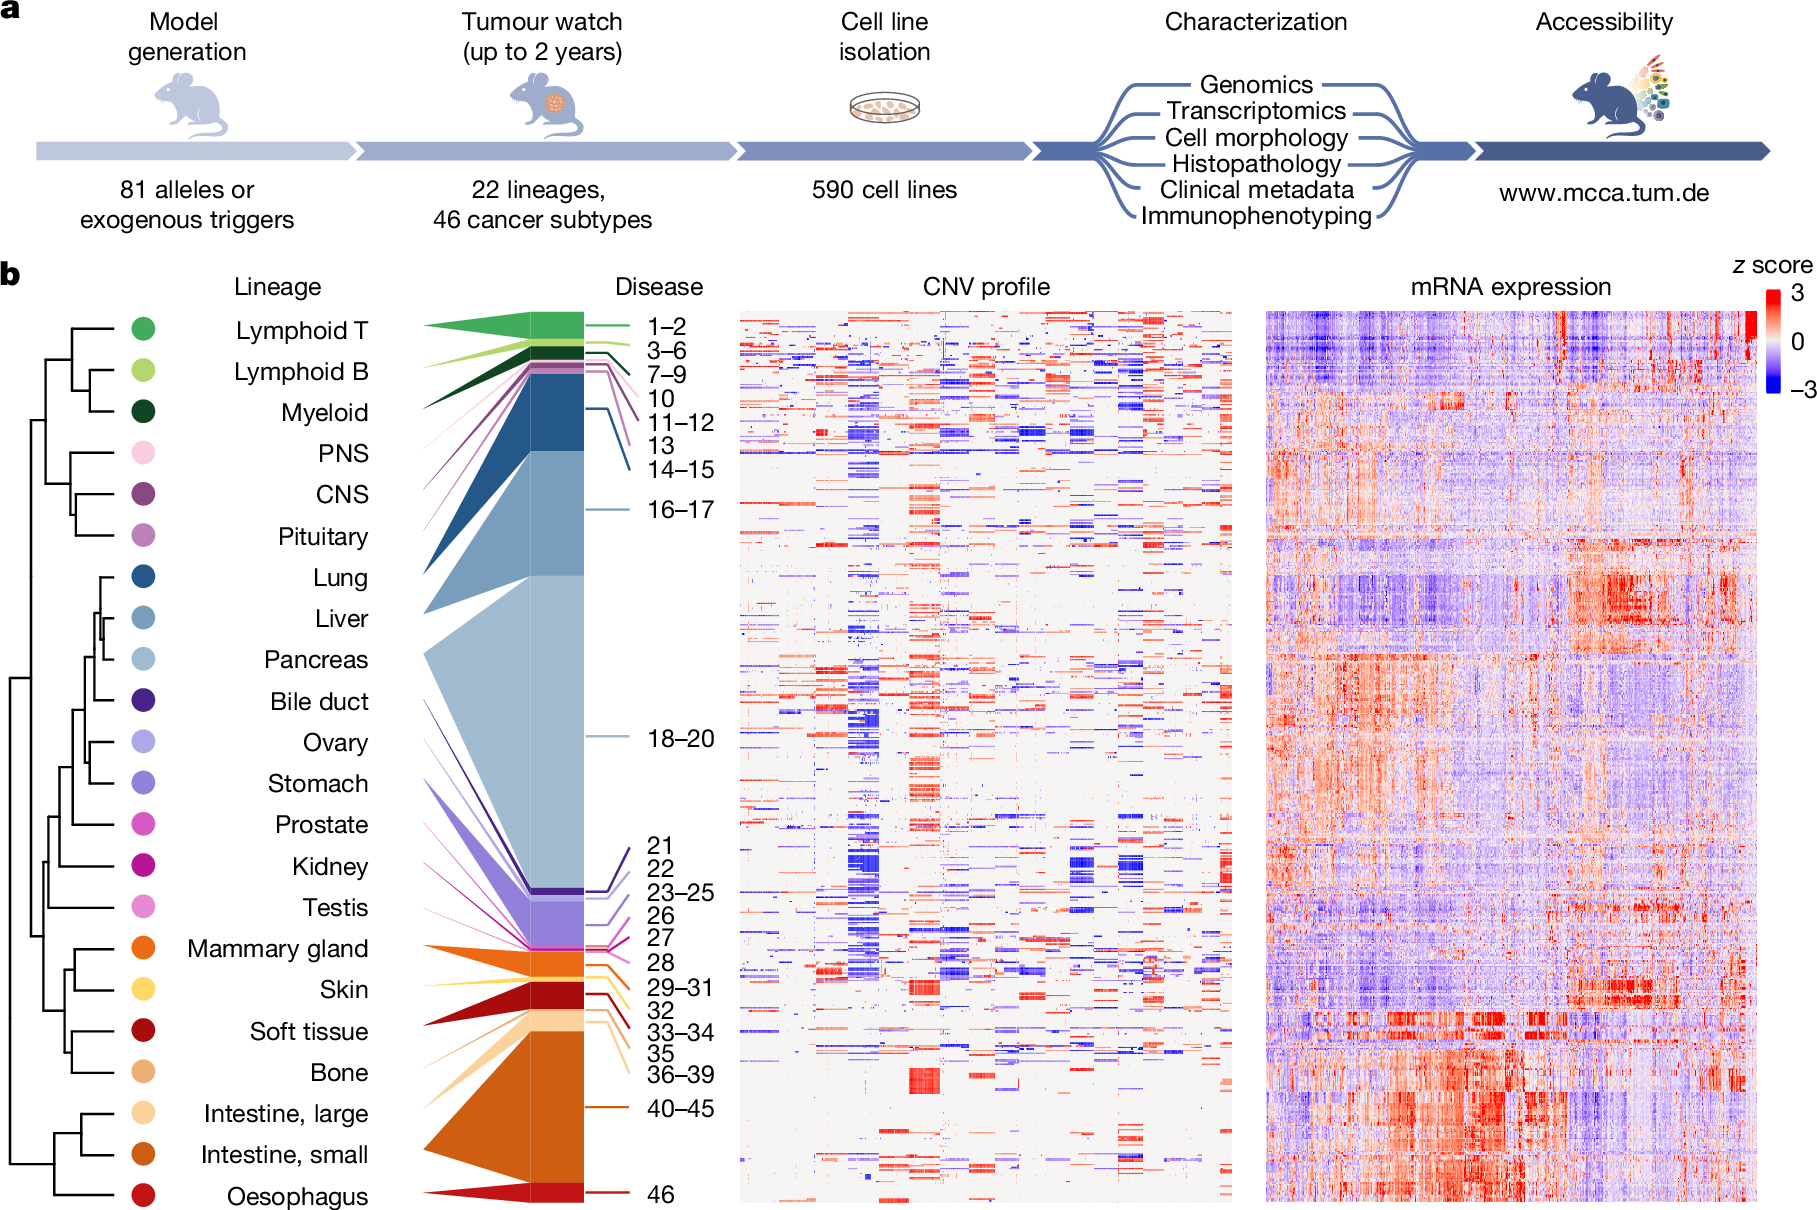
a, Workflow describing the development and characterization of MCCA cell lines. The website providing access to related datasets is indicated. b, Overview of selected MCCA datasets derived from the characterization of 590 cell lines, including 36 previously available lines. Cancer types are ordered by unsupervised hierarchical clustering of their transcriptome mean values. Within individual cancer types, each cell line is sorted by transcriptome clustering. Full MCCA annotation is provided in Supplementary Table 1. CNS, central nervous system; PNS, peripheral nervous system.
For each cell line, we provide multiple data layers in the MCCA, including some not systematically captured in human collections (Fig. 1a,b). First, we sequenced MCCA lines and generated genomic and transcriptomic profiles using our computational pipelines specifically tailored to the mouse genome (MoCaSeq)13,14. Second, we assembled clinical metadata, such as survival and metastasis. Third, after microscopy-based grading of cellular morphology, we assigned each line to one of four distinct epithelial-to-mesenchymal transition (EMT) states (Extended Data Fig. 2a). Fourth, we performed histopathological classification of tumour tissue related to individual MCCA lines (Supplementary Table 1). MCCA therefore represents a comprehensive cell line (and related data) resource for the mouse—the most widely used experimental model in biomedical research.
Integrative analyses of MCCA data
When evaluating MCCA’s use in examining the relationships between molecular and phenotypic data, we observed that separation of transcriptomes is driven by various parameters, including cell lineage, cell state, disease type within a lineage/organ, genotype, disease stage and culture conditions (Extended Data Fig. 2a–q). To facilitate such integrative analyses of molecular, cellular, organismal and temporal data layers, we made all MCCA data accessible through a user-friendly mouse-adapted cBioPortal15,16,17 web interface (www.mcca.tum.de). Exemplary data mining is showcased by correlating pancreatic cancer phenotypes, such as survival or metastasis, with molecular data (Supplementary Video 1).
To examine cross-species relationships, we compared transcriptomes of MCCA and the human CCLE using a correlation-based approach (Methods and Extended Data Fig. 3a–i). For example, among lymphoid cancers, MCCA T cell neoplasms cluster with human T cell leukaemia/lymphoma, while mouse B cell neoplasms align with their human counterparts, including B lymphoblastic leukaemia/lymphoma, multiple myeloma or mature B cell neoplasms. Equivalent analyses within an entity are shown for pancreatic cancer, where mouse and human cell lines with a mesenchymal phenotype and increased dosage of mutant KRAS co-cluster—consistent with oncogenic dosage increase promoting EMT and a basal-like differentiation with poor prognosis18,19. These and similar data for other cancer types (Extended Data Fig. 3a–k) show the broad spectrum of human disease phenotypes and molecular contexts covered by the MCCA. To support the identification of MCCA counterparts of human disease subtypes or CCLE models, we provide Pearson correlation coefficients for all mouse–human cell line pairs (Supplementary Table 4) along with broad molecular and phenotypic annotations (Supplementary Table 1) and further cross-species comparisons at the genomic level (Extended Data Fig. 4a–k).
MCCA immunophenotyping
Immunocompetent transplantation models are of growing importance for biomedical research and preclinical drug testing, especially as immunotherapy landscapes expand at an rapid pace. As cancer cell lines often originate from models with mixed genetic backgrounds, matching donor–recipient immunocompatibility requires immunophenotyping. In principle, relevant information (MHC haplotypes, genetic background, sex) can be obtained from genomic sequencing data, but analytical tools are lacking. We therefore developed methodological approaches and computational tools addressing this need (Methods).
First, for strain background detection, we extracted single-nucleotide polymorphisms (SNPs) for 29 inbred mouse strains using Mouse Genomes Project20 data. By correlating SNP patterns between strains, we identified 15 clusters, which we defined as genealogically related strain groups (Extended Data Fig. 5a). This assignment was critical for delineating strain-specific signature SNPs (SNPs unique for each of the 15 strain groups but allowed to be shared within the same group). These signature SNPs (n = 1,097,314) enabled highly accurate detection of strain composition (Fig. 2a–c and Extended Data Fig. 5b,c). Supplementary Table 5 lists corresponding data for all of the MCCA lines. Notably, non-dominant genetic backgrounds can remain detectable despite extensive backcrossing, as exemplified for cell line MCCA0417, which was derived from a C57BL/6-backcrossed mouse carrying the Ptf1acre, KrasLSL-G12D and Trp53LSL-R172H alleles originally engineered in 129-related stem cells. Owing to genetic linkage, 129 signature SNPs in close genomic proximity to engineered alleles ‘withstand’ backcrossing to C57BL/6 mice (Fig. 2a), thereby contributing around 4% 129 background. Such effects are critical for estimating backcrossing status from genomic data (Methods, Extended Data Fig. 5d and Supplementary Table 5).
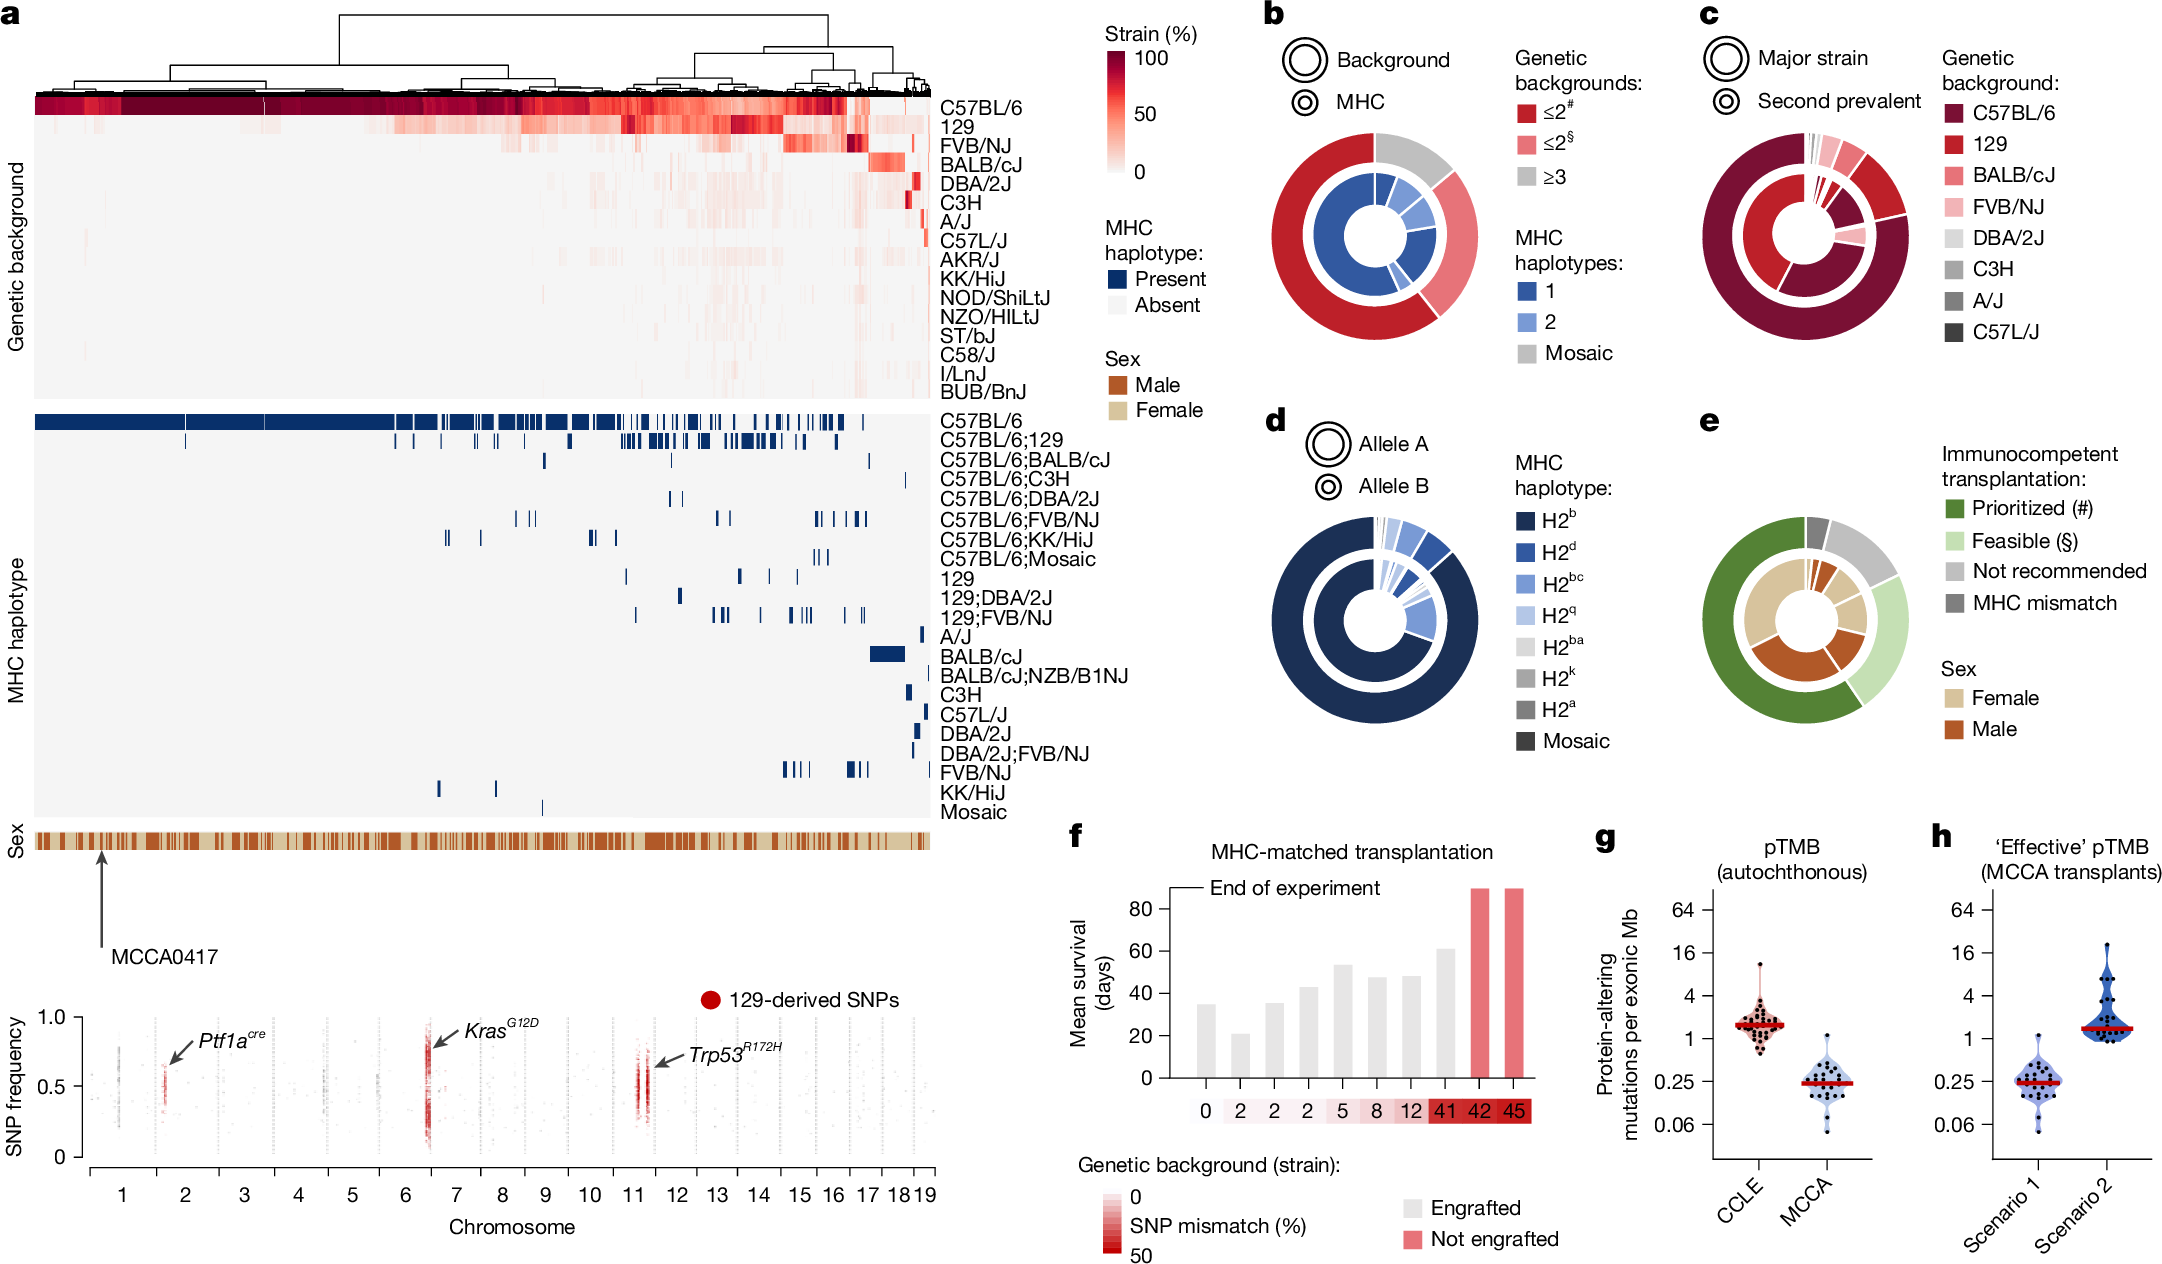
a, Inference of strain background composition, MHC haplotypes and sex for MCCA lines from genome sequencing data. Top, overview of MCCA immunophenotypes. Cell lines are ordered by unsupervised hierarchical clustering of genetic background composition. Bottom, genome-wide SNP plot of a C57BL/6-backcrossed cell line (MCCA0417). Note the persistence of the 129-mouse signature SNPs in proximity to genetically engineered alleles. b–e, Immunophenotype characteristics across the MCCA. b, The distribution of genetic backgrounds and corresponding MHC haplotypes. Prioritized (#) and feasible (§) lines are defined in the caption for e. c, Genetic background (strain composition) per cell line, considering the two highest-ranking strains only. d, MHC haplotype distribution for both alleles (A,B) per cell line. e, Choice of MCCA transplant recipients: recommendations are indicated for each MCCA line based on their genetic background(s), MHC haplotype(s) and sex information. Prioritized (#), MCCA lines with one or two genetic backgrounds (in a few cases, with a third genetic background contributing <1%; exemplary transplant scenarios are shown in h). Feasible (§), MCCA lines with two dominant genetic backgrounds and a third background contributing 1–9% of SNPs (exemplary transplant scenarios are shown in Extended Data Fig. 6f). Not recommended, MCCA lines with three dominant backgrounds. f, Survival of immunocompetent mice transplanted with MHC-matched mPACA lines with various degrees of strain SNP mismatch (n = 63 transplantations). Only mPACA lines with incomplete Cdkn2a inactivation were compared. g,h, TMB (considering protein-changing alterations, pTMB) of MCCA lines in different experimental contexts, shown for PACA lines with C57BL/6-derived MHC and C57BL/6;129-SNP contributions (n = 27). g, In autochthonous tumours, somatic protein-altering mutations define pTMB. Human PACA lines are displayed for comparison (CCLE, n = 41). h, In MHC-matched transplantations using the corresponding cell lines, the ‘effective’ pTMB is recipient dependent. Scenario 1 (C57BL/6;129-F1 recipients): only somatic mutations contribute to ‘effective’ pTMB. Scenario 2 (C57BL/6 recipients): somatic mutations and 129-strain-specific germline variants can be immunogenic (increased ‘effective’ pTMB).
Second, for MHC haplotype detection, we divided the MHC locus into six gene clusters (H2-K, -A, -E, -D, -Q and -T) on the basis of MHC subclasses. Precise classification of MHC clusters is crucial for preventing T cell-mediated transplant rejection. We correlated SNP data for each gene cluster to assign 29 inbred strains into genetically conserved MHC subclass haplotypes, defined by 44,219 signature SNPs (Extended Data Fig. 5e). These MHC signature SNPs were used to determine MHC-subclass-specific haplotypes, which enabled us to define the combined/full MHC haplotype (Extended Data Fig. 5f,g). Overall, 83% of cell lines possess MHC alleles from C57BL/6-related (H2b) and/or 129-related (H2bc) strains (Fig. 2d). In rare cases, additional complexity can arise from meiotic crossover events in mouse cohorts with mixed genetic backgrounds. For example, we detected mosaic MHC haplotypes generated through recombination of 129- and FVB-derived MHC H2-T gene clusters (Fig. 2d and Extended Data Fig. 5h).
Third, we determined immunophenotypes for all cell lines by combining genetic background (SNP composition), MHC haplotype and sex information (Supplementary Table 5). We found that 60% of cell lines possess immunophenotypes from one or two inbred strains, allowing transplantation into one strain or matched F1 hybrid mice (most commonly 129;C57BL/6; Fig. 2c,e and Extended Data Fig. 6a). Importantly, most entities are represented in this group. The remaining lines had immunophenotype contributions from more than two strains. Although donor–recipient matching is still possible at the MHC level, SNP mismatching could affect transplantability. However, in 56% of cases (23% of the MCCA), the third-background SNP contribution is less than 10%, which is often tolerated in transplantation experiments. To exemplify this, we performed MHC-matched transplantations (Fig. 2f). As expected, cell lines with the highest SNP mismatch to recipients (42% and 45%) did not engraft, whereas lines with ≤12% mismatch engrafted robustly. Notably, one line with 41% mismatch and intact MHC expression/competence (Extended Data Fig. 6b–d) formed cancers, albeit with long survival.
Overall, these results highlight the importance of annotating MCCA immunophenotypes, which will guide precise recipient selection in future studies (Supplementary Table 5).
Somatic and germline variants in MCCA
In transplantation experiments, not only somatic mutations in cell lines, but also strain-specific germline variants, can contribute to tumour mutational burden (TMB) and immunogenicity, depending on the recipient. This is illustrated by transplanting pancreatic cancer cell line MCCA0349 into distinct MHC-matched recipients. MCCA0349 was derived from a C57BL/6-backcrossed mouse with Ptf1acre and KrasLSL-G12D alleles originally engineered in the 129 background. Its MHC haplotype is therefore C57BL/6, but 129-associated SNPs in proximity to Ptf1acre and KrasLSL-G12D ‘withstood’ backcrossing.
In the first scenario, MCCA0349 is transplanted into C57BL/6;129-F1 hybrid mice. Here, only somatic mutations (n = 26 protein-altering mutations, yielding a protein-altering TMB (pTMB) of 0.4 per Mb exome), but not strain-specific germline variants, contribute to immunogenicity and pTMB. Equivalent data for other pancreatic cancer cell lines with similar MHC and strain characteristics (Fig. 2g,h) show that this transplantation scenario exhibits a lower pTMB compared with human cancers.
In the second scenario, MCCA0349 is transplanted into C57BL/6 mice. Here, the ‘effective’ pTMB amounts to 103 protein-altering mutations (1.4 per Mb exome; 26 somatic mutations plus 77 129-related SNPs). Modelling this scenario for all MCCA pancreatic cancer lines with similar MHC and strain contributions (Fig. 2h) revealed that the majority possesses an ‘effective’ pTMB comparable to human cancers (Fig. 2g). These results corroborate previous observations that syngeneic transplant models often respond better to immunotherapies compared with their autochthonous counterparts12.
Notably, in scenario 2, the MCCA lines with the highest 129-strain contributions displayed ‘effective’ pTMB levels similar to the MSH2-mutant human line SNU324. Moreover, considering MCCA lines with over two genetic backgrounds for MHC-matched transplantations gives further flexibility to create experimental settings with high mutational burden (Extended Data Fig. 6e,f). Thus, strain-specific germline variants can be exploited to design immunocompetent transplantation experiments with desired levels of ‘effective’ pTMB (Supplementary Table 6).
KRAS gene dosage variation across entities
KRAS is the most frequently mutated human oncogene21. While allelic imbalance at mutated KRAS has been shown to exacerbate oncogenic signalling18,19,22,23,24, its timing, biological consequences and genetic interaction partners in different tissues are mostly unclear. To address these questions, we analyse Kras allelic imbalance in MCCA lines from pancreatic (mPACA), lung (mLUCA) and intestinal (mINCA) carcinomas initiated in KrasLSL-G12D mice25. By integrating single-nucleotide variant (SNV) and copy-number var