Cortical development dynamics across autism spectrum disorder mouse models
Abstract
Despite the functional diversity of over 100 causal genes1,2,3, phenotypic convergence across models may reveal common neurobiological processes in autism spectrum disorder (ASD). Here we profiled 251 samples from 11 monogenic mouse models of ASD using single-nucleus multi-omic sequencing across three developmental stages, both sexes and two brain regions. Despite genetic heterogeneity, ASD-linked mutations converged on perturbations of the radial glial cell lineage. These alterations reflect a transient developmental delay rather than lasting lineage misspecification and resolve by postnatal stages. Molecularly, the largest transcriptional differences emerged in neurons at early postnatal stages. These changes included downregulation of synaptic and ion channel-related genes, consistent with homeostatic adaptation or delayed maturation. Network analysis showed molecular convergence across models within each developmental stage, suggesting that diverse mutations linked to ASD impinge on common, stage-specific processes. Convergence becomes less pronounced by postnatal day 14, highlighting the dynamic nature of ASD-associated changes. Cross-genotype heterogeneity is superimposed on stage-specific effects. Electrophysiology corroborated this pattern: mutants generally showed altered neuronal excitability and synaptic properties with model-specific nuances. Our study also highlighted sex-specific gene expression alterations, with female mice often displaying larger effect sizes than male mice. Together, our findings provide a comprehensive view of developmental cellular and molecular dynamics across models of ASD.
Main
Several studies have uncovered the heterogeneous genetic landscape of ASD, identifying numerous monogenic forms4,5. Although these discoveries are crucial for understanding ASD biology, fundamental questions remain: how mutations that are scattered across many genes lead to similar disorders; and how similar these genetically defined ASDs are to one another.
Here we used single-nucleus multi-omics sequencing to study 251 samples from mouse models of high-risk genes linked to ASD, spanning developmental stages, sexes and two brain regions (Fig. 1a). These data comprehensively represent cell states across ASD-associated mutants, uncovering converging as well as diverging phenotypes.
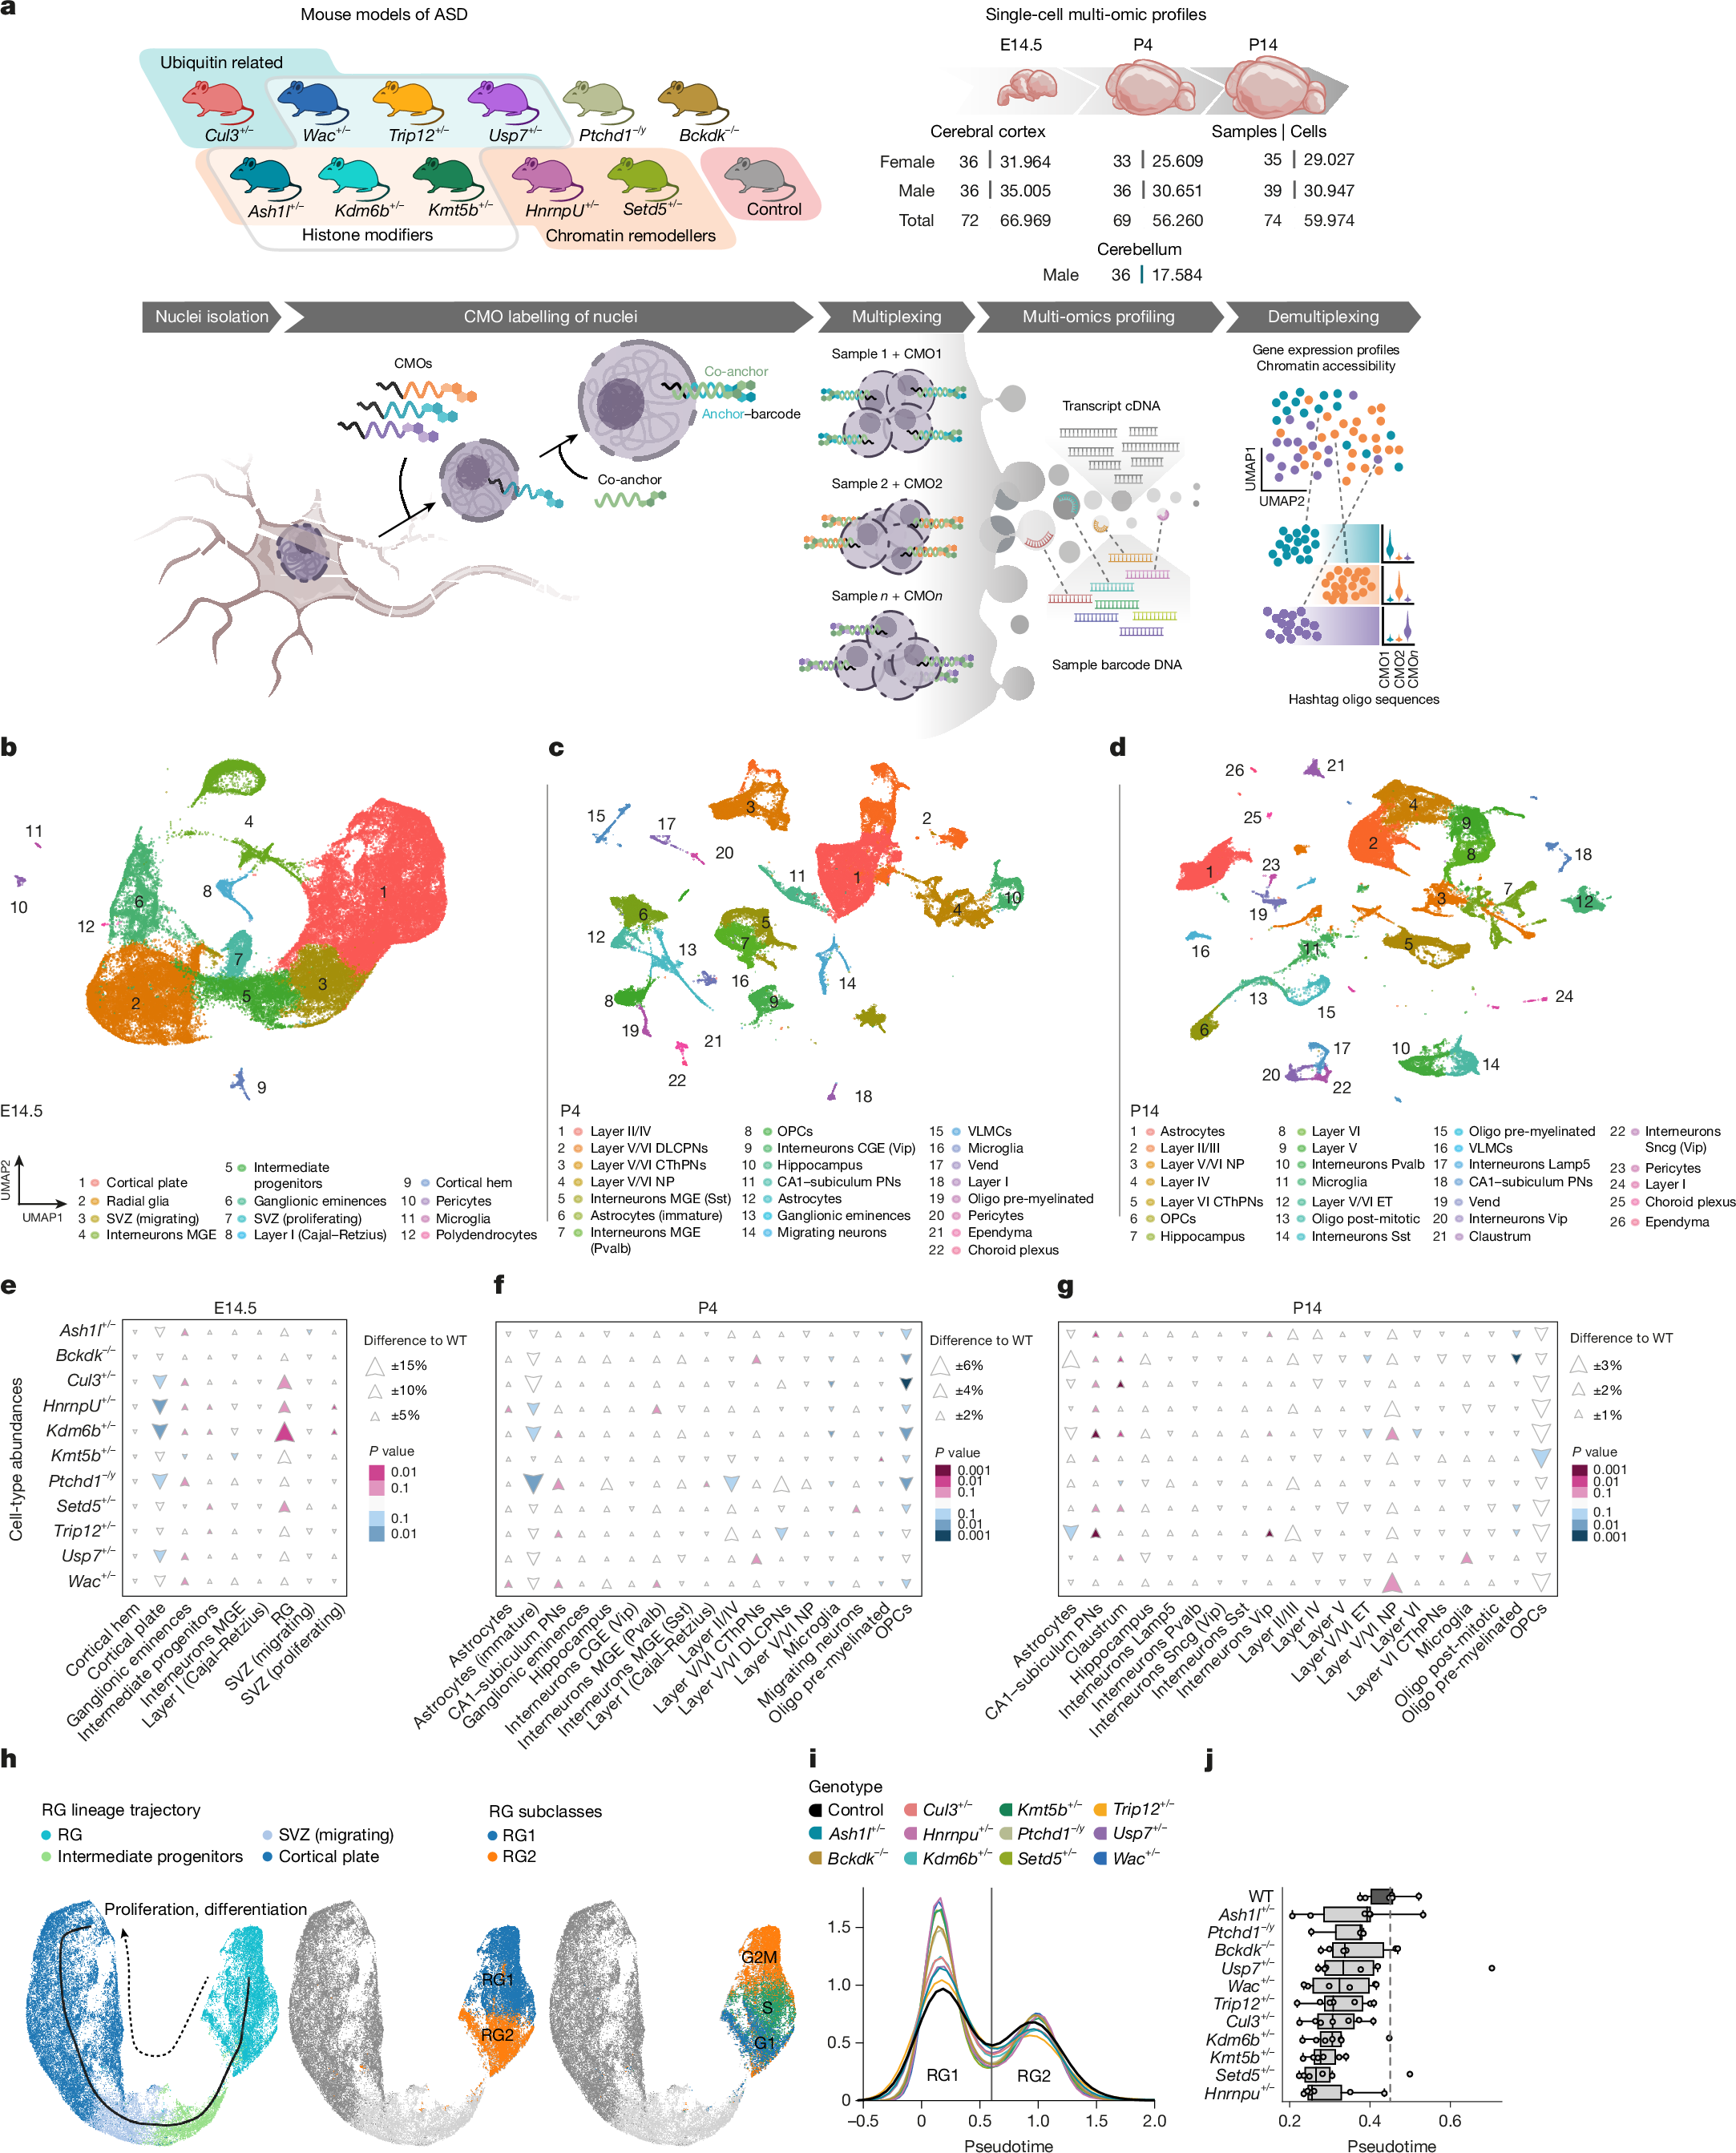
a, Simultaneous transcriptome and chromatin accessibility profiling of brain samples from 11 monogenic mouse lines, each carrying a mutation in a high-risk gene linked to ASD. An overview of the experimental design is shown, indicating total samples and cells analysed per time point. Illustration of the multi-omics approach created by J. Kirchner. b–d, Uniform manifold approximation and projection (UMAP) visualization of integrated snRNA-seq and snATAC-seq data from E15.4 (b), P4 (c) and P14 (d). Cell clusters are coloured and numbered by cell type. ET, extratelencephalic-projecting neurons; NP, near-projecting; PN, projection neuron; SVZ, subventricular zone; Vend, vascular endothelial cells; VLMC, vascular leptomeningeal cell. e–g, Changes in cell-type abundances in individual mutants linked to ASD from E14.5 (e), P4 (f) and P14 (g). The arrowheads indicate relative percentage differences compared with WT. Statistical significance was assessed in edgeR using a two-tailed quasi-likelihood F-test. Nominal P values are shown. h, Pseudotime analysis of the RG lineage at E14.5. The solid line indicates the trajectory inferred from gene expression embedding (Methods). The dashed arrow indicates the trajectory from the RG (root) towards cortical plate cells (left). Two RG subpopulations were distinguished: RG1 (G1/S phase) and RG2 (G2 phase) (centre and right). i, Pseudotime analysis of RG cells indicating that mutants linked to ASD tend to remain in the proliferating RG1 subpopulation. The vertical line marks the boundary between two modes of the pseudotime distribution. j, Median pseudotime analysis of RG cells indicates a consistent developmental delay in mutants linked with ASD compared with WT. The centre line represents the median, the box limits show the 25–75% interquartile range (IQR), the whiskers extend to the furthest data points within 1.5× the IQR from the box edges, and the data points outside this range are represented as dots. The dashed line indicates the median of the WT per-sample averages. Animals used for analyses: n (E14.5) = 7 (Cul3+/−, Kdm6b+/− and Trip12+/−), 6 (Ash1l+/−, Bckdk−/−, HnrnpU+/−, Kmt5b+/−, Setd5+/−, Usp7+/−, Wac+/− and colony-matched controls) and 3 (Ptchd1−/y); n (P4) = 6 (Ash1l+/−, Bckdk−/−, Cul3+/−, HnrnpU+/−, Kdm6b+/−, Setd5+/−, Trip12+/−, Usp7+/−, Wac+/− and colony-matched controls), 4 (Kmt5b+/−) and 3 (Ptchd1−/y); n (P14) = 8 (Ash1l+/− and Cul3+/−), 7 (colony-matched controls), 6 (Bckdk−/−, HnrnpU+/−, Kdm6b+/−, Kmt5b+/−, Setd5+/−, Trip12+/−, Usp7+/− and Wac+/−) and 3 (Ptchd1−/y).
Single-nucleus multi-omics profiling
Droplet-based single-cell multi-omic technologies enable matched gene expression and chromatin accessibility profiling in thousands of single cells in one experiment. However, existing methods remain costly and limited in scalability. Here we optimized a multiplexing strategy for combined single-nucleus RNA sequencing (snRNA-seq) and single-nucleus assay for transposase-accessible chromatin using sequencing (snATAC-seq). We utilized a multiplexing approach using cholesterol-modified oligos (CMOs)6 as sample-specific barcodes (Fig. 1a and Supplementary Table 1), enabling pooled processing. In this way, we profiled 45 conditions comprising 251 samples (Supplementary Table 1), including mutants and controls, allowing us to assess transcriptional and chromatin states at single-cell resolution across a broad range of genetic ASD mouse models (Fig. 1a; Methods).
In total, we collected the molecular profiles of 200,787 nuclei (66,969 at embryonic day 14.5 (E14.5), 56,260 at postnatal day 4 (P4) and 59,974 at P14 for the forebrain; 17,584 at P4 for the cerebellum). We detected an average of approximately 3,900 transcripts, about 2,000 genes and approximately 4,200 fragments per cell at a median sequencing depth of about 25,000 reads per cell (Supplementary Figs. 1d and 3a), aligning with standard recommendations for these types of analyses.
We identified 12 (E14.5), 22 (P4), 26 (P14; cortex) and 16 (P4; cerebellum) major cell types (Figs. 1b–d and 6a; Methods). All samples and genotypes were similarly distributed across clusters (Extended Data Fig. 1a–f and Supplementary Table 1). Each cluster was annotated based on canonical marker gene expression and established mouse brain cell-type classifications (Extended Data Fig. 1g–j).
At E14.5 (Fig. 1b), the cell types comprised primarily cortical plate neurons (expressing Bcl11b and Satb2), radial glial (RG) cells (Pax6 and Gas1) and intermediate progenitors (Unc5d), with a small fraction of medial ganglionic eminence (MGE)-derived interneurons (Nxph1). At postnatal stages (Fig. 1c,d), we differentiated between upper (layers II–IV and layer II/III; Cux1, Cux2 and Bcl11a) and lower (layer V/VI deep-layer cortical projection neurons (DLCPN); Bcl11b, Ldb2 and Pex5l) cortical layers, including corticothalamic projection (layer V/VI corticothalamic projection neuron (CThPN) and layers IV–VI; Gse1, Tle4 and Zfpm2) and near-projecting neurons (layer V/VI; Epha6 and Lingo2). As samples included the hippocampus, we distinguished between hippocampal cells (Cacna2d3, Nr3c2 and Epha6) and adjacent CA1–subiculum projection neurons (Tshz2 and Tshz3). Glial cells were first observed at P4, including oligodendrocyte precursor cells (OPCs; Pdgfra and Cspg4) and their maturation stages (Itpr2 and Plp2 for postmitotic; and Mpb for pre-myelinated), astrocytes (Ptprz1, Slc1a3 and Apoe) and microglia (Hexb, Cx3cr1 and Csf1r).
Consistent with the timely cortical positioning of interneurons, we identified several interneuron populations from P4 onwards, including caudal ganglionic eminence (Int. CGE (Vip) and Int. Sncg (Vip); Adarb2, Gad2, Vip and Synpr) and MGE-derived interneurons (Int. MGE (Pvalb), Int. Sst and Int. Lamp5; Erbb4, Lamp5, Nxph1 and Sst).
Our dataset thus provides a comprehensive view of the cellular landscape of the developing mouse cerebral cortex (Fig. 1b–d), consistent with previous reports7,8,9,10.
RG progression defects in mutants linked to ASD
To explore how mutations associated with ASD affect cortical development, we initially compared the relative proportion of each cell type in all mutants combined versus wild-type (WT) controls (Extended Data Fig. 2a–c). Overall proportions were similar; however, cortical plate cells and OPCs were significantly depleted in mutants at E14.5 and P4 (Extended Data Fig. 2a,b), respectively. Stratifying by genotype confirmed that these changes were consistent across mutants (Fig. 1e–g), with stronger trends in Cul3, HnrnpU, Kdm6b and Ptchd1. The reduction in cortical plate cells at E14.5 coincided with an increased proportion of RG cells (Fig. 1e). At P4, neuronal numbers were similar between mutants and WT; however, mutants displayed a reduction in the number of immature astrocytes and OPCs (Fig. 1f). These reductions were independently confirmed in two selected mutants, HnrnpU+/− and Kdm6b+/−, by in situ hybridization for Slc1a3 (immature astrocytes) and Pdgfra (OPCs; Extended Data Fig. 2d). These observations independently suggest a delay in the RG cell lineage progression, potentially affecting the gliogenic switch. This delay was pronounced in mutants exhibiting larger differences in RG and cortical plate cell numbers at E14.5, such as Cul3, HnrnpU, Kdm6b, Ptchd1 and Setd5 mutants. At P14, OPC numbers remained lower across mutants linked with ASD, whereas the number of other cell types had normalized (Fig. 1g).
To identify the source of these alterations, we investigated RG lineage progression by performing pseudotime analysis on the E14.5 dataset (Fig. 1h). By analysing the trajectories from RG cells towards cortical plate neurons, we identified two RG subpopulations (RG1 and RG2; Fig. 1h,i). RG1 cells were characterized by the expression of proliferation markers (for example, MKi67), indicating active cell division. Pseudotime analysis revealed that mutant RG cells tend to remain in the proliferating RG1 state (Fig. 1h–j) at the cost of delayed differentiation.
To validate alterations in RG cell proliferation, we performed EdU labelling at E14.5 in Kdm6b+/− and HnrnpU+/− embryos and WT littermates (Extended Data Fig. 2e,f′ and Supplementary Video 1). Consistent with the snRNA-seq results, both HnrnpU+/− and Kdm6b+/− mutants showed increased numbers of EdU-positive cells, indicative of prolonged proliferation and/or an expanded pool of proliferative RG cells at E14.5 (Extended Data Fig. 2e,f′).
We next analysed differentially expressed genes (DEGs) in RG1 cells shared across mutants by comparing all mutants, collectively, to WT RG1 cells. Only two genes, Rsrp1 and Galnt17, were significantly downregulated (Extended Data Fig. 2g). Rsrp1 encodes a protein implicated in splicing and cell cycle regulation11. Galnt17 is an N-acetylgalactosaminyltransferase that has been linked to developmental delay and neural differentiation defects12. Although these two genes may represent biomarkers for neurodevelopmental delay, they are unlikely to fully account for the observed RG progression phenotype. The analyses of each mutant separately showed variable DEG numbers (false discovery rate (FDR) < 0.1) in RG1 cells, with some mutants showing few or no DEGs, suggesting that in some cases, delays may originate earlier during development. HnrnpU was the most affected (more than 150 DEGs; Supplementary Table 2). Although other mutants showed fewer DEGs, several DEGs were detected in multiple mutants. For example, HnrnpU, Kdm6b and Kmt5b mutants showed downregulation of Setbp1, a gene linked with ASD implicated in neural differentiation13. Nrcam, an ASD-associated cell-adhesion gene14, was downregulated in Kdm6b+/− and Kmt5b+/− RG1 cells (Supplementary Table 2).
Together, our data indicate a shared delay in RG lineage progression across mutants associated with ASD, but limited convergence in the potential underlying mechanisms.
Convergent early postnatal changes in mutants linked with ASD
To investigate the effect of mutations linked with ASD across development and cell types, we performed pseudobulk differential gene expression analysis within each cell type, comparing all mutants collectively to WT controls, thereby identifying shared transcriptional changes (Fig. 2a, all mutants; and Supplementary Table 3). This analysis revealed numerous DEGs at P4 in layer II/IV (715 DEGs, adjusted P < 0.05) and layer V/VI DLCPN (600 DEGs) neurons, most of which were downregulated in mutants. Few or no DEGs were detected in other cell types and time points when considering all mutants together. Aggregating cell types into broader cell subclasses (for example, aggregating all excitatory neurons; Extended Data Fig. 3a and Supplementary Table 4), confirmed that P4 excitatory neurons showed the strongest shared DEG signal (Extended Data Fig. 3a′).
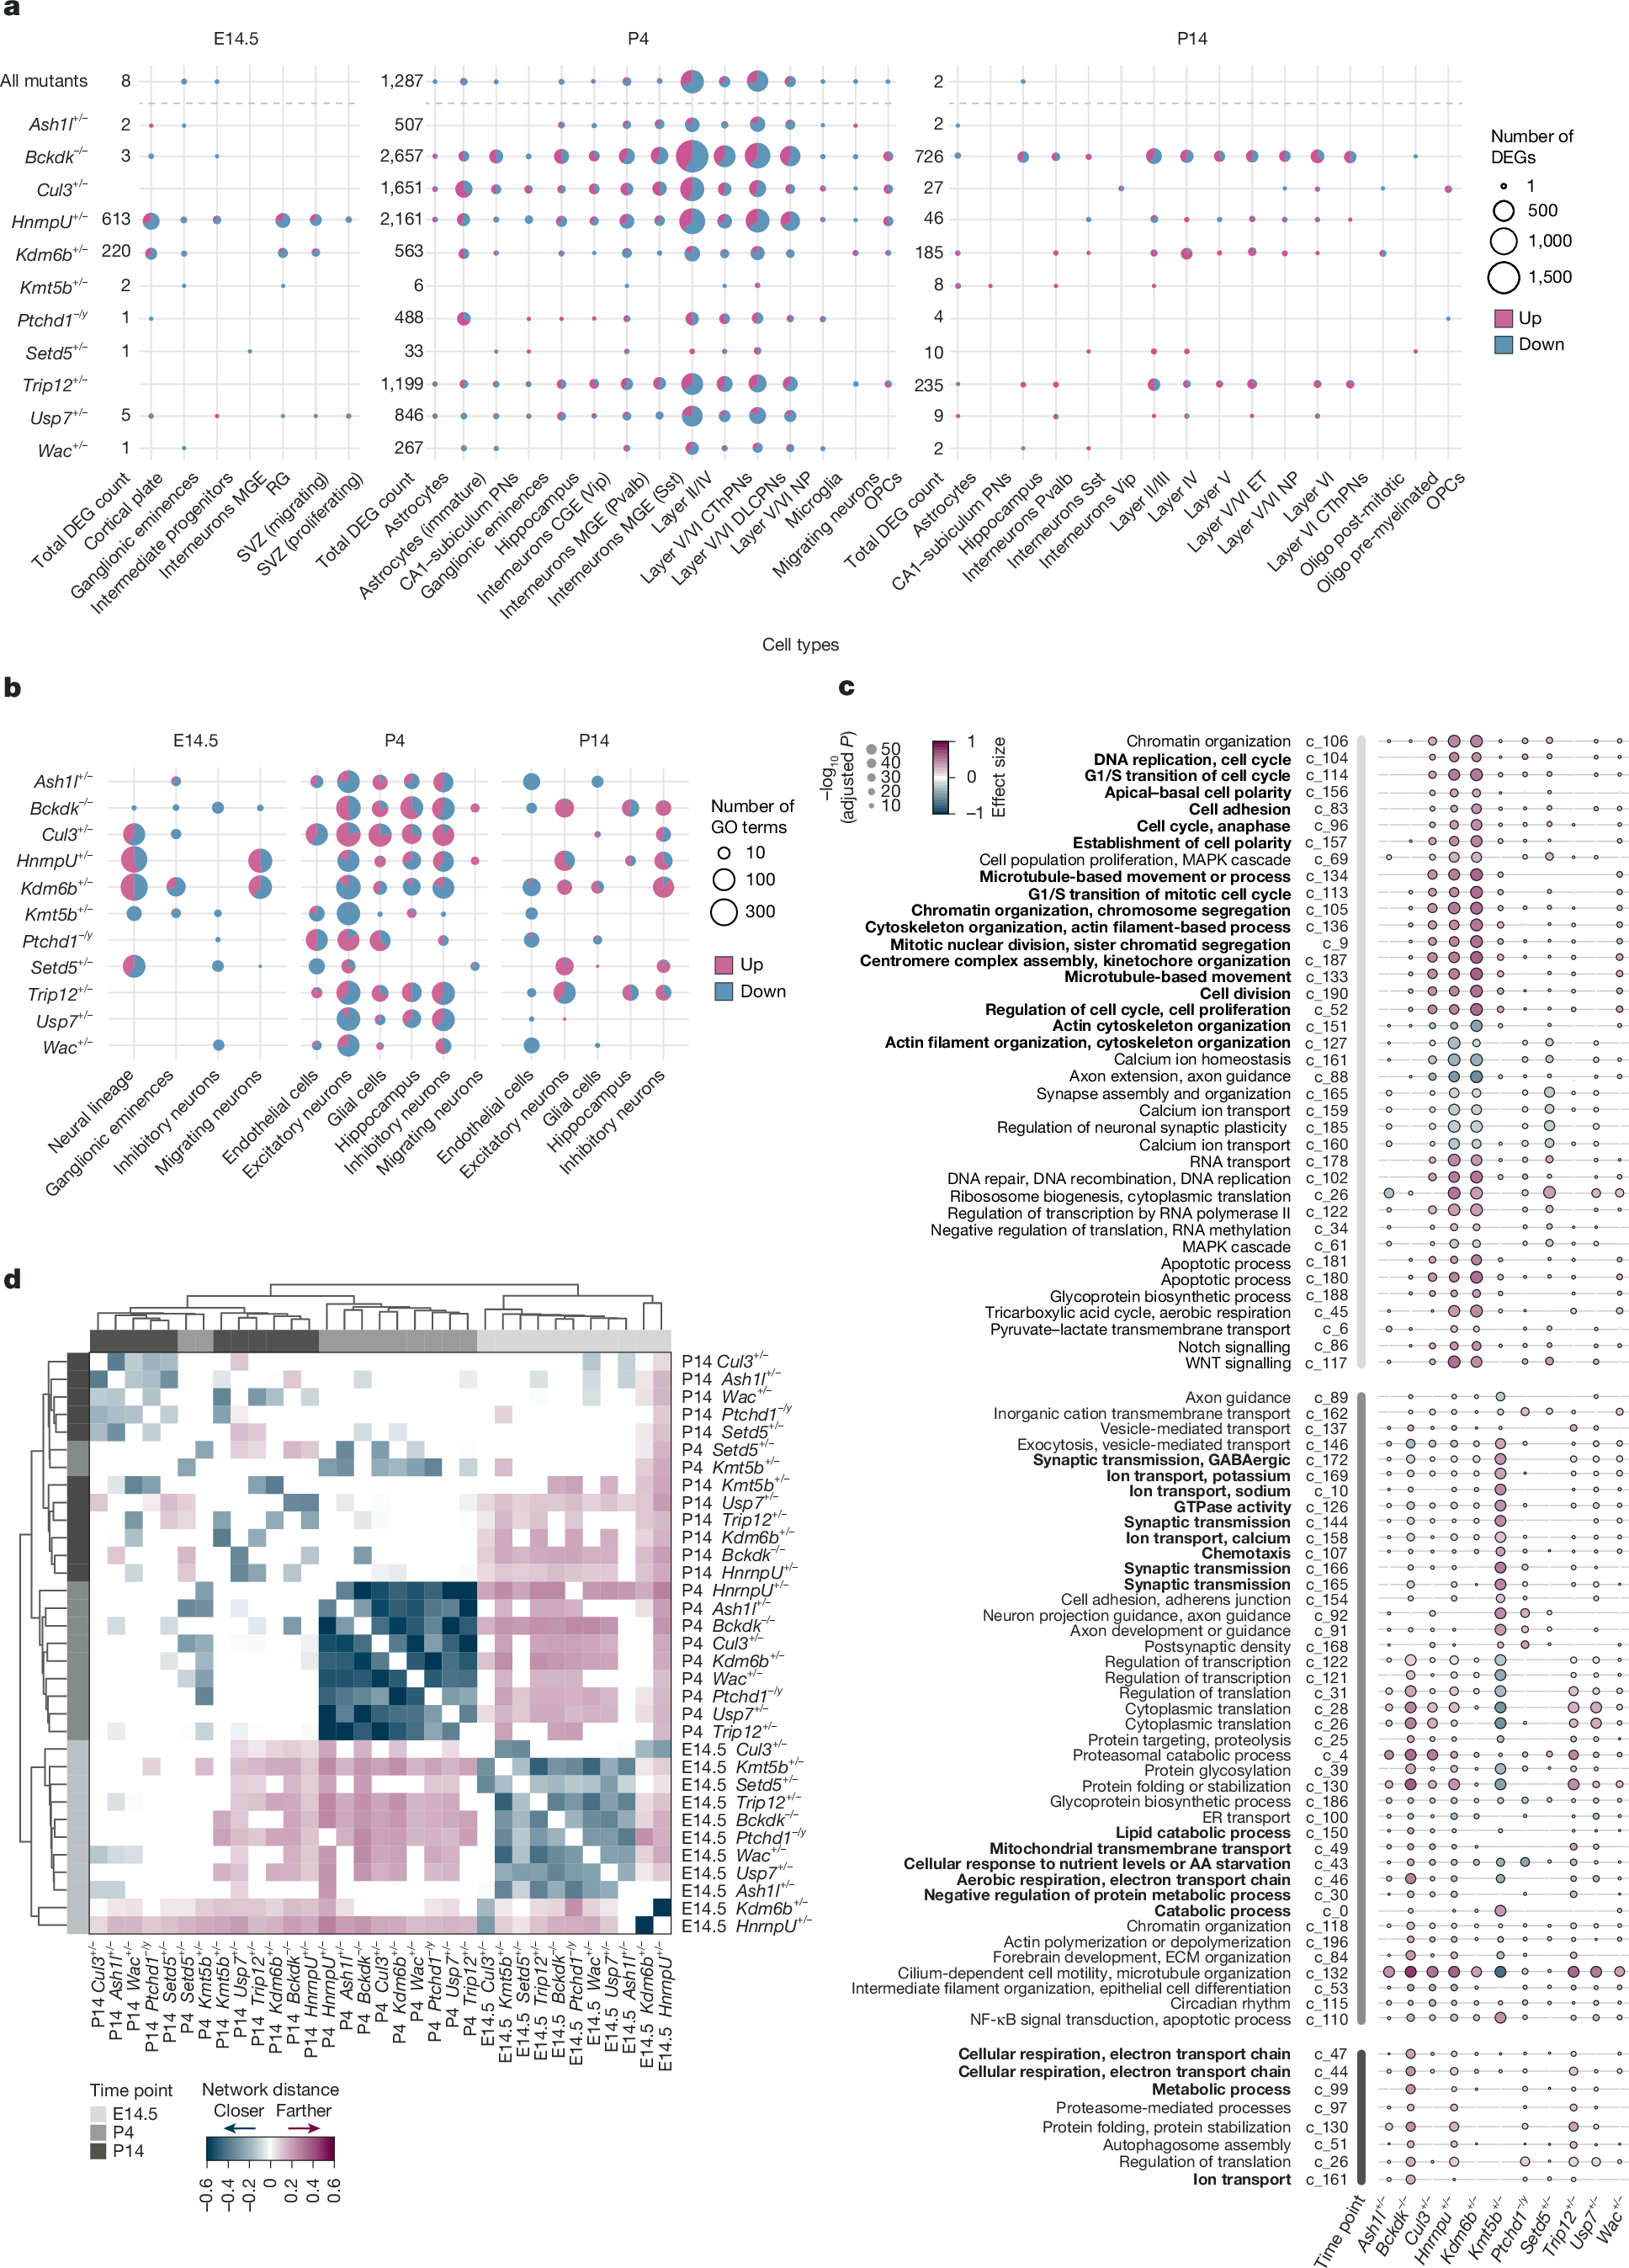
a, Number of DEGs (adjusted P < 0.05) across mutants and cell types. ‘All mutants’ denotes mutants analysed collectively compared with colony-matched controls. Total DEG counts are summarized per time point across cell types, counting repeated DEGs only once. Statistical significance was assessed using a two-sided Wald test in DESeq2 with Benjamini–Hochberg correction for multiple testing. b, Number of Gene Ontology (GO) terms identified by GSEA (FDR < 0.05) at each time point. The colours indicate the direction of the normalized enrichment score. Gene Ontology terms were simplified to remove redundancy; all three sub-ontologies (Biological Processes, Molecular Function and Cellular Component) are included. GSEA was performed using clusterProfiler, with a Kolmogorov–Smirnov-like statistic, permutation-based testing, and Benjamini–Hochberg correction (Methods). c, For each genotype, the magnitude (that is, effect size) and significance of expression changes in network clusters representing biological processes in excitatory neurons are shown. Processes mentioned in the text are highlighted in bold. Coefficients were tested against zero using two-sided Student’s t-tests and Benjamini–Hochberg multiple comparison test. Those with adjusted P < 0.1 were considered significant and marked with a black outline in the plot. AA, amino acid; ECM, extracellular matrix; ER, endoplasmic reticulum. Grey bar colours are as in panel d. d, Pairwise distances between DEG network localizations in excitatory neurons across genotypes and developmental stages. Smaller distances denote greater similarity (convergence). Animals used for analyses: n (E14.5) = 7 (Cul3+/−, Kdm6b+/− and Trip12+/−), 6 (Ash1l+/−, Bckdk−/−, HnrnpU+/−, Kmt5b+/−, Setd5+/−, Usp7+/−, Wac+/− and colony-matched controls) and 3 (Ptchd1−/y); n (P4) = 6 (Ash1l+/−, Bckdk−/−, Cul3+/−, HnrnpU+/−, Kdm6b+/−, Setd5+/−, Trip12+/−, Usp7+/−, Wac+/− and colony-matched controls), 4 (Kmt5b+/−) and 3 (Ptchd1−/y); n (P14) = 8 (Ash1l+/− and Cul3+/−), 7 (colony-matched controls), 6 (Bckdk−/−, HnrnpU+/−, Kdm6b+/−, Kmt5b+/−, Setd5+/−, Trip12+/−, Usp7+/− and Wac+/−) and 3 (Ptchd1−/y).
Next, we analysed each mutant separately against WT. Most genotypes showed more than 700 DEGs across cell subclasses and time points, counting repeated DEGs once (Extended Data Fig. 3b). At E14.5, changes were limited, except in HnrnpU+/− and Kdm6b+/−, which exhibited numerous DEGs affecting cortical plate, RG and subventricular zone migrating cells (Fig. 2a, left). Conversely, P4 showed widespread transcriptional changes across genotypes and cell types (Fig. 2a, centre), with excitatory neurons most affected. Several mutants also showed many DEGs in inhibitory neurons and glia. By P14, DEG numbers declined (Fig. 2a, right). Individual mutants (aggregating replicates per genotype) consistently showed more DEGs than all genotypes together, indicating that many changes are not shared across genotypes. The distribution of upregulated and downregulated DEGs was more balanced in individual mutants than in the collective analysis. However, some mutants showed few DEGs across all analysed time points, including mice with mutations in histone modifier genes, such as Kmt5b, Setd5 and Wac (Fig. 2a and Extended Data Fig. 3b). This suggests that mutations in this gene class may, at these stages and under baseline conditions, have subtle effects on gene expression, affecting few genes or causing small expression changes that are difficult to detect.
To control for potential effects of sequencing depth and enable comparisons of DEG counts across mutants, cell types and time points, we downsampled each group to a matched sequencing depth. This confirmed previous trends: excitatory and inhibitory neurons were similarly affected, whereas glial cells showed weaker transcriptional changes, except for Cul3 mutants, where glial cells showed a stronger transcriptional response than neurons (Extended Data Fig. 3c).
Mutants exhibited significant DEG overlap across time points (Extended Data Fig. 3d), independently validating these DEGs and indicating persistent molecular alterations. For example, HnrnpU+/− had DEGs associated with the cell cycle (for example, Ccnd2, Cdk4 and Mef2c), axonogenesis (for example, Dscam2, Sema5a and Robo2) and transmembrane transporters (for example, Cacnb3, Gabra4 and Gria4) overlapping across early and perinatal development. Trip12+/− shared DEGs across time related to metabolic processes (for example, Eef1a1 and Nceh1) and synaptic signalling (for example, Nrxn3, Syt5 and Rims1) at P4 and P14 (Extended Data Fig. 3d).
Neuronal subclasses shared DEGs across mutants, particularly in P4 excitatory neurons, where approximately 10% of DEGs were shared by at least four mutants (Extended Data Fig. 3e). By contrast, the overlap between neuronal and non-neuronal cells within the same mutant was minimal. To assess whether overlaps exceeded random expectation, we compared each mutant pair against distinct sets of control samples randomly divided into two disjoint groups (Methods). The results indicated stage-dependent, non-random convergence on shared transcriptional responses across genotypes (Extended Data Fig. 3f).
Next, we compiled the most frequent DEGs across mutants and cell types (Extended Data Fig. 3g and Supplementary Table 1). This set included a large proportion of genes associated with ASD (34%) and was enriched for genes encoding synaptic proteins (q = 1.03 × 10⁻¹⁵; Extended Data Fig. 3h). These proteins localize to presynaptic and postsynaptic compartments and are involved in synaptic translation, actin cytoskeleton, synapse organization, and membrane channel and receptor function (Extended Data Fig. 3g,h). The directionality of these alterations was largely consistent across mutants.
Although similarities in gene expression patterns and pathway alterations were evident, genotype-restricted changes were also prominent, with at least 50% of DEGs in each cell type identified only in a single genotype (Extended Data Fig. 3e).
To validate the snRNA-seq results, we performed bulk RNA-seq on a subset of mutants and time points and, despite methodological differences, found significant DEG overlap, with concordant effect directions and magnitudes (Extended Data Fig. 3i).
These results pinpoint critical periods and highlight variations in developmental trajectories across mutants linked with ASD, with some mutants having greater effects earlier and others later. We also identified shared DEGs across mutants associated with ASD, underscoring convergent mechanisms that probably reflect stage-specific developmental processes.
Functional pathway disruptions in mice with mutations linked with ASD
To identify biological processes affected by mutations associated with ASD, we used gene set enrichment analysis (GSEA), which captures coordinated gene set changes beyond DEG cut-offs and provides a broader perspective on cell states.
We performed GSEA in individual mutants at the cell-subclass level. Consistent with the DEG analysis, the effects were most pronounced at P4, although GSEA also revealed differences at E14.5 and P14 (Fig. 2b, Extended Data Figs. 4–6a and Supplementary Table 5). For example, we identified enrichment of gene sets in neural lineage cells at E14.5 in Cul3, Kmt5b and Setd5, in addition to HnrnpU and Kdm6b mutants (Supplementary Table 5).
At E14.5, several mutants exhibited changes in pathways associated with cell cycle regulation, chromosome segregation and neuronal projection development (Extended Data Figs. 4a and 6b). At P4, mutants displayed changes in pathways related to synaptic and ion channel functions. Synapse-related transcripts were also affected at P14 (Extended Data Fig. 4b,c).
Inhibitory neurons showed fewer enriched gene sets than excitatory neurons, but were qualitatively similarly affected, with terms related to synaptic transmission, intracellular signalling, ion channels and transmembrane transporters (Extended Data Fig. 5a,b). Glial cells were generally less affected than neurons, except in Cul3 and Ptchd1 mutants (Extended Data Fig. 6a and Supplementary Table 5). Certain gene sets in neurons were oppositely regulated at P4 and P14 (Extended Data Fig. 5). For instance, synaptic transmission and organization were downregulated in P4 Kdm6b-mutant neurons but upregulated at P14.
We refined GSEA to identify cell-type-specific features (Supplementary Table 6). For example, RG and cortical plate cells shared disruptions in neurogenesis-related terms but also showed distinct features. HnrnpU and Kdm6b mutations altered cell-cycle-relevant transcripts in RG cells, probably contributing to the developmental delay observed through pseudotime analysis. Conversely, synaptic signalling and developmental processes were predominantly affected in cortical plate cells (Extended Data Fig. 6b). GSEA also revealed more enriched terms in the excitatory neurons of layer II/IV, corticothalamic and near-projecting layer V/VI, and parvalbumin-expressing (PV+) interneurons, whereas hippocampal and somatostatin-expressing (SST+) neurons showed fewer terms (Supplementary Table 6).
Several mutants showed deregulation of axonogenesis and dendrite morphogenesis-related genes. In most mutants, DEGs associated with these processes were upregulated in PV+, SST+ and vasoactive intestinal peptide-expressing (VIP+) interneurons, but downregulated in excitatory layer II/IV neurons. Cul3+/− and Ptchd1−/y were exceptions, showing upregulation of DEGs in the latter. Cul3 and Ptchd1 mutants also exhibited increased synaptic gene expression in immature astrocytes and VIP+ interneurons (Supplementary Table 6). Ptchd1−/y and Setd5+/− had minimal effects on synaptic gene expression in excitatory neurons across cortical layers, aligning with previous findings