Clonal-aggregative multicellularity tuned by salinity in a choanoflagellate
TL;DR
The choanoflagellate Choanoeca flexa exhibits a unique 'clonal-aggregative' multicellularity, forming sheets through cell division, aggregation, or both. This versatility is an adaptation to its fluctuating splash pool environment, challenging previous assumptions about choanoflagellate multicellularity.
Key Takeaways
- •Choanoeca flexa forms multicellular sheets through clonal (cell division), aggregative (cell assembly), or combined mechanisms.
- •This 'clonal-aggregative' multicellularity is an adaptation to dynamic splash pools with salinity fluctuations.
- •The findings challenge the traditional view that choanoflagellates exhibit only clonal multicellularity.
Tags
Abstract
Multicellularity evolved independently multiple times in eukaryotes1,2,3,4. Two distinct mechanisms underpin multicellularity5: clonality (serial cell division without sister-cell separation) and aggregation (whereby independent cells assemble into a multicellular entity). Clonal and aggregative multicellularity are traditionally considered to be mutually exclusive1,6,7,8, with rare exceptions9, and evolutionary hypotheses have addressed why multicellularity might diverge towards one or the other extreme3,4. Both animals and their sister group, the choanoflagellates, are currently known to acquire multicellularity only clonally4,10,11. Here we show that the choanoflagellate Choanoeca flexa12 forms motile and contractile cell monolayers (sheets) through multiple mechanisms—C. flexa sheets can form purely clonally, purely aggregatively or through a combination of both processes. We characterize the life history of C. flexa in its natural environment—ephemeral splash pools on the island of Curaçao—and show that C. flexa undergoes reversible transitions between unicellularity and multicellularity during evaporation–refilling cycles. Different splash pools house genetically distinct strains of C. flexa and kin recognition constrains aggregation between them. We show that clonal-aggregative multicellularity is a versatile strategy for the robust establishment of multicellularity in this variable and fast-fluctuating environment. Our findings challenge former generalizations about choanoflagellates and expand the option space of choanozoan multicellularity.
In-depth single-cell transcriptomic exploration of the regenerative dynamics in stony coral
First putative occurrence in the fossil record of choanoflagellates, the sister group of Metazoa
Main
Multicellularity evolved independently many times across eukaryotes13, with multiple origins of both clonality and aggregation2,4. Efforts to reconstruct the origin of animal multicellularity have benefited from the study of their closest living relatives, the choanoflagellates2,4,11,14,15 (Fig. 1a). Choanoflagellates are bacterivorous aquatic microeukaryotes bearing an apical flagellum surrounded by a collar of actin-filled microvilli11 (Fig. 1b,c). Moreover, many species display facultative multicellularity. The best-characterized choanoflagellate, Salpingoeca rosetta16, forms colonies exclusively clonally10, and clonal multicellularity has classically been assumed to be a general choanoflagellate feature4,11,17. However, this assumption remains to be tested across choanoflagellate diversity. Notably, although animal multicellularity is purely clonal, other close relatives of animals exhibit diverse forms of multicellularity, including aggregation in filastereans18,19 and cellularization of multinucleated cells20,21 or cleavage-like serial cell divisions21,22,23,24 in ichthyosporeans.

a, Choanoflagellates (turquoise) are the sister group to animals (Metazoa). The phylogenetic relationships depicted are based on previous studies2,12. Polytomies indicate uncertain relationships. b, Bright-field image of a C. flexa sheet in its relaxed conformation (shown in the schematic). Inset: magnified view of the dashed square showing flagella (magenta pseudocolour) and collar–collar contacts between cells (green pseudocolour). Scale bars, 20 μm (main image) and 10 µm (inset). n = 3 biological replicates, n = 56 sheets. c, Diagnostic features of a choanoflagellate. C. flexa cells within a sheet are linked by their collars (pink arrow). d, Three-dimensional reconstruction of a confocal z stack of a fixed sheet (inverted conformation, shown in the schematic), with cell bodies stained with a membrane/cytoplasmic dye (FM 1-43FX, magenta) and collars stained with an F-actin dye (phalloidin-rhodamine, white). n = 7 biological replicates, n = 30 sheets. Scale bar, 20 μm. e, Stills from a bright-field timelapse analysis of sheet formation by serial cell division from a single cell (white arrowhead). After each division, sister cells remain connected by collar–collar contacts (black arrow). Note that cells retract their flagellum during division. Time is shown as h:min. n = 3 biological replicates. Scale bar, 10 μm. f, The cell lineage tree as a function of time in e shows asynchronous divisions during colony formation (approximately every 8–10 h). g, Stills from a bright-field timelapse analysis of a medium-sized sheet expanding by cell division (orange, pink, blue and yellow pseudocolour) and by aggregation (white arrow, green pseudocolour). Time is shown as h:min. n = 2 biological replicates, with n = 2 technical replicates each (n = 4). Scale bar, 25 μm. h, Schematics of the mechanisms that establish multicellularity in C. flexa: colonies can form and grow by cell division but might also expand by aggregation. Sister cells adhere to each other through collar–collar contacts (pink arrowhead). The figure is related to Supplementary Fig. 1 and Supplementary Videos 1–3.
Here we describe an unconventional mode of multicellularity in the choanoflagellate C. flexa12 that challenges prevailing assumptions about choanoflagellates. We show that C. flexa colonies form by serial cell division, aggregation or a combination of both, a mechanism that we refer to as clonal-aggregative multicellularity. We propose that this mixed multicellularity represents an adaptation to the dynamic natural environment of C. flexa: ephemeral splash pools that undergo extreme salinity fluctuations during cycles of evaporation and refilling.
C. flexa sheets can form clonally
C. flexa forms curved monolayers of polarized cells (or sheets) connected by direct collar–collar adhesions12 (Fig. 1b–d). Sheets can reversibly invert their curvature in response to light-to-dark transitions, switching between feeding and swimming states12,25 (Fig. 1b–d). In an earlier study, we established laboratory cultures of C. flexa sheets from a single cell, indicating that sheets can arise from individual cells12. Nevertheless, the mechanisms that establish C. flexa multicellularity remain unclear.
In an attempt to image colony formation, we isolated single cells from mechanically dissociated sheets and monitored them using time-lapse microscopy. We observed formation of sheets by serial cell divisions approximately every 8–10 h (Fig. 1e,f and Supplementary Video 1) giving rise to small, polarized cell monolayers with the signature curved morphology of C. flexa sheets (Fig. 1b,e and Supplementary Video 1). We also monitored small and medium-sized colonies and captured events of colony expansion by cell division (Fig. 1g, Supplementary Fig. 1 and Supplementary Videos 2 and 3). However, we also noticed instances of free-swimming single cells or doublets meeting colonies, attaching and seemingly integrating within sheets (Fig. 1g, Supplementary Fig. 1 and Supplementary Videos 2 and 3). This showed that colonies can form purely clonally but suggested that they might also expand by aggregation. We therefore set out to test whether C. flexa is capable of purely aggregative multicellularity (Fig. 1h).
C. flexa sheets can form by aggregation
To test for aggregation, we performed live imaging of free-swimming single cells from mechanically dissociated colonies (Fig. 2a–d and Supplementary Videos 4–6). Notably, cells aggregated within minutes into doublets connected by collar–collar contacts (Fig. 2c and Supplementary Video 5), and progressively formed larger groups by incorporation of additional cells and fusion between groups (Fig. 2d and Supplementary Video 6). Early aggregates had irregular shapes, reflecting initial collision and adhesion in variable orientations. Over time, these aggregates underwent morphological maturation through cellular reorientations, ultimately forming polarized monolayers with canonical sheet morphology within 24 h (Fig. 2d and Supplementary Video 6).
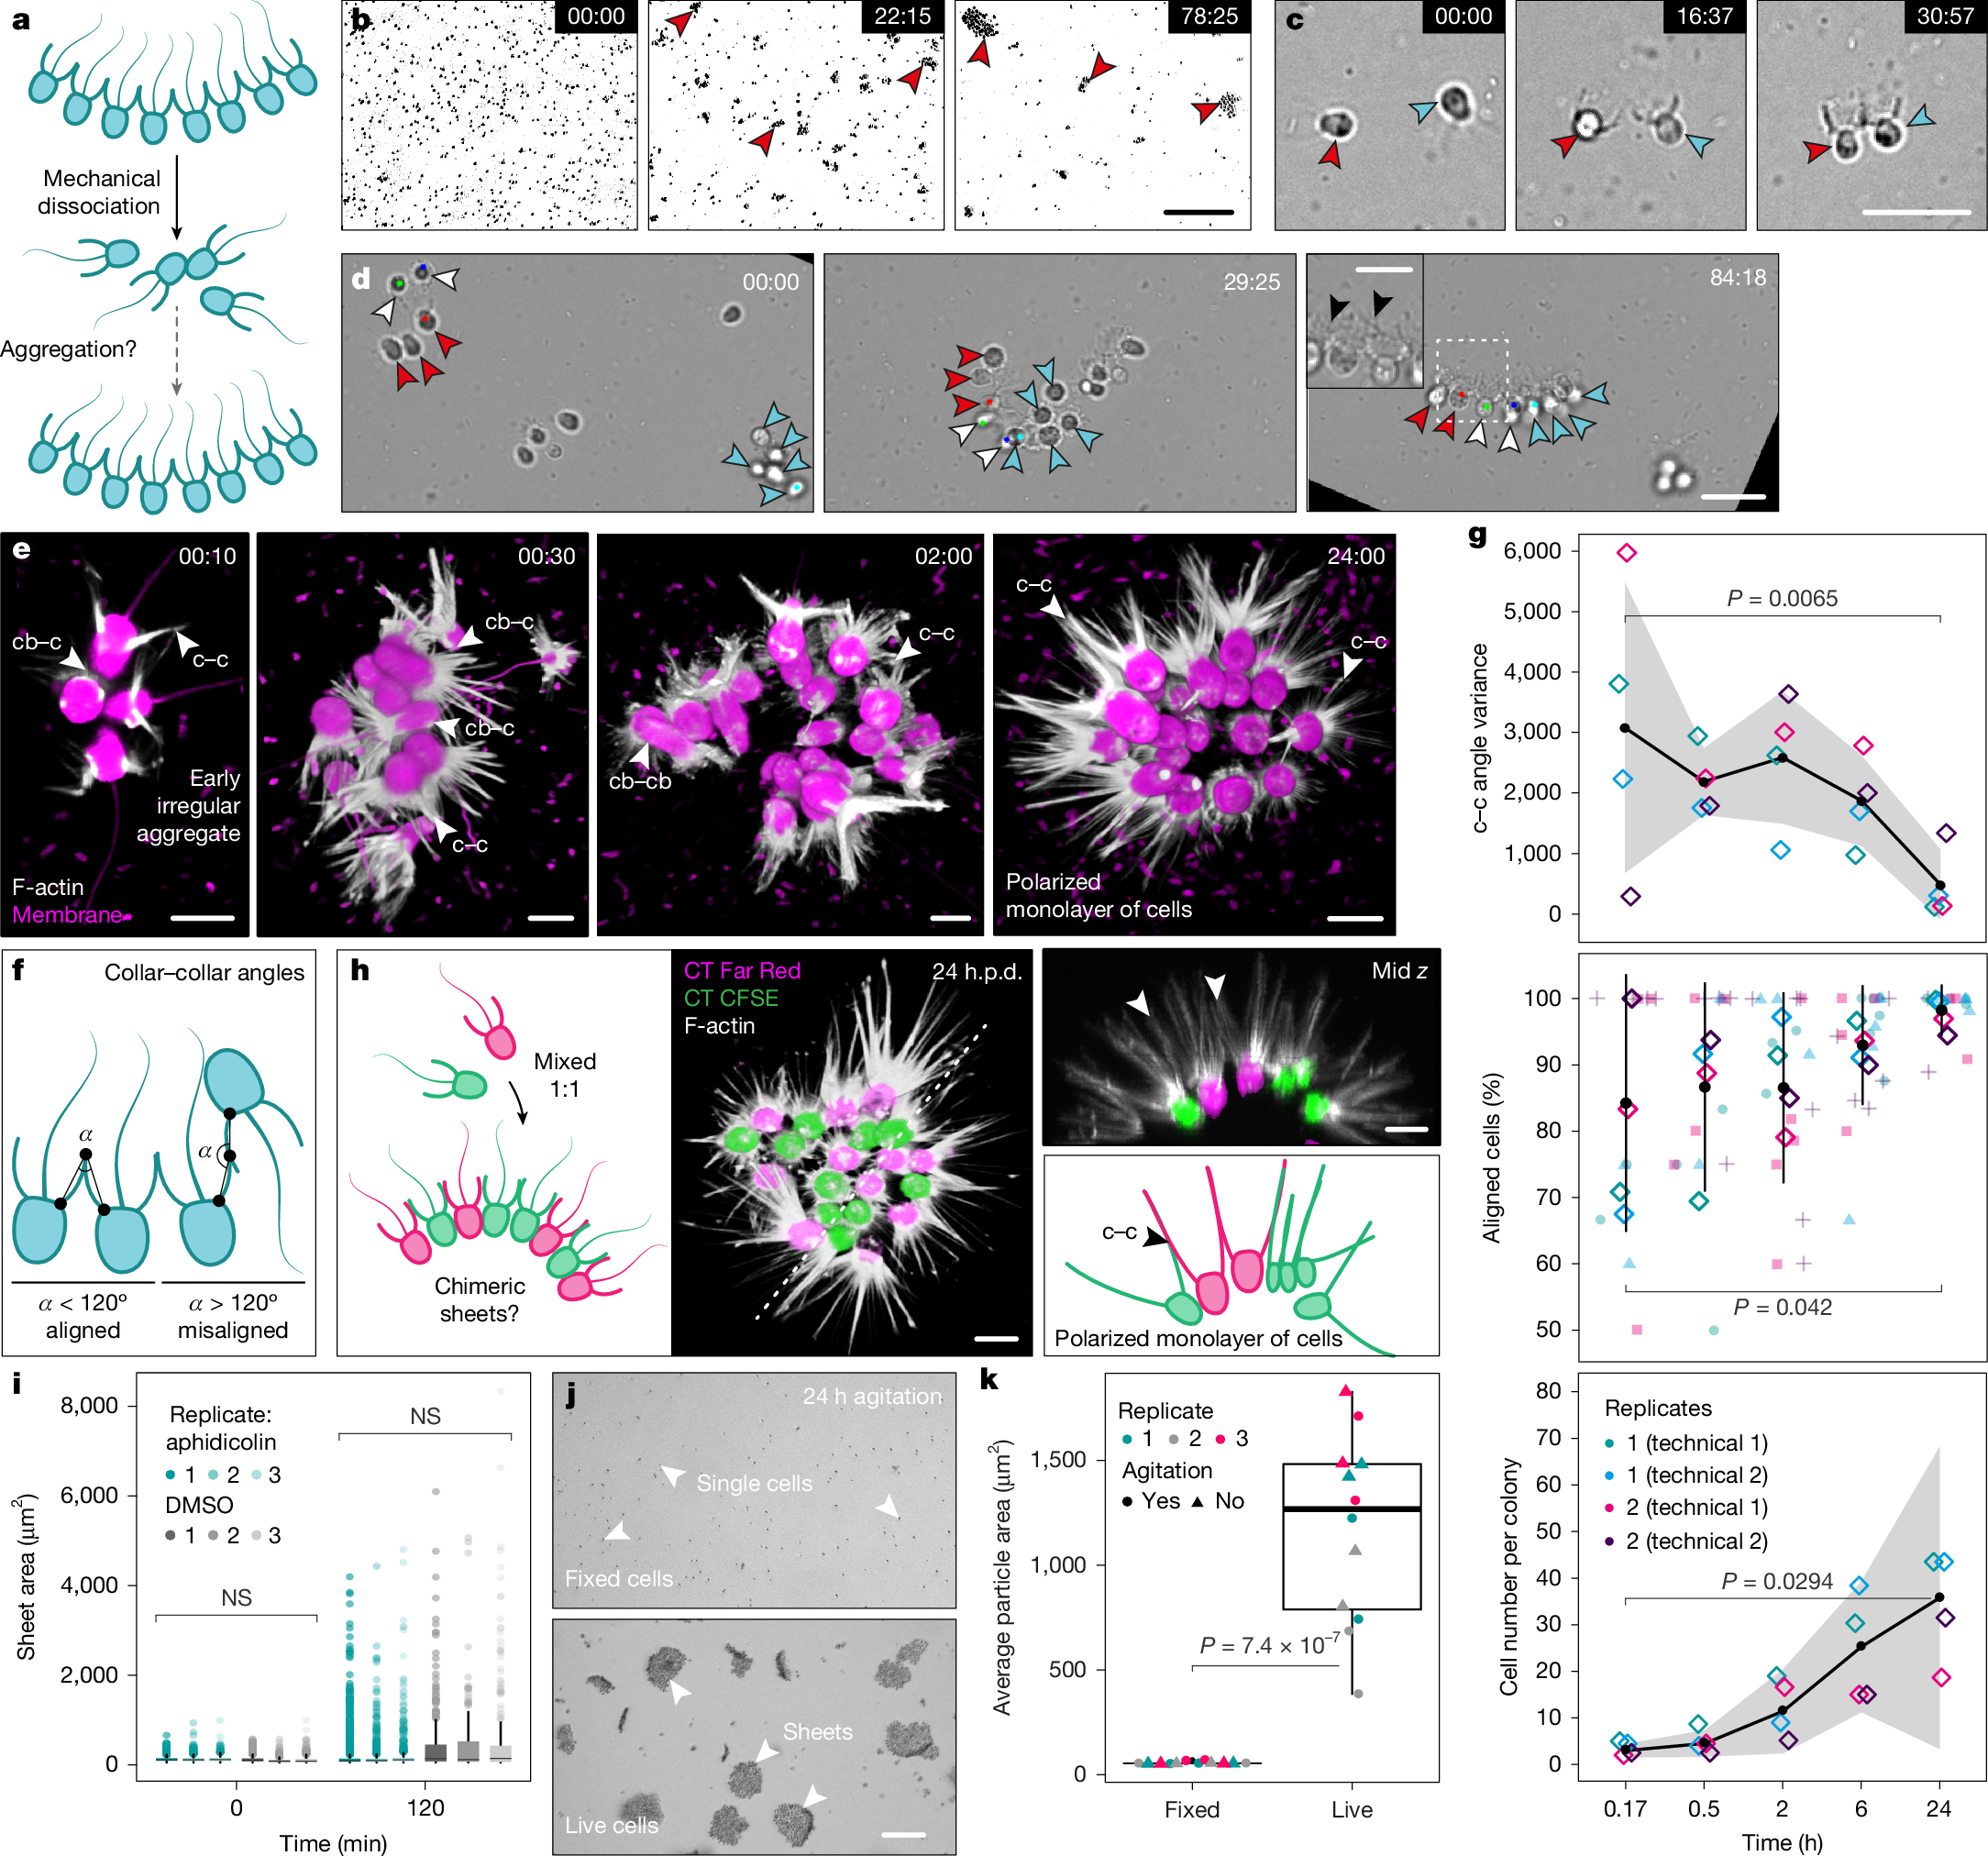
a, The workflow to test aggregation. b, Dissociated flagellates form aggregates (red arrowheads). Scale bar, 100 μm. c, Two flagellates (red and blue arrowheads) aggregate into a doublet. Scale bar, 20 μm. d, A cell doublet (white arrowheads) and two small sheets (red and blue arrowheads) aggregate into a larger sheet. Inset: magnified view of the dashed square, showing collar–collar contacts (black arrowheads). Scale bars, 20 μm (main images) and 10 µm (inset). Time in b–d is shown as min:s. n = 4 biological replicates (experiments in b–d). e, Three-dimensional reconstructions of confocal z stacks of aggregates fixed at different timepoints, stained with a membrane/cytoplasmic dye (FM 4-64FX, magenta) and an F-actin dye (phalloidin, white). cb–c, cell body–collar; cb–cb, cell body–cell body; c–c, collar–collar. Time is shown in h:min. n = 2 biological replicates, n = 2 technical replicates each (n = 75 sheets). Scale bars, 5 μm. f, Aggregation morphometrics: the adhesion angle (α) and the proportion of aligned cells. g, α variance (top), the percentage of aligned cells (middle) and the cell number per colony (bottom) during aggregation in e. The black circles show the mean values; the error bars and grey ribbons show the s.d.; and the diamonds show the replicate means. h, Dissociated flagellates labelled with different colours form chimeric sheets (left). Middle, three-dimensional reconstruction of a confocal z stack. n = 2 biological replicates, n = 2 technical replicates each (n = 16 sheets). h.p.d., hours post-dissociation. Top right, cross-section across the dashed line in the middle image. Bottom right, schematic of the image in the top right, showing collar–collar contacts. Scale bars, 5 μm. i, Quantification of the area during aggregation after treatment with the cell cycle inhibitor aphidicolin (17 µg ml−1) or DMSO (control). n = 3 biological replicates, n = 3 technical replicates each (n = 9). j, Fixed (top) or live (bottom) dissociated flagellates after 24 h agitation. Scale bar, 100 μm. k, Quantification of the average particle area in j. n = 3 biological replicates, n = 2 technical replicates each (n = 6). P values were calculated using Mann–Whitney U-tests (g (top and bottom), i and k); and linear regression (g, middle): adjusted R2 = 0.081. NS, not significant. The figure is related to Supplementary Figs. 2–4 and Supplementary Videos 4–13.
To characterize aggregative morphogenesis, we imaged aggregates fixed at multiple stages (Fig. 2e–g, Supplementary Fig. 2 and Supplementary Videos 7–11). We quantified two metrics: the angles between the collars of neighbouring cells (or collar–collar angle) and the proportion of cells with aligned apicobasal polarity (Fig. 2f and Supplementary Fig. 2a). Both metrics initially showed high variance, consistent with early variable orientations, and progressively converged towards stereotypical values during maturation (Fig. 2e–g, Supplementary Fig. 2 and Supplementary Videos 7–11). Although early aggregates showed diverse types of intercellular contacts (collar–collar, collar–cell body and cell body–cell body; Fig. 2e and Supplementary Fig. 2b), cells in mature colonies were connected almost exclusively by their collars (Fig. 2e, Supplementary Fig. 2b and Supplementary Video 11). At 24 h, colonies averaged around 50 cells, with some reaching about 120 cells (Fig. 2g (bottom) and Supplementary Fig. 2d). These numbers confirmed that sheets could not have formed exclusively through cell division within 24 h, given the cell cycle duration in C. flexa (over 8 h; Fig. 1f), which allows at most 16 cells, assuming maximal and synchronized proliferation.
To independently confirm that sheets observed 24 h after dissociation resulted from early aggregate maturation, we combined two cell populations stained with distinct fluorophores (Fig. 2h, Supplementary Fig. 3 and Supplementary Videos 12 and 13). Cells of different colours readily aggregated (Supplementary Fig. 3a and Supplementary Video 12) and formed morphologically regular chimeric sheets within 24 h (Fig. 2h, Supplementary Fig. 3b,c and Supplementary Video 13). Furthermore, treatment with the cell cycle inhibitor aphidicolin did not abolish aggregation (Fig.