Spatial distribution of the proteome in the human body and in cancers
Abstract
A detailed, spatially resolved quantitative map of the human proteome is essential for a deeper understanding of human biology and disease1,2,3,4. Here we present a comprehensive human proteomic landscape, generated by profiling more than 13,000 proteins across 2,856 samples using data-independent acquisition mass spectrometry. The dataset spans 58 major tissue types, 251 specific tissue subtypes and 25 distinct carcinomas. This resource enables the depiction of spatially resolved proteome trajectories across tissue types and physiological states, including fetal, tumour, adjacent non-tumour and healthy adult tissue, thereby providing insight into both developmental processes and oncogenic progression. Furthermore, quantitative proteomics comparisons across diverse tissue types and states facilitate the indication of organ-specific toxicity, the identification of repurposable anticancer drug candidates and the prioritization of therapeutic targets for cancers. This study establishes a quantitative resource for navigating the proteome in the human body and in common cancers.
Main
Grounded in a genetic blueprint, diverse human tissues and organs with distinct functions arise during development. These functions can become dysregulated in pathological conditions, such as tumours. Characterizing proteomic variation across tissue types in both developmental and pathological contexts is essential for enhancing our understanding of human biology and advancing therapeutic development. Although transcriptomic repositories, such as ArrayExpress5, RNA-Seq Atlas6 and the BioGPS portal7, have provided initial annotations for tissue expression, and the Adult GTEx project has further expanded this using genomic and transcriptomic data from tissue sites that are not affected by disease8,9,10, mRNA abundance correlates only moderately with the expression of proteins, which are the main functional and druggable molecules.
The Human Protein Atlas (HPA), which was launched in 2005, began by incorporating immunohistochemistry-based proteomic data from healthy and cancerous tissues, and has since expanded continuously11. By 2015, the HPA had integrated transcriptomic data from 32 healthy tissue types and proteomic data, based on 20,456 antibodies, from 44 healthy tissue types3. Although antibody-based protein measurement has an advantage in that it provides localized protein information, its semi-quantitative nature limits the reliable quantification of thousands of proteins, particularly those for which effective antibodies are lacking. By contrast, mass spectrometry (MS) offers a comprehensive, multiplexed and unbiased alternative for quantitative proteomic measurement12,13.
In 2014, two MS-based human proteome drafts reported the identification of approximately 85% of proteins encoded by human genes across around 30 tissue types and cell lines1,2. A few years later, another study14 characterized 15,210 protein groups across 29 tissues using label-free data-dependent acquisition MS, and, more recently4, researchers quantified 12,027 proteins across 32 tissue types using tandem mass tag-based MS. Although these studies advanced human tissue proteomics, they focused on a limited set of approximately 30 major tissues, leaving many uncharted, and lacked comprehensive comparisons between healthy and cancerous tissue.
Consortia such as The Cancer Genome Atlas (TCGA), the International Cancer Genome Consortium and the Clinical Proteomic Tumor Analysis Consortium (CPTAC) have generated extensive multi-omics datasets for specific tumours15,16; however, challenges in cross-tumour type comparisons limit the insights into differences between cancers that can be obtained from these resources17. Comprehensive proteome profiling across diverse human tissues and states requires broad tissue coverage and in-depth, high-throughput proteomics, and this need is addressed effectively by data-independent acquisition mass spectrometry (DIA-MS)18,19,20. Here, using DIA-MS, we present a rich data resource detailing the spatial distribution of 13,609 proteins. This coverage includes 58 healthy adult tissues, paired tumour and non-tumour samples from 25 cancer types, and 22 fetal tissue types, encompassing nearly all solid human tissues, body fluids and major cancer types (Fig. 1 and Supplementary Information). This resource provides a foundation for navigating the human body proteome21, and will facilitate cancer drug discovery.
Summary of the sample types in our data. Each sample type is marked with a corresponding number. The specific sampling positions of the eye, blood, human embryo, ear, nose and brain are listed on the left. Twenty-five types of cancer are shown at the bottom. All samples are labelled with the full and abbreviated names of the organ, tissue or cancer, and the numbers in parentheses indicate the number of proteins retained in each submatrix that were quantified in more than 50% of the samples in the specific tissue types. In this figure, ‘female genitalia’ is used as a category label for the fallopian tubes, uterus and vagina, and ‘male genitalia’ is used as a category label for the epididymis, seminal vesicle, seminiferous duct and Cowper’s gland. Components of this figure were created in BioRender; Guomics Lab https://BioRender.com/hwyxuac and https://BioRender.com/96s0zl0 (2026); other components were created using Magnific.
Samples and proteomic profiling
We collected 2,856 samples from 9 post-mortem adult donors, 8 healthy participants, 9 post-mortem fetal donors and 1,015 patients with cancer (Supplementary Table 1). We first constructed a comprehensive human spectral library from these samples, containing 15,332 protein groups (Extended Data Fig. 1a and Supplementary Information). To ensure the quality of large-scale proteomic data, we searched the DIA-MS raw data against a combined spectral library that integrated the human spectra with entrapment spectra from non-human species (Methods and Supplementary Information). A total of 13,609 proteins were quantified across 3,005 MS files, with a global false discovery rate (FDR) of 0.1% at protein level (Fig. 1, Extended Data Fig. 1b and Supplementary Information). The proteomes showed substantial heterogeneity across tissues and sample types (Fig. 2a, Extended Data Figs. 1c, 2b and 3b–e and Supplementary Information), high reproducibility among replicates and minimal batch effects, indicating high overall data quality (Extended Data Figs. 1d–f and 2c,d and Supplementary Information).
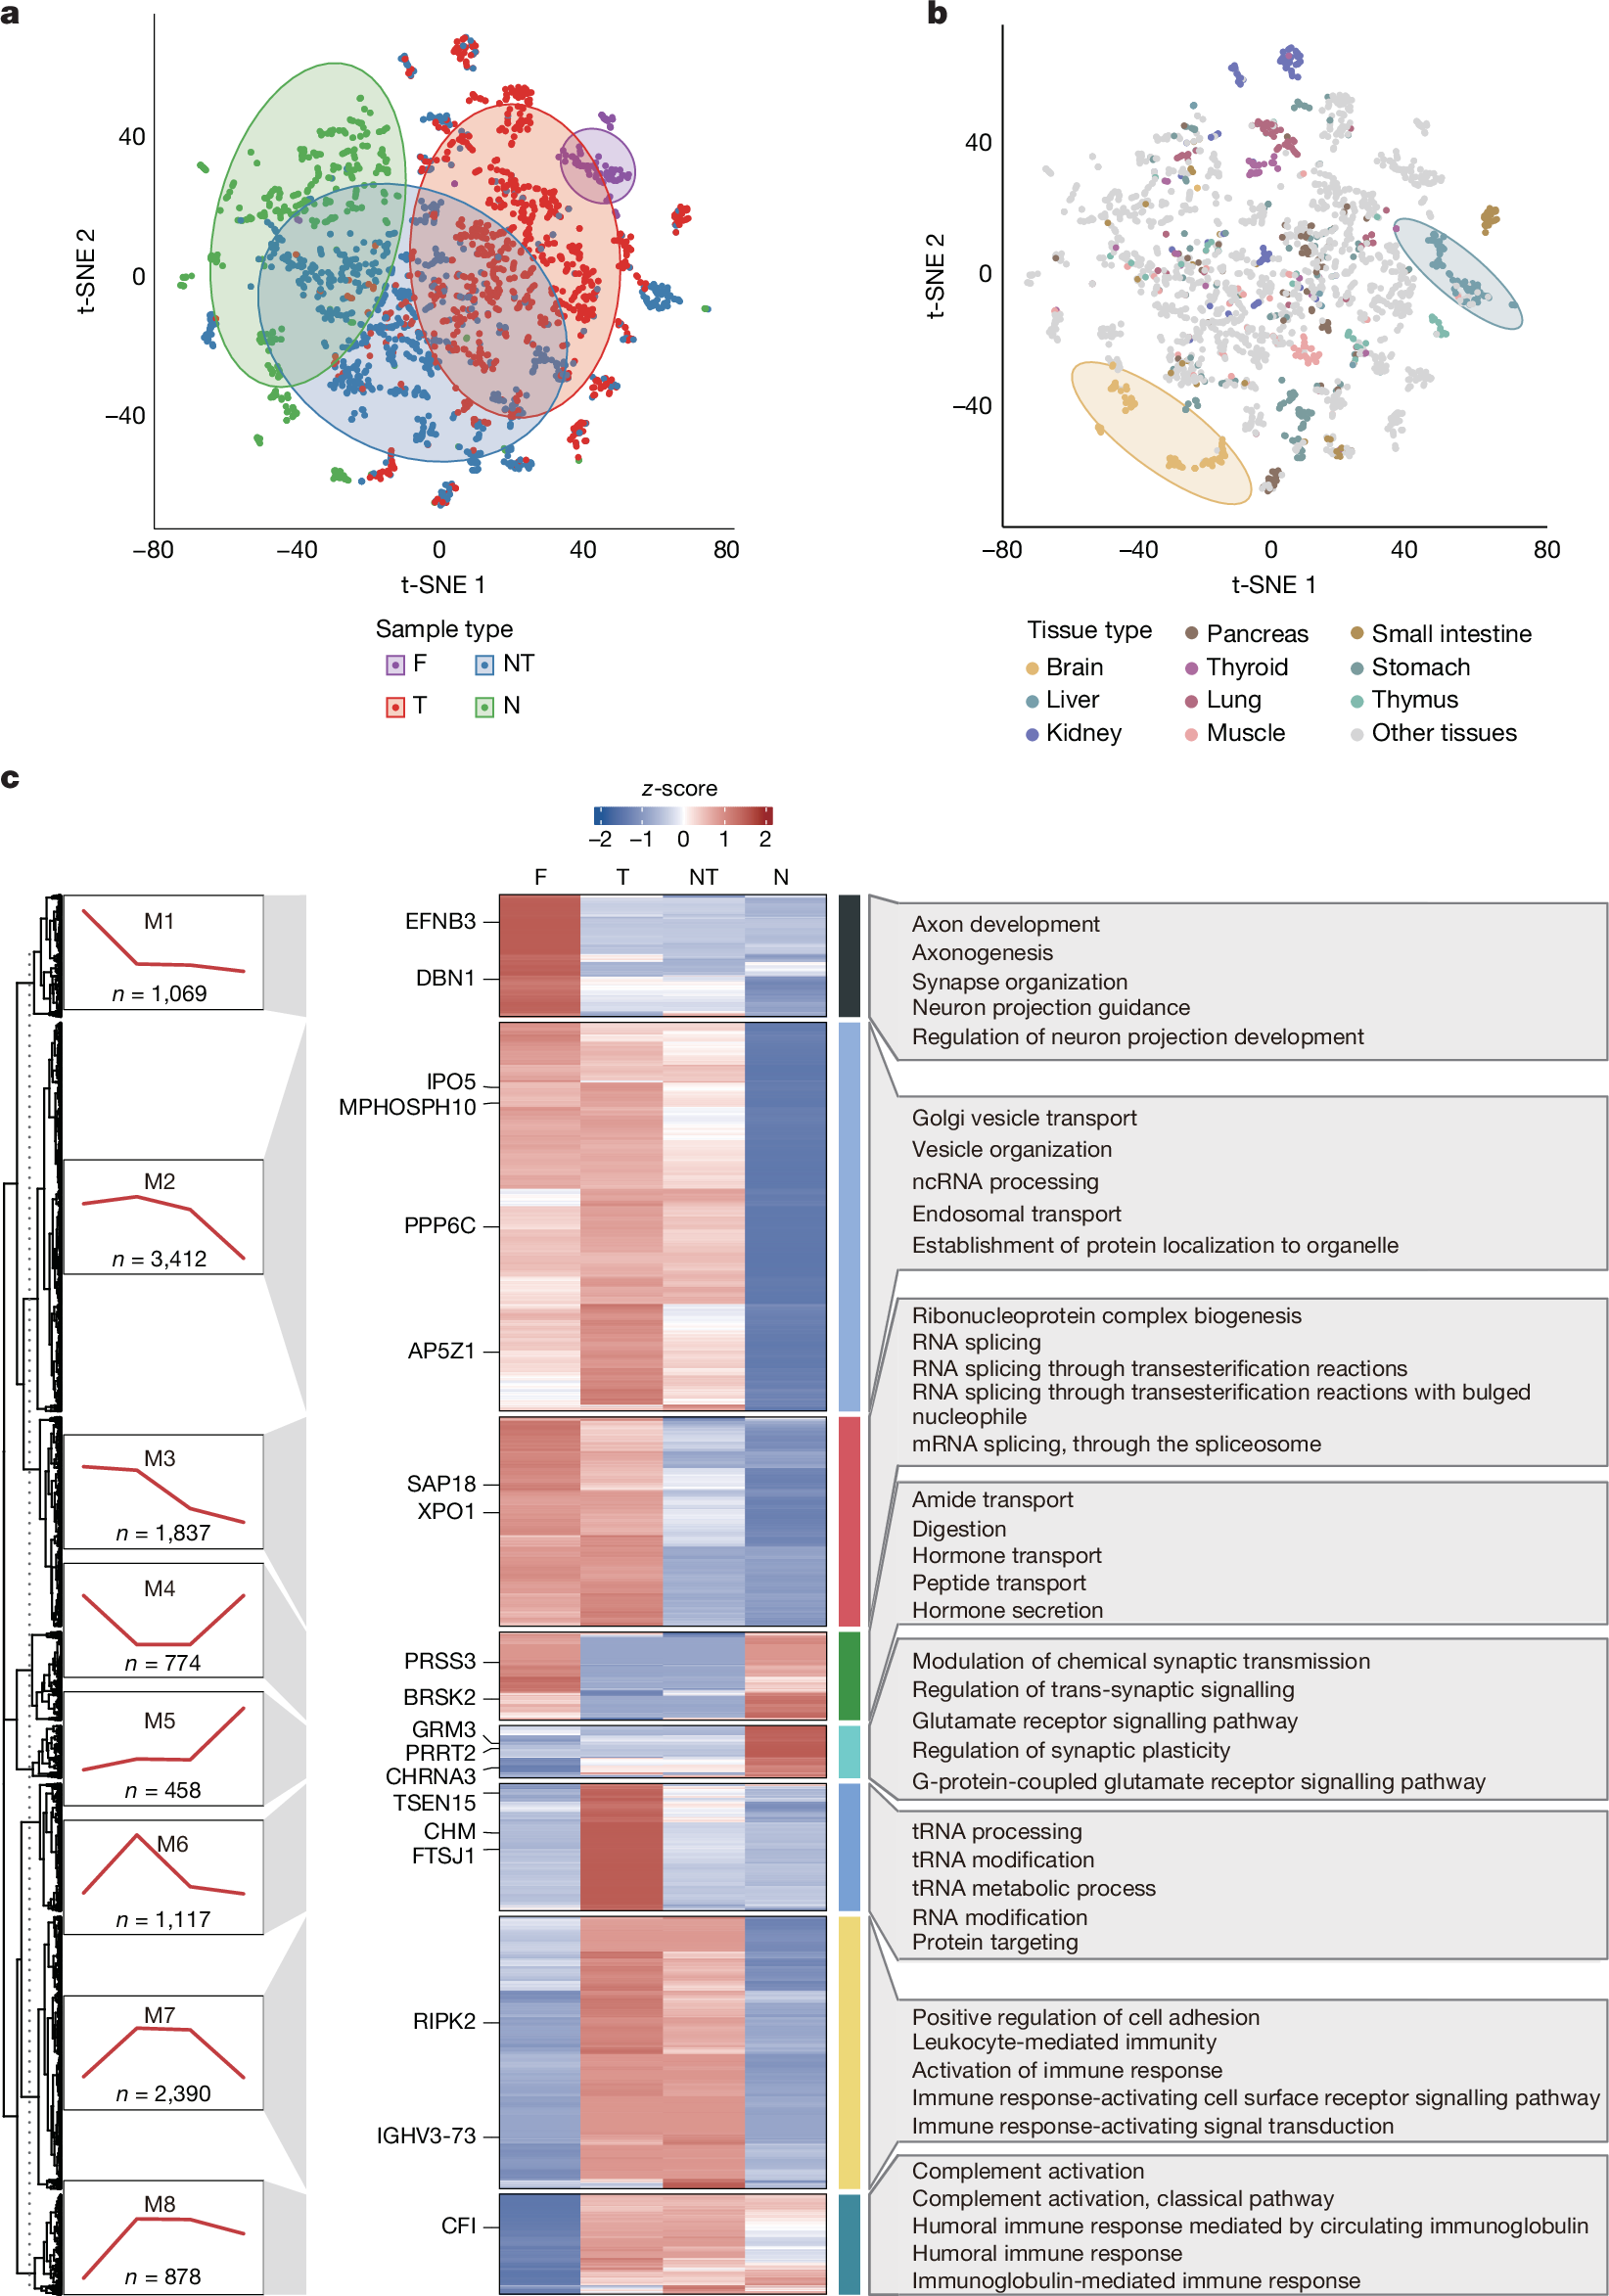
a,b, t-SNE plots of tumour (T), paired non-tumour (NT), normal (healthy) adult (N) and fetal (F) samples with sample type (a) and tissue type (b) classification highlighted. Shaded areas represent 80% (a) and 90% (b) confidence ellipses (multivariate t-distribution) for each group. c, Heat map highlighting trajectory-associated proteins across biological states. The protein matrix was pre-filtered to exclude contaminant proteins, and this was followed by differential expression analysis using a one-way ANOVA across sample types. Significant proteins (B-H adjusted P < 0.05) were clustered into eight co-expression modules (M1–M8) on the basis of their expression in F, T, NT and N, with n indicating the number of proteins in each module. The z-scores reflect relative protein abundance across the columns (F, T, NT and N). On the right, each module is annotated with its top five enriched Gene Ontology: Biological Process (GOBP) terms, ranked by −log10 (B-H adjusted P) for pathway enrichment. ncRNA, noncoding RNA; tRNA, transfer RNA. Representative proteins belonging to the top-ranked GOBP term of each module are labelled on the left.
A t-distributed stochastic neighbour embedding (t-SNE) analysis of all the samples showed an orderly arrangement of fetal (F), tumour (T), paired non-tumour (NT) and normal (healthy) adult (N) samples along the opposite direction of the t-SNE 1 axis (F–T–NT–N; Fig. 2a and Supplementary Table 3), mirroring the degree of tissue differentiation. Notably, brain and liver tumours and their paired non-tumour tissues deviated from this F–T–NT–N pattern, clustering together rather than with their respective sample types (Fig. 2b). Next, we applied trajectory analysis to quantify these observations by assigning a pseudotime value to each sample on the basis of its relative position along the developmental trajectory from fetal samples, thereby highlighting tissue-specific F–T–NT–N transitions. Brain tissues exhibited exceptional proteomic stability during malignant transformation and development, characterized by low pseudotime values and minimal variance across all four states (Extended Data Fig. 3a)—consistent with functionally constrained gene expression during brain development22. Conversely, liver tumour and non-tumour samples clustered at high pseudotime values, distant from fetal liver, which could be due to the adaptive plasticity of the liver in response to variable environmental factors22.
To elucidate the specific proteins and biological processes that underpin this trend, we conducted unsupervised clustering analysis on all of the samples, and identified eight distinct protein modules characterized by coherent expression patterns (Fig. 2c and Supplementary Table 3). Notably, module 3 showed a descending F–T–NT–N trend and was highly enriched for RNA splicing, reflecting its crucial role in both organ development and oncogenesis23. By contrast, module 8 exhibited a progressive upregulation along the F–T–NT–N axis and was significantly enriched for the humoral immune response (Fig. 2c), possibly reflecting suppressed or incomplete humoral immunity in prenatal and tumour samples24,25. Unsupervised clustering analysis of liver and brain samples separately showed that although decreased RNA splicing and increased immune activation were also observed in the F–T–NT–N trend, tissue-specific functions—such as synaptic transmission pathways in brain samples and metabolic activities in liver samples—were also enriched (Supplementary Information).
Tissue-specific protein expression
To assess whether subtypes were appropriately grouped into major tissue categories in the normal samples, we compared Euclidean distances and correlation coefficients within and across tissue categories. Tissues exhibiting high within-group heterogeneity, such as eye and cartilage, were further divided into specific subtypes, resulting in 74 refined tissue types (Supplementary Information). All of the refined tissue types showed significantly smaller distances and higher correlations within their respective categories than across categories (Extended Data Fig. 3b–e and Supplementary Information). Global t-SNE embedding showed pronounced inter-tissue differences, with discrete clusters formed by special tissue types such as body fluids, testis, cochlea and semicircular canal (Extended Data Fig. 3f). Physiologically related tissues, such as peripheral nerves, brain and spinal cord, clustered closely, distinct from other tissue types (Extended Data Fig. 3f).
Next we classified proteins into six groups according to the HPA criteria3: not detected, tissue-enriched, group-enriched, expressed in all tissues, tissue-enhanced and mixed (Fig. 3a, Supplementary Table 4 and Supplementary Information). The brain contained the most tissue-enriched proteins, and the crystalline lens showed the highest summed abundance ratio of tissue-enriched proteins to all identified proteins (Fig. 3a). Hierarchical clustering based on tissue- and group-enriched proteins grouped samples that were physiologically related, such as the brain and spinal cord (Fig. 3a). There were some notable exceptions; for example, the clustering of the mammary gland with connective tissue-rich tissues, such as bone, tendon and cartilage; this might reflect age-related involution, which is consistent with the paucity of mammary alveoli observed in haematoxylin and eosin (H&E) staining (Supplementary Information). Similarly, the trachea co-clustered with the salivary gland, probably owing to the prominent presence of glandular epithelial cells in the sampled region of the trachea.
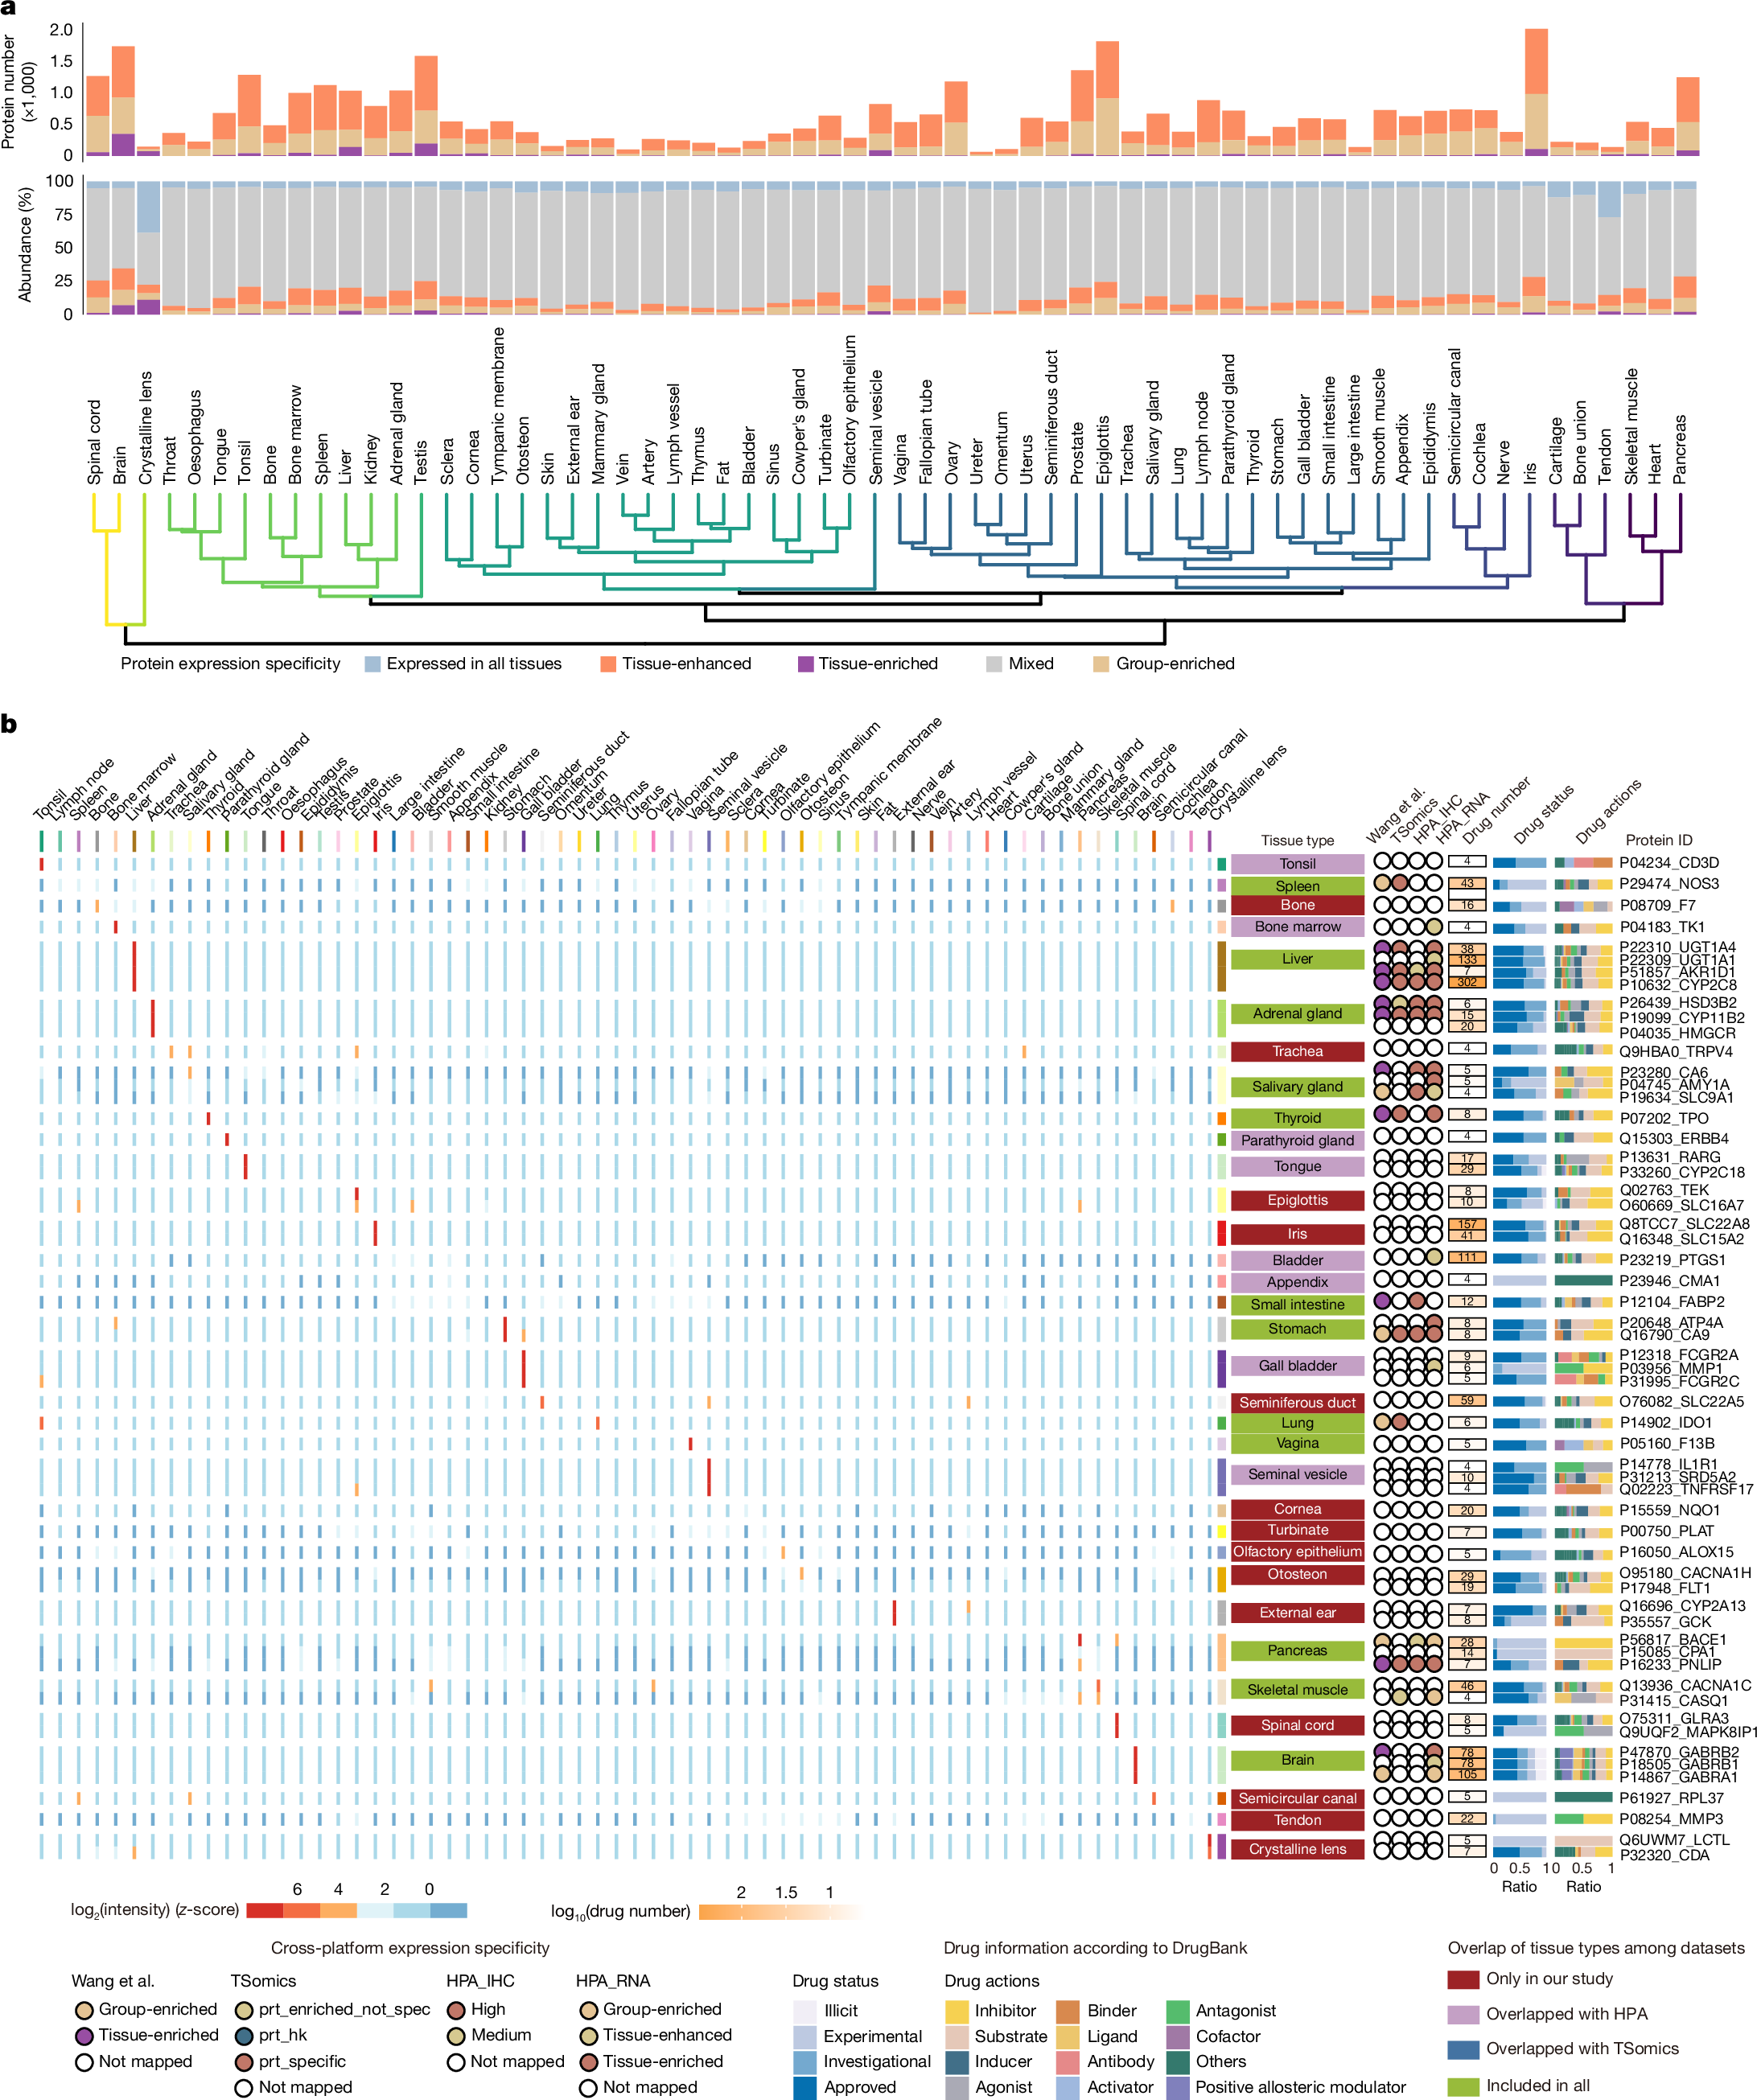
a, Bar plot showing the protein count and summed abundance ratio of each specificity category relative to all quantified proteins in each tissue type. The bottom dendrogram was generated by hierarchical clustering of tissues based on the median abundance of all characterized tissue-enriched proteins in each tissue type. b, Heat map showing tissue-specific drug targets. Only the top five most enriched proteins are shown for each kind of anatomical classification. Tissue specificities of the targets are compared with previous drafts of the human proteome: Wang et al.14, TSomics4, HPA immunohistochemistry data (HPA_IHC)3 and HPA RNA-sequencing data (HPA_RNA)3. For each drug target, the corresponding drug number and information are shown in coloured bars. prt_enriched_not_spec, tissue-enriched (but not tissue-specific) proteins; prt_hk, housekeeping proteins; prt_specific, tissue-specific proteins.
Of the 1,717 tissue-enriched proteins identified, 749 were previously reported as enriched in the corresponding tissue types in published human proteome4,14 or transcriptome datasets3 (Supplementary Table 5). Of these, 666 were supported at the protein level and 426 showed concordant enrichment in HPA RNA-sequencing data. Across 36 tissues overlapping with the HPA, we identified 832 proteins uniquely enriched in our dataset and 122 exclusively enriched in the HPA RNA data. Notably, 480 tissue-enriched proteins were identified in 24 tissue types that were underrepresented in previous studies, underscoring the expanded tissue coverage. Among these, we identified PANX3, which is at present documented as ‘not detected’ in the HPA dataset3, as the top cochlea-enriched protein (Supplementary Table 5). We further synthesized two unique peptides (LVQHMLK and YFEFPLLER) from PANX3 to confirm its presence and its cochlear-specific expression (Extended Data Fig. 4a and Supplementary Table 2). Functional enrichment of tissue-enriched proteins aligned with specialized tissue functions. Proteins associated with metabolism, synaptic function, meiotic cell cycle, cardiac chamber morphogenesis and lens development were uniquely enriched in the liver, brain, testis, heart and crystalline lens, respectively. Hormone metabolic processes were co-enriched in proteins from exocrine organs, including the thyroid and adrenal glands (Extended Data Fig. 4b and Supplementary Table 5).
Tissue distribution of drug targets
Because tissue-specific drug target expression might contribute to off-target toxicity26, we mapped tissue-enriched proteins to DrugBank27 targets, identifying 402 proteins corresponding to 2,598 drugs across 34 tissue types (Supplementary Table 5). We found that the liver contained the most tissue-enriched drug targets (Supplementary Table 5), potentially explaining the high incidence of drug-induced liver injury. The liver’s unique exposure through portal circulation, in which absorbed drugs reach the liver directly before systemic distribution, further increases its susceptibility to drug toxicity. Cytochrome P450 2C8 (CYP2C8), which was highly enriched in the liver both in this study and in published MS-based proteome drafts3,4, is targeted by 302 drugs, including antivirals, antidiabetic agents and anticancer agents (Fig. 3b). Most of these drugs act as inhibitors and substrates—including gemfibrozil (Supplementary Table 5), which functions as an irreversible inhibitor of CYP2C8 (ref. 28). Consequently, co-administration of gemfibrozil with CYP2C8-metabolized drugs can induce severe toxicity by increasing plasma concentrations of the drugs by eight- to tenfold28,29,30. Clinically, this manifests as rhabdomyolysis and acute kidney injury when gemfibrozil is combined with statins29, or severe hypoglycaemia when it is combined with antidiabetic agents