Global subsidence of river deltas
TL;DR
A global study of 40 river deltas reveals widespread land subsidence, often exceeding sea-level rise as the main driver of relative sea-level rise. Groundwater extraction is the leading anthropogenic cause, highlighting the need for targeted local interventions alongside climate change mitigation.
Key Takeaways
- •Subsidence affects over 50% of the area in 38 out of 40 studied deltas, with rates surpassing sea-level rise in many cases.
- •Groundwater storage is the strongest driver of subsidence in 10 deltas, while others are influenced by sediment flux or urban expansion.
- •The findings emphasize the urgency of addressing subsidence as a localized challenge to complement global sea-level rise adaptation efforts.
Tags
Abstract
River deltas sustain dense human populations, major economic centres and vital ecosystems worldwide1,2. Rising sea levels and subsiding land threaten the sustainability of these valuable landscapes with relative sea-level rise and associated flood, land loss and salinization hazards1,2,3. Despite these risks, vulnerability assessments are impeded by the lack of contemporary, high-resolution, delta-wide subsidence observations4. Here we present spatially variable surface-elevation changes across 40 global deltas using interferometric synthetic aperture radar. Using this dataset, we quantify delta surface-elevation loss and show the prevalence and severity of subsidence in river deltas worldwide. Our analysis of three key anthropogenic drivers of delta elevation changes shows that groundwater storage has the strongest relative influence on vertical land motion in 10 of the 40 deltas. The other deltas are either influenced by multiple drivers or dominated by sediment flux or urban expansion. Furthermore, we find that contemporary subsidence surpasses absolute (geocentric) sea-level rise as the dominant driver of relative sea-level rise for most deltas over the twenty-first century. These findings suggest the need for targeted interventions addressing subsidence as an immediate and localized challenge, in parallel with broader efforts to mitigate and adapt to climate change-driven global sea-level rise.
Main
River deltas, which occupy only 1% of land area, are among the most vital landforms on Earth1. Globally, deltas host an estimated 350–500 million people (representing 4–6% of the global population), including 10 of the 34 megacities of the world1,2,3. These dynamic landforms serve important socioeconomic, ecological and energy-related functions5,6. They sustain agricultural productivity and fisheries, their ecosystems sustain important biodiversity and their infrastructure, such as ports and transportation networks, anchors maritime trade vital to national, regional and global economies5,6,7.
This recognized importance, which makes deltas indispensable, also increases their exposure to compounding climatic, environmental and anthropogenic threats2,8,9,10. As low-lying landforms, with extensive areas less than 2 m above sea level11, deltas are acutely susceptible to rising sea level, storm surge, land subsidence, shifting temperature and rainfall patterns, and other environmental pressures, which are amplified by climate change2,3,7,8,9,10,12,13. These pressures degrade agricultural land; disrupt freshwater availability; exacerbate coastal and fluvial flooding; promote wetland loss, saltwater intrusion and shoreline retreat; and threaten infrastructure in deltas2,5,6,14,15. Beyond direct physical impacts, the interplay of these hazards also creates potential cascading socioeconomic consequences. For example, land loss and freshwater scarcity may drive displacement and migration, heightening competition for dwindling resources and fuelling social tensions16,17. Together, these intersecting climatic, environmental, human-driven pressures and multi-hazards render deltas the most fragile landscapes on Earth, with their low elevation and high urban exposure placing them at the forefront of climate and environmental risks3,5,9 (Extended Data Fig. 1).
Among these threats, land subsidence often emerges as an important contributor to risks in global river deltas1,2,3,12,18,19. This predominantly human-driven process is just as, or more, influential than climate-induced sea-level rise (SLR) in the twenty-first century3,20,21, with subsidence control now providing an important component of future coastal adaptation strategies22,23. Despite its perceived importance, land subsidence remains underrepresented in global assessments of delta vulnerability9,24 largely because of the lack of modern, high-resolution subsidence observations4,13. Even with recent advances in space-based geodetic monitoring, high-resolution synoptic measurements of subsidence rates remain scarce, as most observations remain restricted to main urban centres within deltas, neglecting rural and ecologically critical zones4. Understanding delta-wide spatial characteristics of contemporary land elevation changes is important for informing their sustainable management.
Here, we present high-spatial-resolution datasets of surface-elevation change derived from Sentinel-1 synthetic aperture radar (SAR) interferometry across 40 deltas globally (Fig. 1). These datasets capture delta-wide temporal trends, subsidence rates and horizontal motion at 75 m resolution, spanning five continents and 29 countries. Our analysis encompasses all major river deltas with a population exceeding 3 million people4, historically recognized sinking deltas2 and representatives of less-populated, understudied deltas of regional ecological and economic importance (Methods).
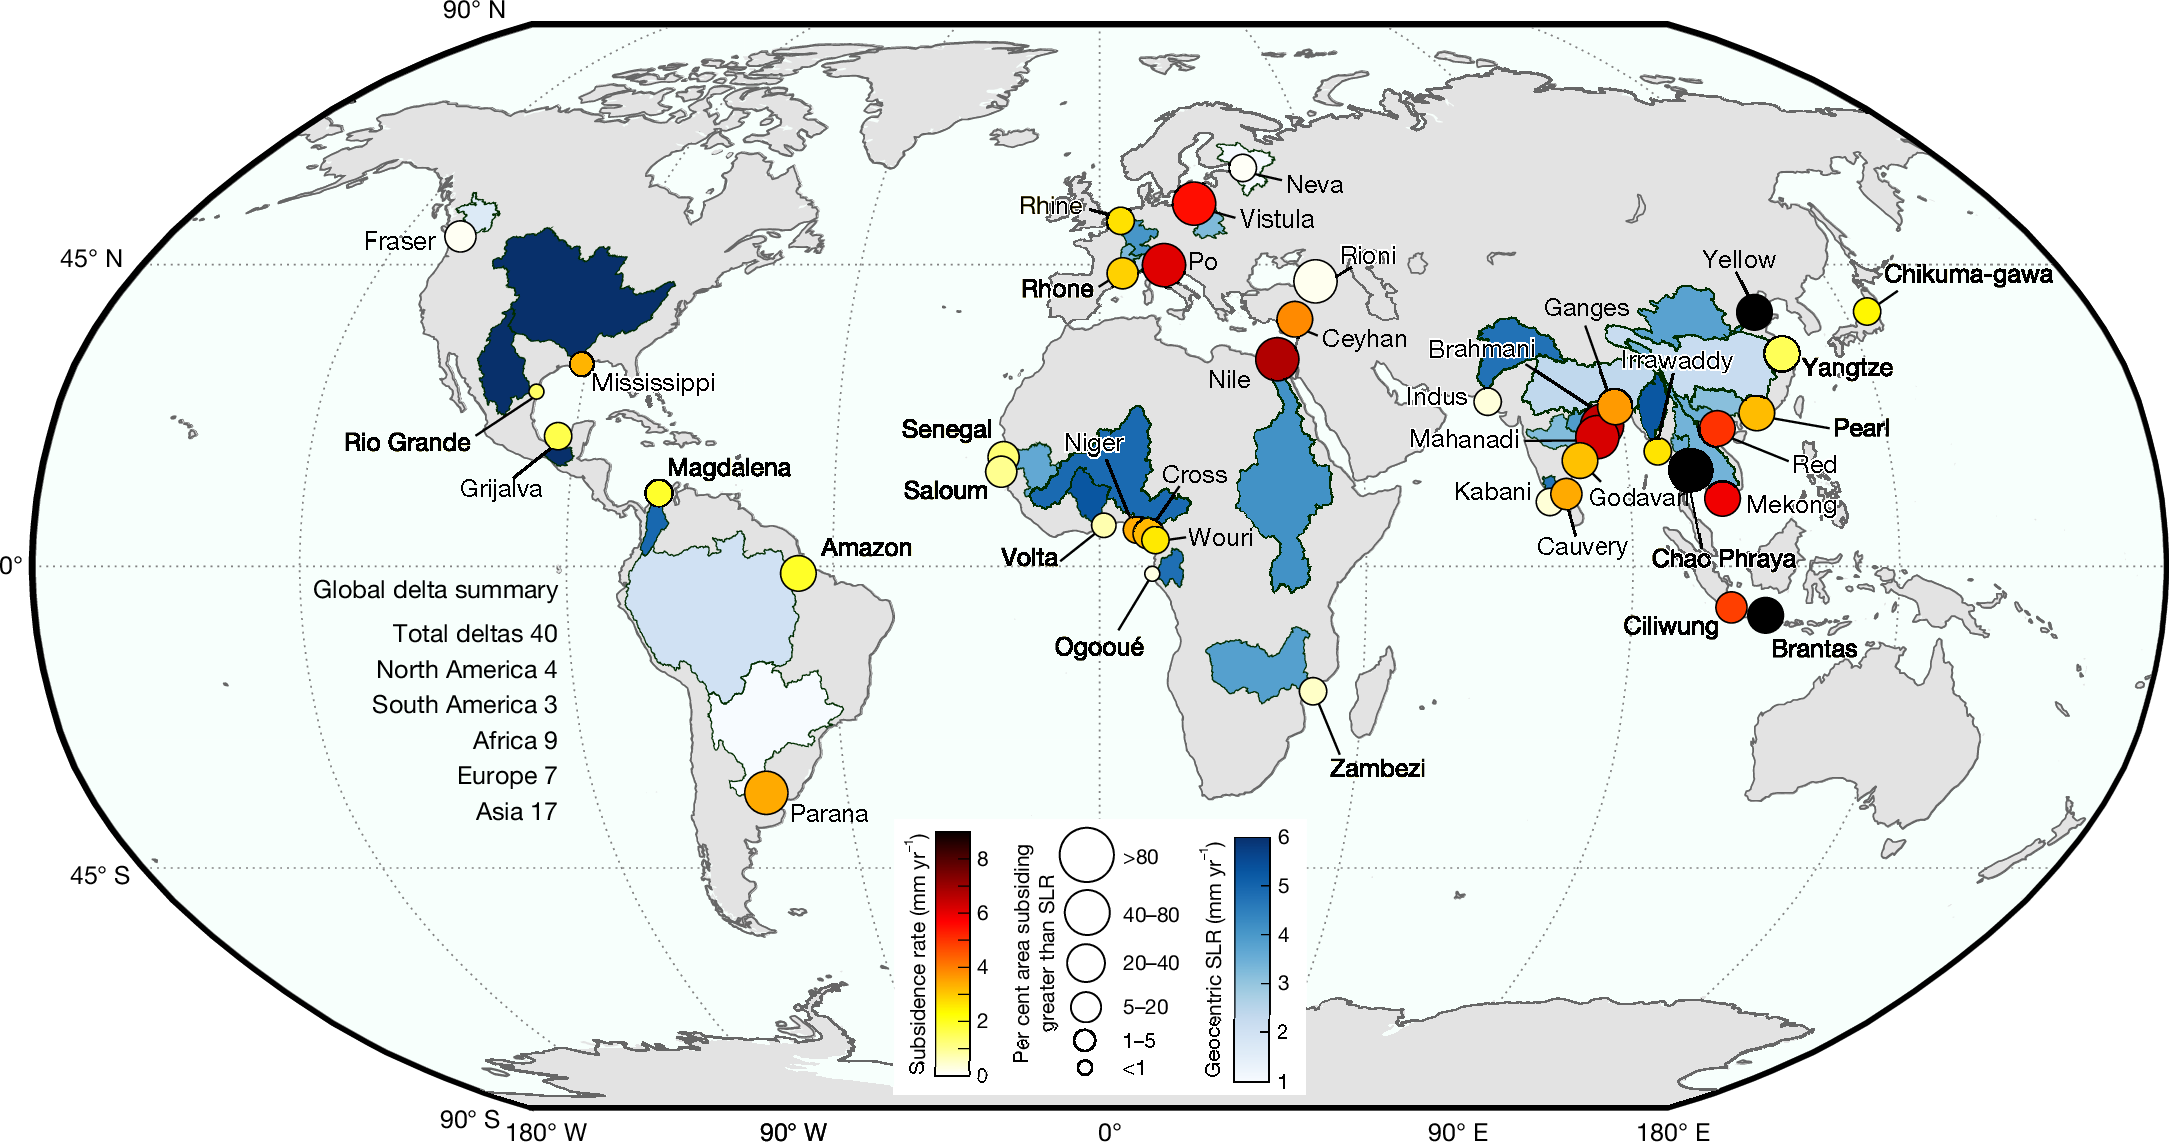
Each circle represents the location of the 40 deltas evaluated in this study, colour-coded by the average land subsidence rate. The size of the circle represents the percentage of the delta area subsiding faster than geocentric SLR. For visualization purposes, the geocentric SLR rate is shown as a colour gradient over entire watersheds or basins, although this does not represent the actual extent of exposure. Global coastlines are based on public-domain data from the CIA World DataBank II (using GSHHG (Global Self-consistent, Hierarchical, High-resolution Geography Database)), distributed with MATLAB. The delta basin polygons were obtained along with the sediment flux dataset from ref. 29.
Global analysis of delta subsidence
We measured the spatial patterns and rates of subsidence in 40 deltas by analysing the complete archive of the Sentinel-1 SAR dataset between 2014 and 2023 using advanced multitemporal interferometric SAR (InSAR) analysis (Methods). InSAR measures surface-elevation changes, capturing vertical land motion (VLM), sediment deposition and erosional processes13,25. For consistency, to reflect both VLM and surface-elevation change in the deltas, we use the terms VLM or elevation gain or loss to describe net surface-elevation change across all delta environments, with positive values indicating uplift or elevation gain and negative values indicating subsidence or net elevation loss. Throughout this study, negative VLM is quoted with negative signs and references land subsidence rates, whereas only the absolute values are reported when presenting subsidence rates.
Our analysis shows that subsidence threatens deltas globally, with the delta-scale average rate of VLM on all deltas indicating subsidence (Fig. 1). In 12 out of 40 deltas, the average sinking rate is moderate, at less than 2 mm yr−1. By contrast, more than half of the deltas exhibit subsidence rates exceeding 3 mm yr−1, and in 13 of these deltas (Nile, Po, Vistula, Ceyhan, Brahmani, Mahanadi, Chao Phraya, Mekong, Red, Ciliwung, Brantas, Godavari and Yellow River), the average subsidence rates exceed the current estimates of global SLR (that is, about 4 mm yr−1). Among these, the Chao Phraya (Thailand), Brantas (Indonesia) and Yellow River (China) deltas show an average sinking rate of more than twice the current global SLR rate. To further highlight the severity of subsidence in deltas, we compared the subsidence with the regional geocentric SLR rates for the twenty-first century (2001–present). In 18 of the 40 deltas (the Nile, Po, Vistula, Ceyhan, Rioni, Brahmani, Mahanadi, Ganges–Brahmaputra, Godavari, Chao Phraya, Mekong, Red River, Ciliwung, Brantas, Amazon, Parana, Pearl and Yellow River), the average rate of local land subsidence is greater than the rate of regional geocentric SLR (Fig. 1 and Supplementary Table 1). However, in almost every delta (except Rio Grande) at least 1% of the delta area is subsiding faster than both global and geocentric sea levels (Fig. 1 and Supplementary Table 1).
Among all deltas, we find that at least 35% of the area is sinking, and in 38 deltas (excluding Neva and Fraser), more than 50% of the delta area is sinking (Fig. 2a). Of the 40 deltas, 19 show widespread subsidence patterns, with greater than 90% of the delta area affected by subsidence (for example, Mississippi, Niger, Nile, Rhine–Meuse, Po, Vistula, Brahmani, Mahanadi, Ganges–Brahmaputra, Chao Phraya, Mekong and Brantas deltas). Deltas with notable subsiding areas with greater than 50% of the delta area sinking faster than 5 mm yr−1 include the Chao Phraya (94% of delta area), Nile (80%), Brahmani (77%), Po (74%), Mahanadi (69%), Brantas (66%), Vistula (57%), Yellow River (53%) and Mekong (51%) deltas (Fig. 2a and Supplementary Table 1). In sum, we estimate that a total delta area of 460,370 km2 is exposed to subsidence. If we consider a global habitable geomorphic area of 710,000–855,000 km2 for deltas6,26, approximately 54–65% of global delta areas are sinking just from the analysis of the 40 deltas. By region, South Asia, East Asia and Southeast Asia, with 17 representative deltas, have the greatest exposure to subsidence, with 274,000 km2 of delta area subsiding. Africa, South America, North America and Europe have total subsiding delta areas of 78,800 km2, 39,800 km2, 37,800 km2, and 30,000 km2, respectively. Seven large deltas—Ganges–Brahmaputra, Nile, Mekong, Yangtze, Amazon, Irrawaddy and Mississippi deltas—contribute about 57% of the total subsiding delta area, with a combined area of 265,000 km2. Coastal cities such as Alexandria (Nile), Bangkok (Chao Phraya), Dhaka and Kolkata (Ganges–Brahmaputra), Shanghai (Yangtze), Yangon (Irrawaddy), Cần Thá (Mekong), Thái Bình (Red River), Niigata (Chikuma-gawa), Jakarta (Ciliwung), Surabaya (Brantas) and Dongying (Yellow River) are experiencing subsidence at rates equal to or exceeding the delta-wide averages, indicative of the intensity of subsidence and elevation loss processes in cities on deltas.
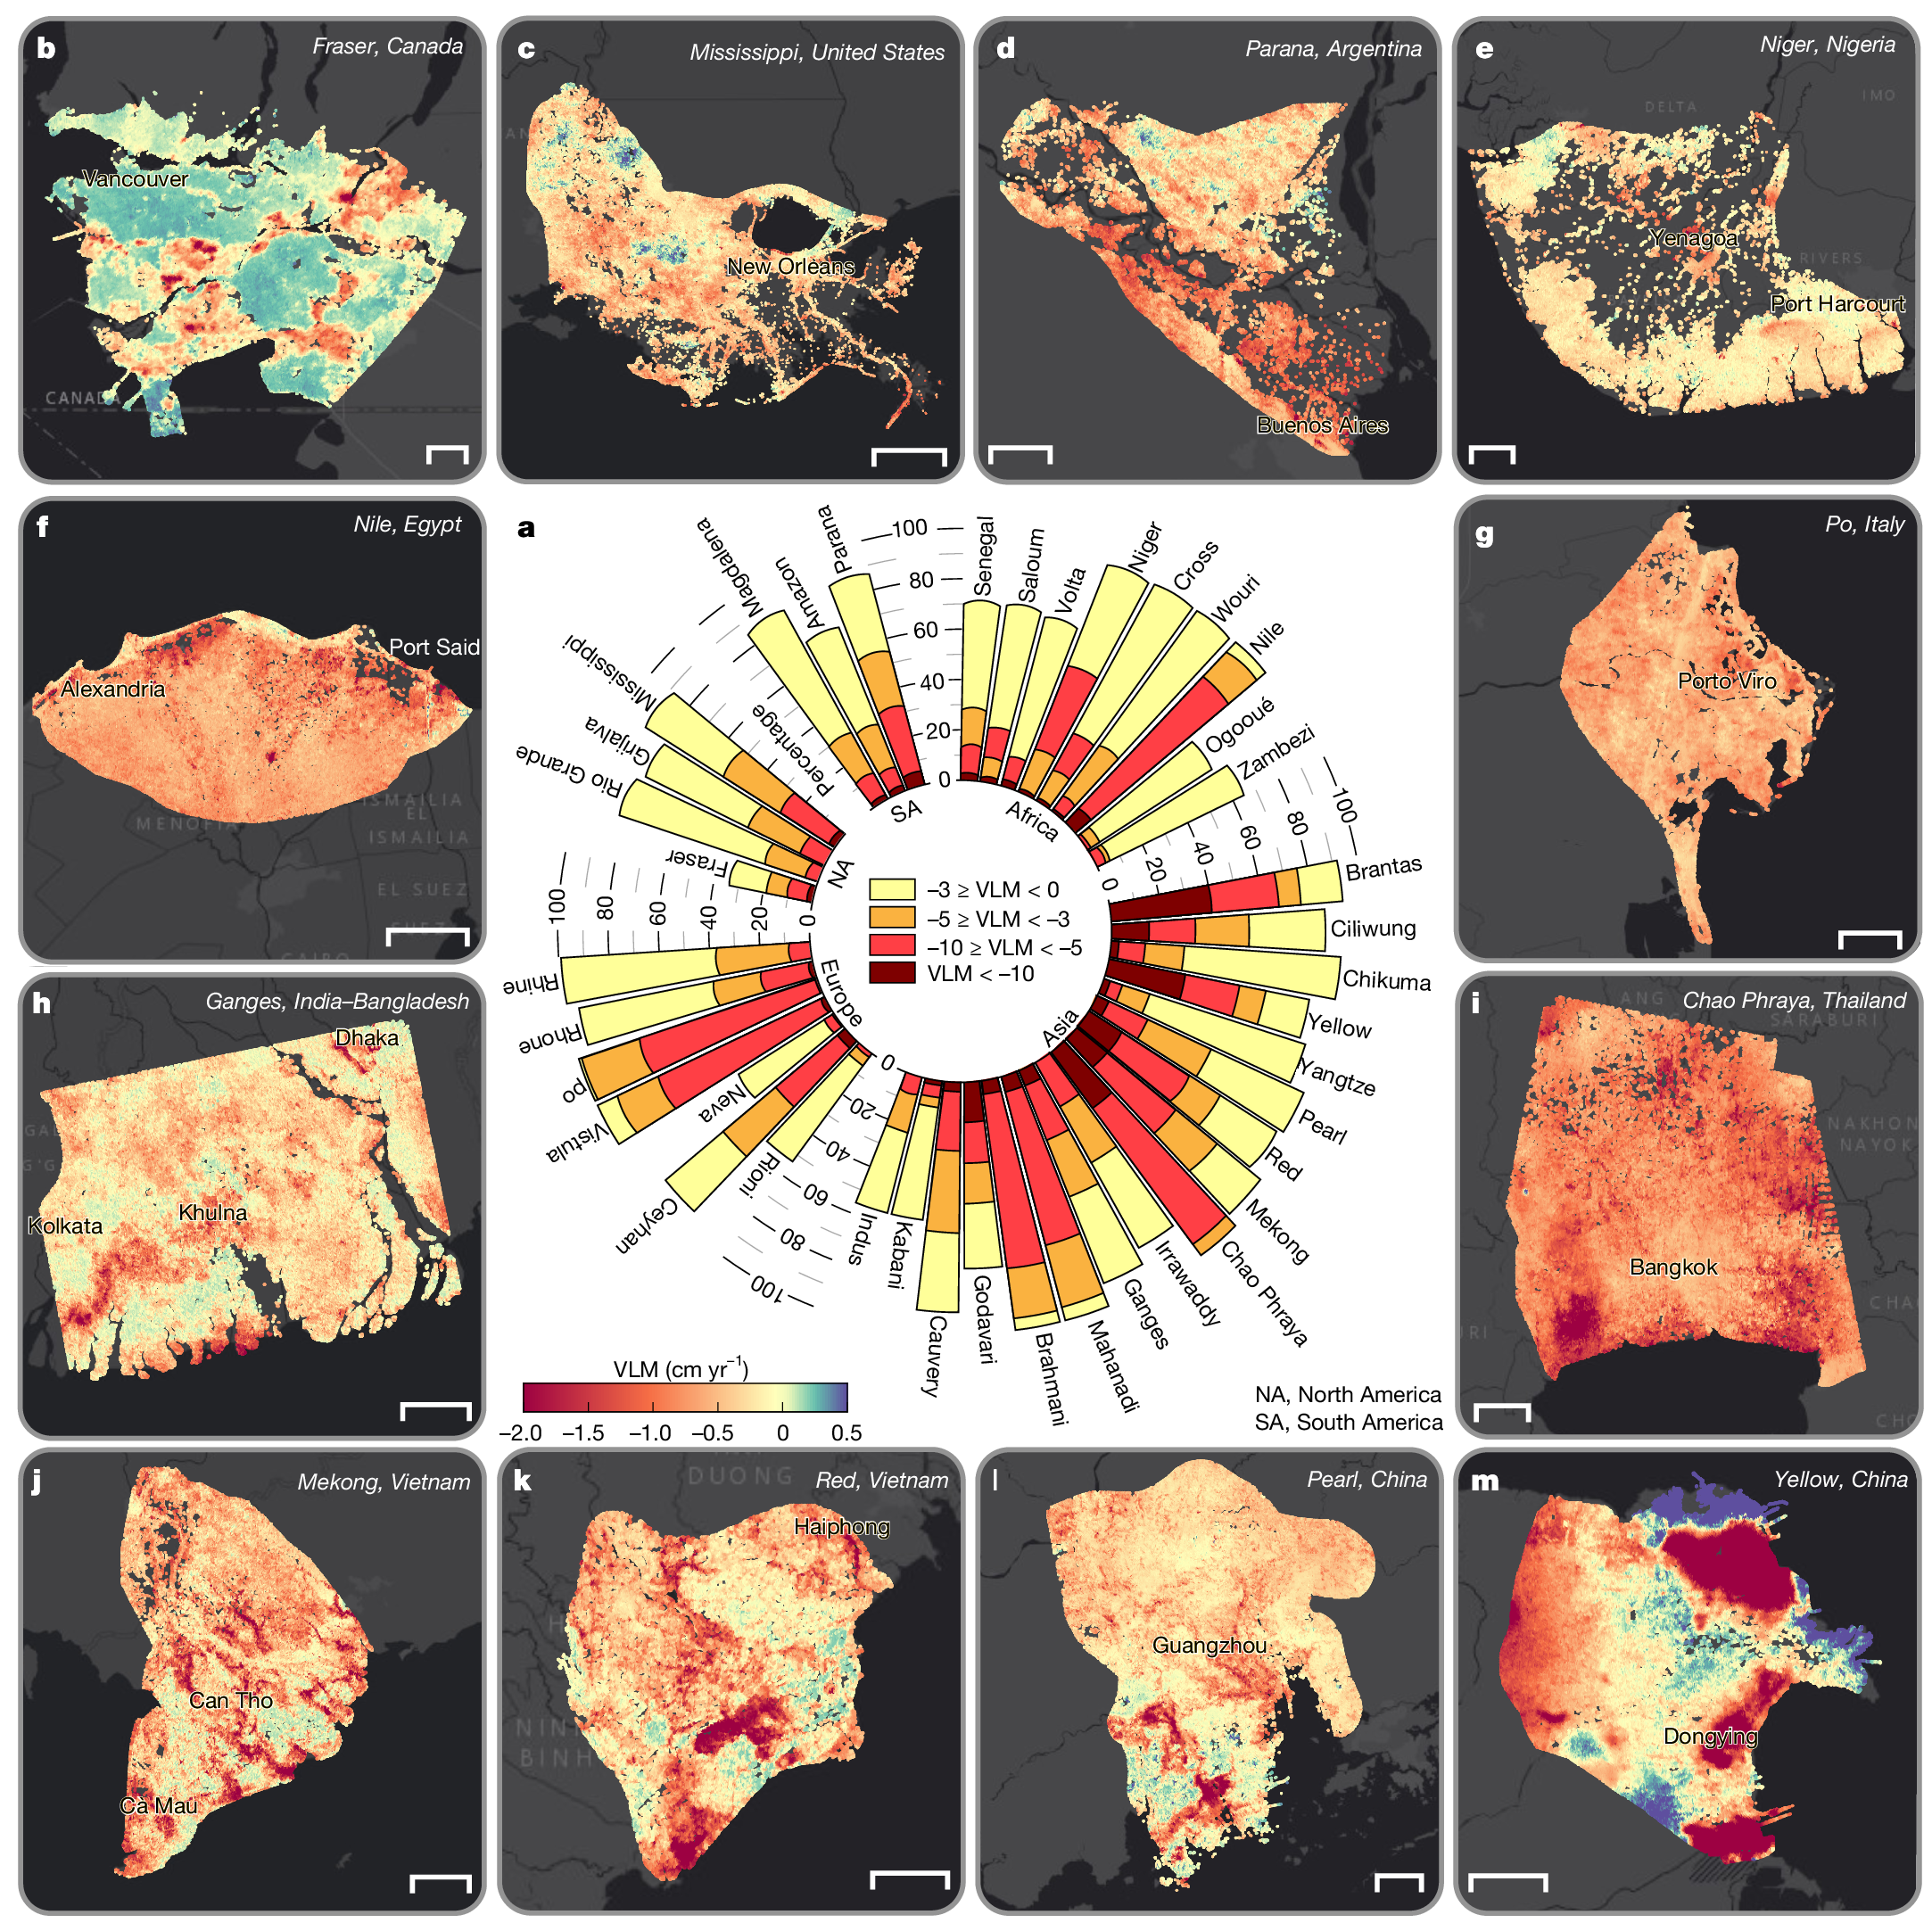
a, Proportion of each delta exposed to different rates of subsidence. Note that only subsiding areas are represented in each bar, and areas of uplift within each delta are omitted to emphasize the extent of elevation loss. b–m, Spatial maps of VLM rates for the Fraser (Canada) (b), Mississippi (the USA) (c), Parana (Argentina) (d), Niger (Nigeria) (e), Nile (Egypt) (f), Po (Italy) (g), Ganges–Brahmaputra (India–Bangladesh) (h), Chao Phraya (Thailand) (i), Mekong (Vietnam) (j), Red River (Vietnam) (k), Pearl (China) (l), Yellow River (China) (m) deltas. Positive VLM (green–purple hues) suggests uplift or elevation gain, whereas negative VLM (yellow–orange–red hues) indicates land subsidence. The spatial VLM maps for the other 28 deltas are shown in Extended Data Figs. 2–4. Background image in b–m is Esri, streets-dark. Scale bars, 5 km (b); 50 km (c,f,h,j); 20 km (d,e,i,k,l,m); 10 km (g).
Furthermore, we observe non-uniform spatially variable VLM within individual deltas, reflecting the complex interplay of natural and anthropogenic processes2,5,13,27 (Fig. 2 and Extended Data Figs. 2–4). Although all deltas exhibit an overall trend of subsidence, localized and broad zones of uplift, which vary from 0 mm yr−1 to greater than 5 mm yr−1 are observed in some areas (Fig. 2b,d,k,m, and Extended Data Figs. 2e,f,i,j,l and 3c,f). In some deltas (for example, Wouri, Zambezi, Indus, Ciliwung and Yellow River), the observed uplift or elevation-gaining parts correlate with patterns of horizontal land motion (Extended Data Figs. 5–7). Possible mechanisms may include sediment redistribution processes potentially driven by river dynamics or growth faulting, either of which can cause localized zones of elevation gain even within a predominantly subsiding deltaic system28,29. This highlights the necessity of comprehensive assessments and models of delta vulnerability to consider not only overall absolute subsidence rates but also the spatial heterogeneity of elevation change dynamics.
Anthropogenic drivers of delta subsidence
All deltas, by their inherent nature, subside over time as recently deposited sediments or in situ organic material compact under their weight30,31,32, a process further influenced by isostatic adjustments and tectonic activity13,27. However, human interventions have accelerated subsidence rates in many of the major deltas of the world, transforming a gradual geological process into an urgent environmental crisis4,20,32. The primary anthropogenic drivers that dominate delta subsidence include excessive groundwater extraction, oil and gas exploitation, and land-use changes associated with urbanization and agriculture4,