Little red dots as young supermassive black holes in dense ionized cocoons
TL;DR
JWST data reveals 'little red dots' are young supermassive black holes in dense ionized cocoons, with electron scattering broadening lines and lower masses than thought, explaining weak X-ray/radio emission.
Key Takeaways
- •Electron scattering in dense ionized gas broadens Hα lines in 'little red dots,' indicating supermassive black hole accretion, not star formation.
- •Intrinsic line cores imply black hole masses 100 times lower than previous estimates, aligning with galaxy scaling relations and easing growth problems.
- •Dense Compton-thick cocoons suppress X-ray and radio emission via absorption and high-density effects, matching observed weak emissions.
Tags
Abstract
The James Webb Space Telescope (JWST) has uncovered many compact galaxies at high redshift with broad hydrogen and helium lines, including the enigmatic population of little red dots (LRDs)1,2. The nature of these galaxies is debated and is attributed to supermassive black holes (SMBHs)3,4 or intense star formation5. They exhibit unusual properties for SMBHs, such as black holes that are overmassive for their host galaxies4 and extremely weak X-ray6,7,8,9,10 and radio6,11,12,13 emission. Here we show that in most objects studied with the highest-quality JWST spectra, the lines are broadened by electron scattering with a narrow intrinsic core. The data require very high electron column densities and compact sizes (light days), which, when coupled with their high luminosities, can be explained only by SMBH accretion. The narrow intrinsic line cores imply black hole masses of 105−7M⊙, two orders of magnitude lower than previous estimates. These are the lowest mass black holes known at high redshift, to our knowledge, and suggest a population of young SMBHs. They are enshrouded in a dense cocoon of ionized gas producing broad lines from which they are accreting close to the Eddington limit, with very mild neutral outflows. Reprocessed nebular emission from this cocoon dominates the optical spectrum, explaining most LRD spectral characteristics, including the weak radio and X-ray emission14,15.
Main
Two early clues suggested that the compact galaxies may be affected by Compton-thick ionized gas: Balmer absorption features are often observed in the broad lines2,16,17, and if they are active galactic nuclei (AGN), their X-rays might be suppressed by photoelectric absorption in this gas in the broad-line region (BLR) near the SMBH10. These ideas inspired us to investigate the Hα line profiles to look for electron-scattering signatures produced by the large ionized gas column densities.
To test different broad line shapes, we constructed a sample of all broad-line galaxies (Hα ≳ 1,000 km s−1) with high signal-to-noise ratio (SNR) JWST/NIRSpec medium-resolution (R = 1,000) spectra in the DAWN JWST Archive (DJA)18,19. Details of the sample and selection criteria are presented in the Methods and Extended Data Table 1. Our search yielded 12 objects at z = 3.4–6.7 and 18 additional objects for a combined ‘stacked’ spectrum at z = 2.32–6.76. High-resolution (R = 2,700) data were used where available (objects A and C), which gave consistent results.
Our object selection is strongly linked to LRDs, many of which show broad lines. LRDs are spatially compact with characteristic v-shaped optical-UV spectra1, because of a change of slope close to the Balmer limit wavelength, about 365 nm (refs. 20,21). Despite our selection being based only on Hα linewidth and SNR criteria, our systems are all spatially very compact (Fig. 1) and often have a clear slope change at the Balmer limit in the rest frame spectra (Extended Data Figs. 1 and 2). In agreement with previous findings22,23, most higher-ionization lines often associated with classical AGN, such as He ii, C iv, N v and [Ne v], are absent in all 5 out of the 12 high-SNR sources that have rest-UV coverage, whereas the highest-ionization lines we detect with SNR > 5 are [Ne iii] λ3,867, 3,967, in three out of seven sources with the spectral coverage, with equivalent widths of 25–50 Å.
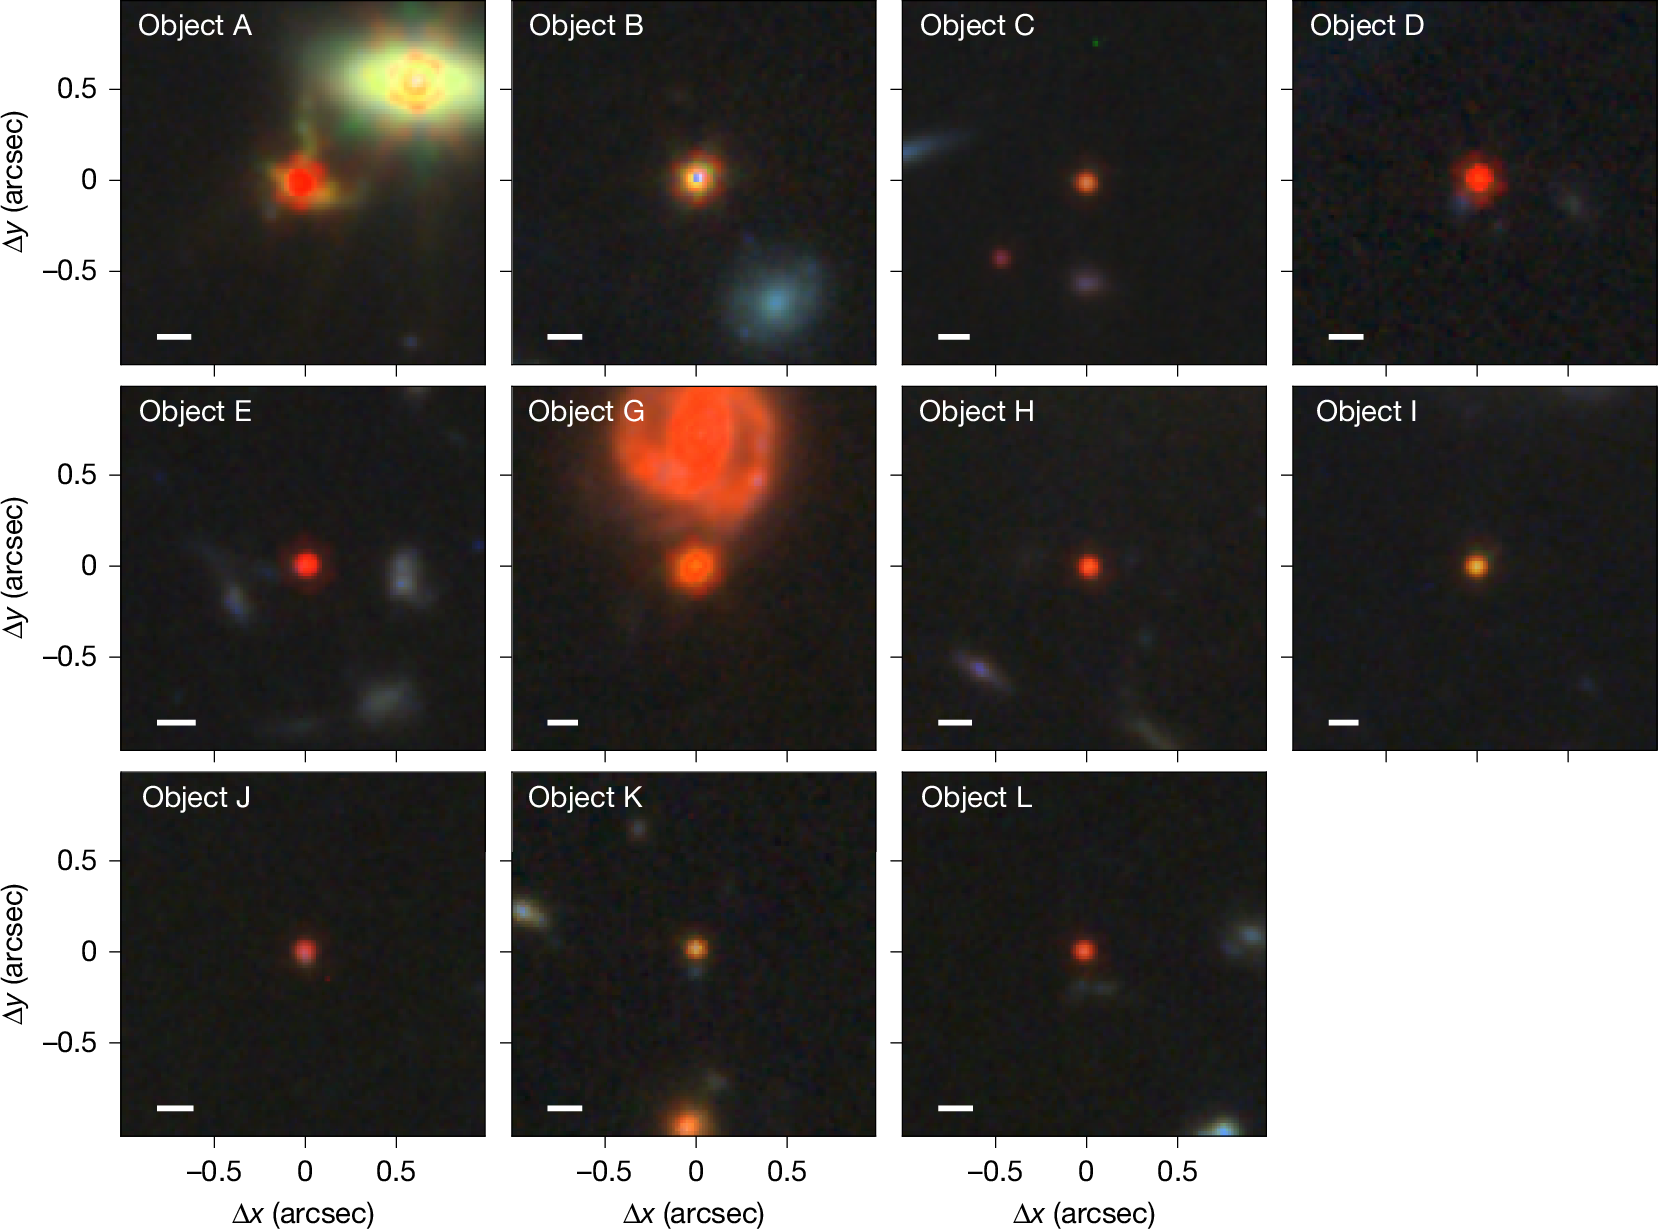
Despite being selected based on the presence of broad Hα components, all objects appear to be point-like or very compact, occasionally with some nebulosity. Rest frame optical colours are mostly red. These properties are similar to LRDs (Extended Data Figs. 1 and 2). Object A has an unusual extended cross-like structure. We note that this object also shows rotation in the 2D high-resolution spectra of the narrow nebular lines. Object F was not observed by NIRCam. The RGB colouring is scaled using a wavelength-dependent power-law (with exponent of 2) based on the fluxes in the F150W (or F200W), F277W and F444W bands. The physical scale (1 kpc) is indicated as a white bar in the lower left corners of the images. Each snapshot is 2 arcseconds wide.
Electron scattering in a dense ionized gas produces lines with exponential profiles24,25,26, whereas Gaussian or centrally broad profiles are expected from Doppler broadening27. We, therefore, compare two basic models for the broad Hα component: a Gaussian and a double-sided exponential. Apart from the broad component and a local continuum in the Hα region, we model the narrow emission lines of Hα and [N ii]λλ6,549, 6,585. Our model also includes narrow absorption features (object E) or P Cygni absorption and emission features (objects A and D) that appear in one third of the objects here (Fig. 3). Following our model comparison, the exponential model is superior in almost every case (Extended Data Fig. 3 and Extended Data Table 2), whereas the best Gaussian fits leave systematic residuals with a characteristic W shape around the central region (Fig. 2). The significance of the fit improvement increases with the SNR of the spectra (Extended Data Fig. 4), indicating that the exponential model is generally better, even where the SNR is not high enough to discriminate. The lines are symmetric and trace a straight line on a semi-logarithmic plot over several orders of magnitude, consistent with moderate optical depth electron-scattering25. These results indicate that the primary line-broadening mechanism is electron scattering through a Compton-thick medium and not primarily bulk Doppler motions, significantly reducing the inferred SMBH masses. The symmetry of the lines suggests that any net outflow of the scattering medium is less than a few hundred km s−1 (ref. 26). We also consider Lorentzian profiles (due, for example, to Raman scattering or turbulence27) and multiple Gaussians (due to complex kinematics or orientation effects28) and find the exponential model to be statistically better in most cases (Methods and Extended Data Table 2).
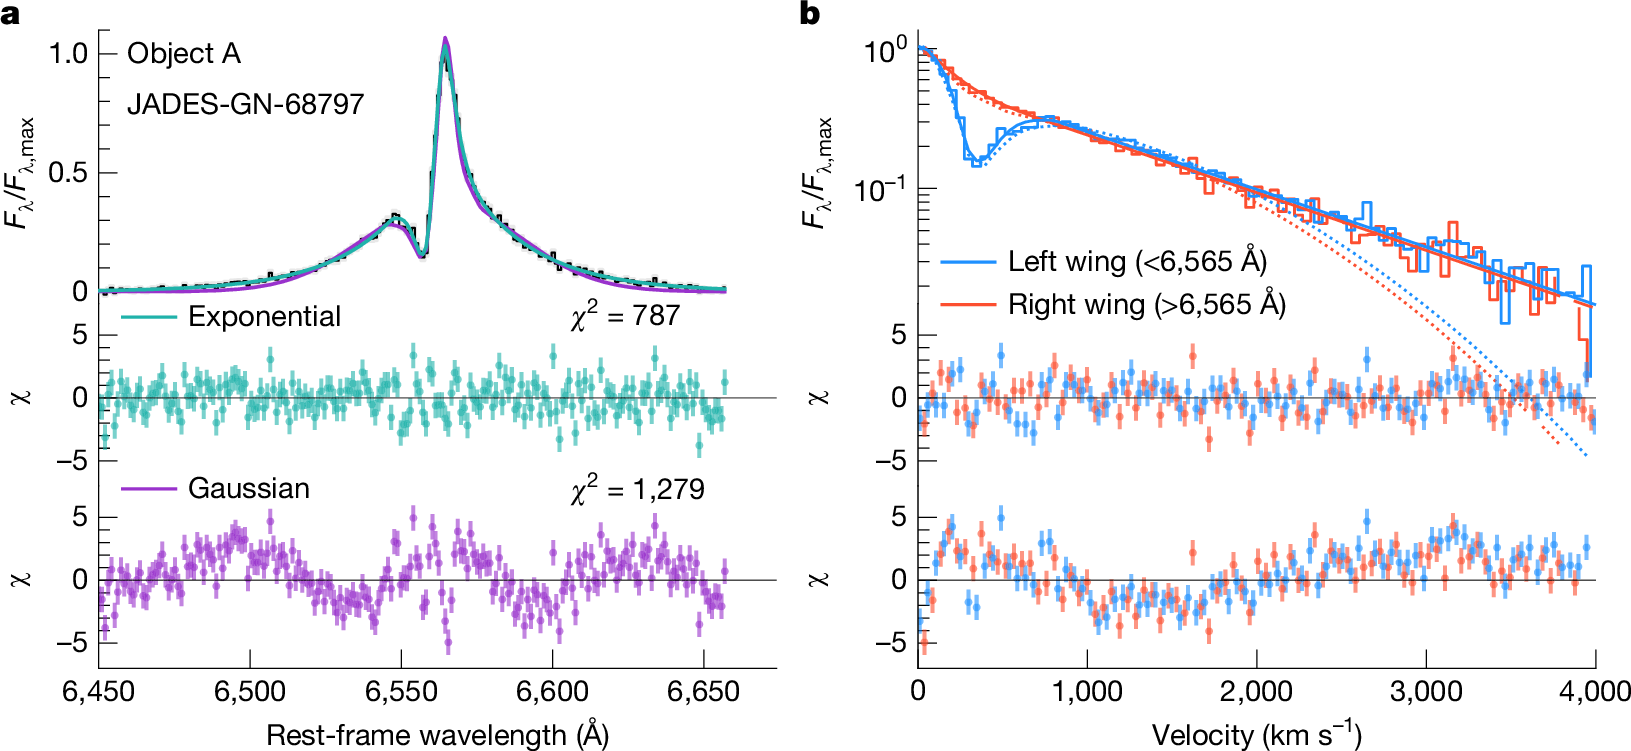
The models in the figure compare the fiducial best-fit model that includes a scattered exponential component with an identical model that instead includes a double-Gaussian component. Object A has the highest SNR(Hα) in our sample and was observed with the high-resolution grating on JWST/NIRSpec. The absorption feature is modelled with a P Cygni component. Left, Gaussian and exponential-component models compared in linear flux density space. The residuals of Gaussian and exponential models are shown in terms of the number of standard deviations. Right, Hα line profile plotted in semi-logarithmic space, reflected about the line centre, showing the linearity of the line profile in this space. The wings of the lines are also symmetric. The exponential line shape is significantly preferred by the data both around the line core and the tails, whereas the Gaussian model falls below the line core and the tails.
After establishing that the basic broad line shape is dominated by electron-scattering effects, we allow for an intrinsic Doppler line core. For our fiducial model, we, therefore, use a Gaussian convolved with an exponential, with the widths free to vary, to measure the intrinsic width of the Doppler lines. Fits for all objects are shown in Fig. 3. In most cases, the intrinsic Gaussian line width is small, with average velocities of approximately 300 km s−1 for 9 of the 12 objects in the sample. In objects B and D, the core width is 1,500–2,000 km s−1, although their total line widths are still dominated by broadening from electron scattering. Finally, only object G has a dominant Gaussian width of 2,000 km s−1.
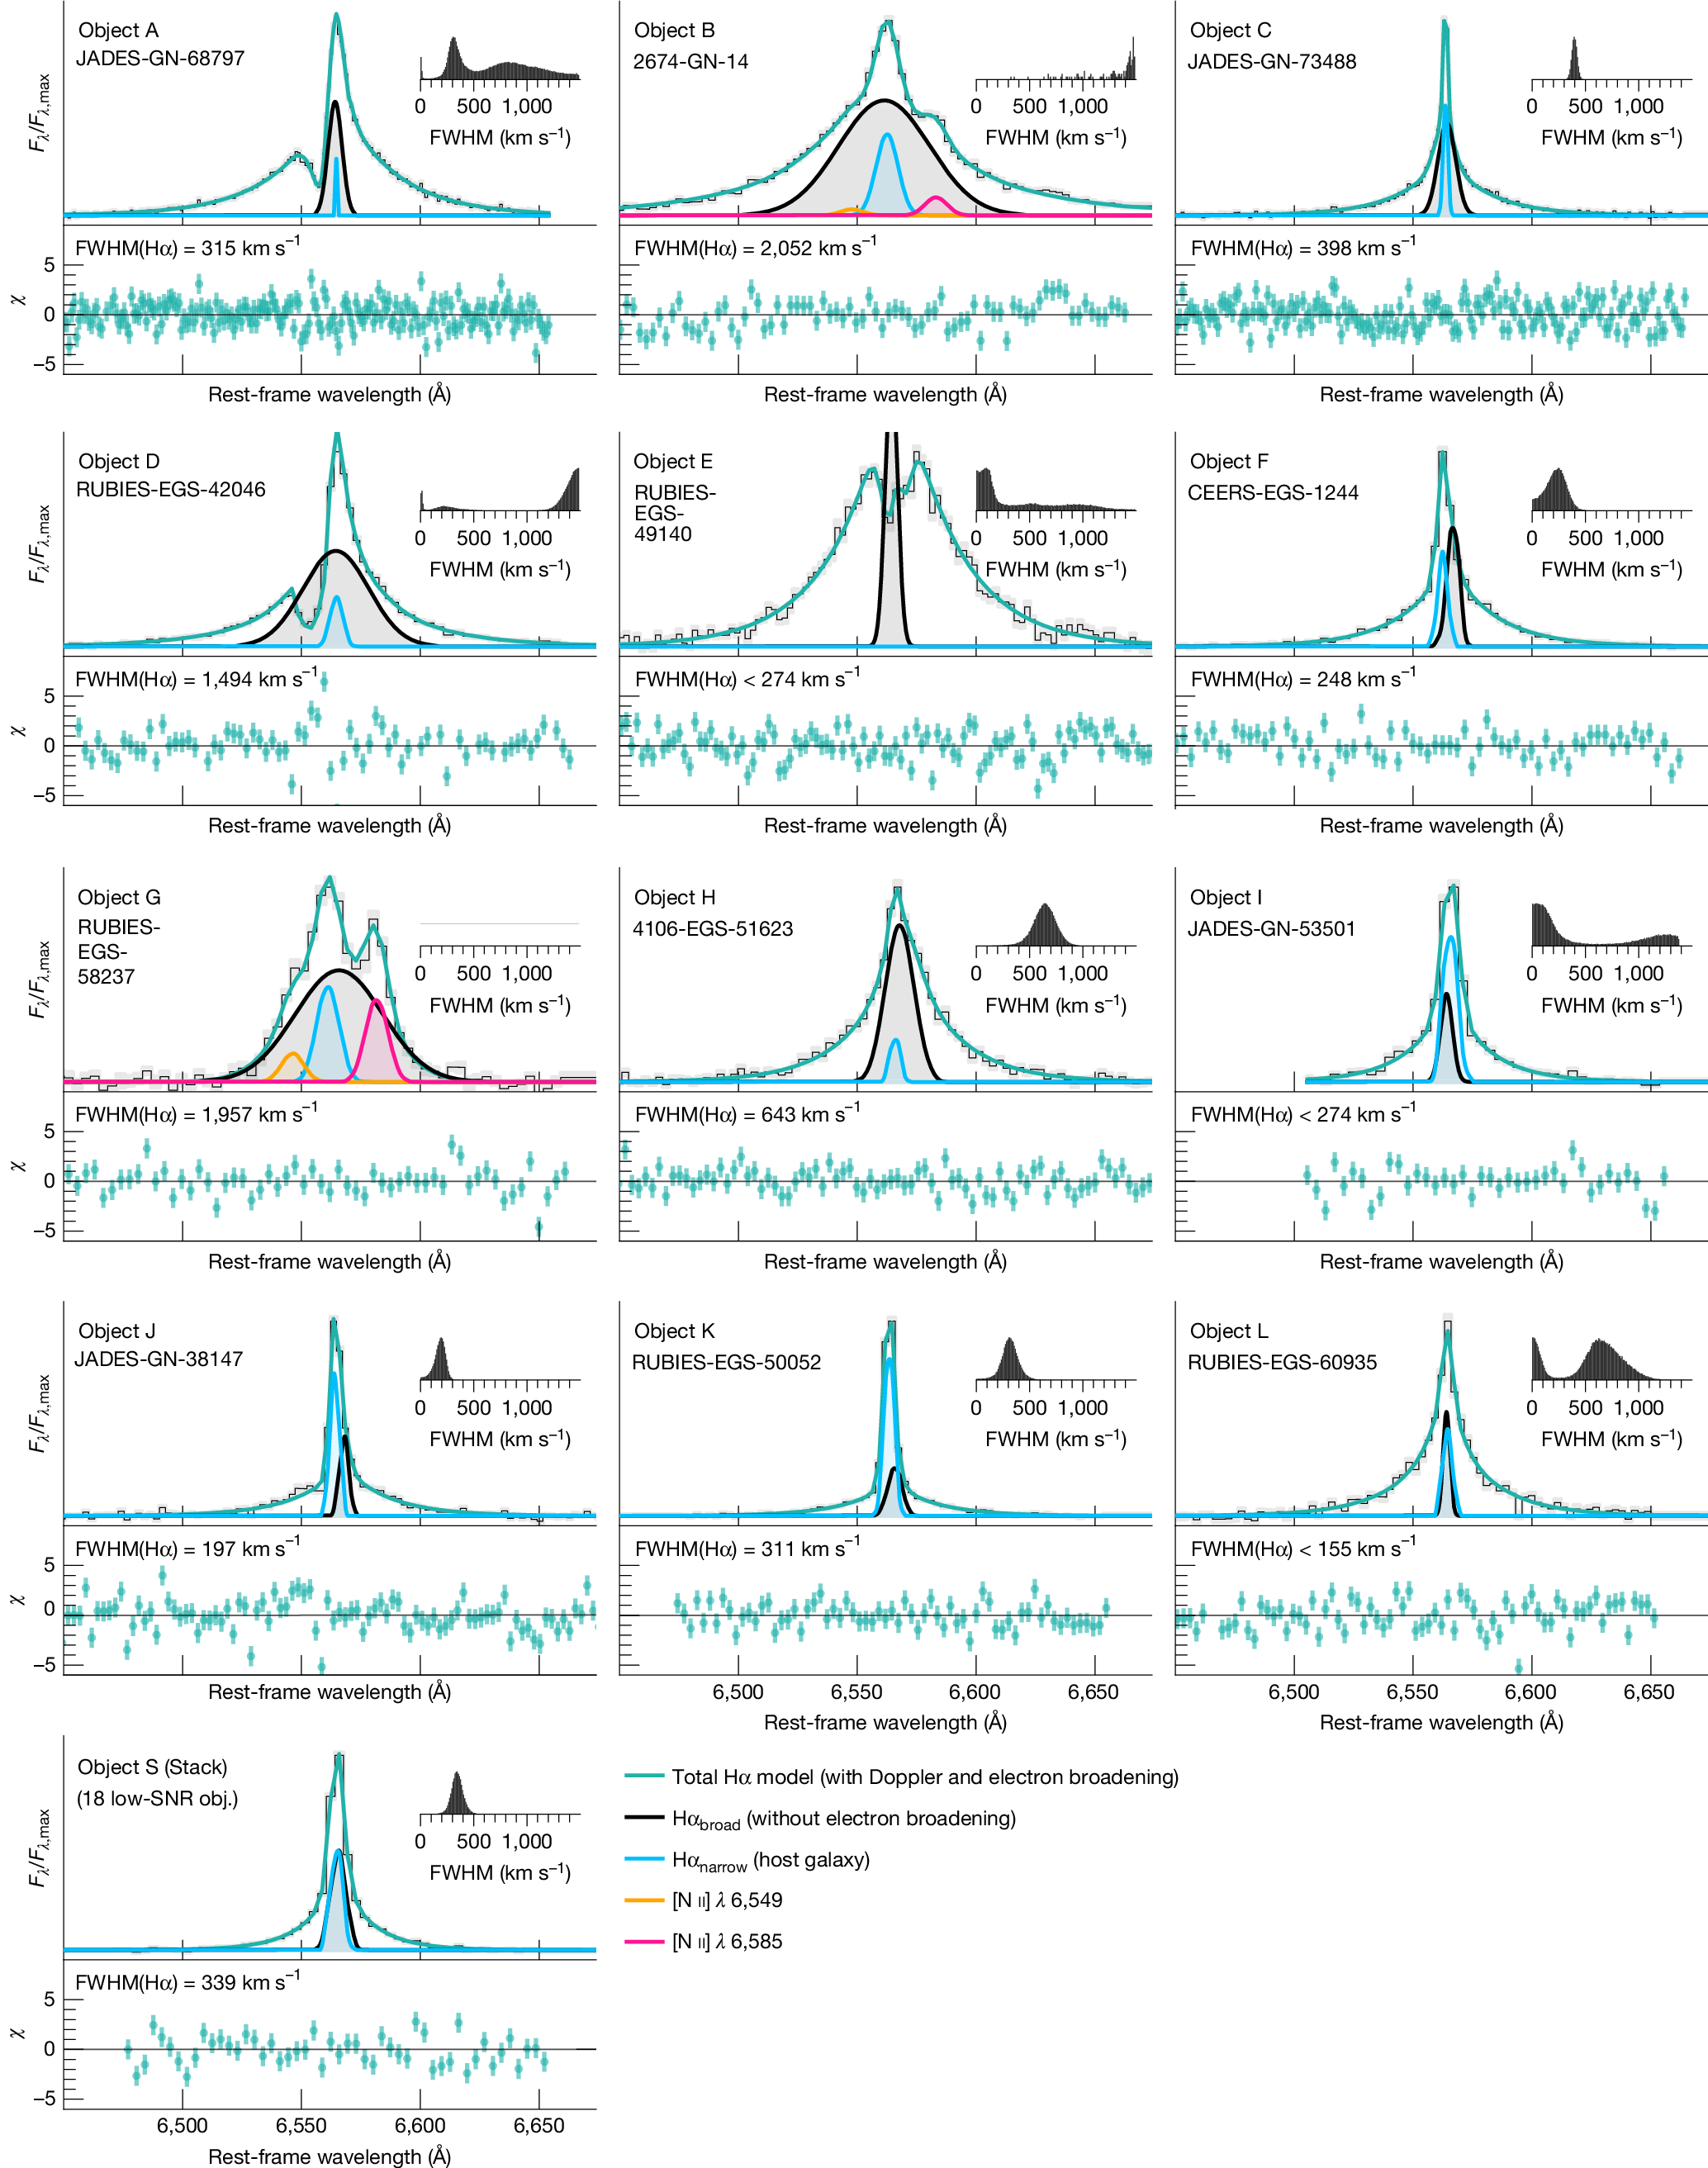
The total model (cyan line) is the broad scattered and non-scattered components of the intrinsic Gaussian line (black line and grey fill), and a narrow Gaussian Hα component from the host galaxy (blue line), as shown in the legend. The residuals of the best-fit total model are shown in cyan below each spectral line in terms of the number of standard deviations. In objects A, D and E, a P Cygni profile or a Gaussian absorption feature are included. The insets show the FWHM posterior of the Doppler component of the broad Hα (limited to <1,500 km s−1 for clarity). In all cases except for objects B and G, which are complex and may not be well-modelled by our simple approach, the widths of the broad Hα lines are dominated by the electron-scattering mechanism (1,000–2,000 km s−1), whereas the Doppler motions are either unresolved or on the order of several hundred km s−1.
The characteristic properties of the electron-scattering gas can be inferred from the line wings. First, we estimate the free-electron column density, Ne, from the width of the exponential component25,26. We use our own Monte Carlo electron-scattering code with a simple shell geometry to calculate the relationship between the electron-scattering optical depth, τe, the temperature, and the characteristic width of the exponential (Methods). We find τe = 0.5–2.8, implying that the column density is approximately distributed as Ne ≃ 0.7–4.2 × 1024 cm−2 for the sample, assuming an electron temperature between 10,000 K and 30,000 K (Extended Data Table 1 and Extended Data Fig. 7). The absence of strong broadening of the [O iii] λλ4,959, 5,007 doublet, whereas the Hβ line next to it is broadened, suggests that the electron volume density, ne, in the scattering region, must be at least several times the critical density for these lines. The characteristic spherical size of the scattering region, Rc, can be inferred by taking the ratio of the column and volume densities in a simple constant density sphere, that is, Rc ~ 3Ne/ne. Assuming \(\log [{n}_{{\rm{e}}}({{\rm{cm}}}^{-3})]\gtrsim 6.5\), we find sizes of at most a hundred light days. With higher densities14,29 (that is, \(\log [{n}_{{\rm{e}}}({{\rm{cm}}}^{-3})]\gtrsim 8\)), the sizes would be smaller (about a few light days).
The dense Compton-thick gas inferred from the line wings offers a natural explanation for the Balmer absorption lines observed frequently at high redshift2,29. Given the extreme column and volume densities of the ionized gas inferred here, the fraction of the gas at the n = 2 level should provide sufficient optical depth to produce these features. We model the features with P Cygni profiles for objects A and D, as they fit the characteristic sharp transition between the emission peak and the blueshifted absorption30 much better than pure absorption. The properties of the absorption features indicate a largely spherical gas distribution, with mild outflow velocities below a few hundred km s−1. In cases of high optical depth and lower velocities, radiative transfer effects may induce a complex self-absorption feature in the line centre, which may be filled by narrow emission lines from the rest of the galaxy, making it difficult to assess how common such Balmer absorption is.
We now turn to the origin of the lines in these systems. The line cores in most of our sample could be explained by very mild outflows, consistent with the photospheric velocities we find for the P Cygni lines in objects A and D (about 200–300 km s−1). This mild outflow could be due to feedback from a burst of star formation. However, the brighter systems in our sample have ionizing luminosities of ≳1045 erg s−1, based on observed Hα luminosities around 1043 erg s−1 (ref. 31), which is nearly four orders of magnitude higher than in those star clusters with typical luminosity densities of about 1041 erg s−1 per pc2 or per pc3. Distributing the inferred luminosity across multiple sources over a larger volume (for example, many accreting extremely massive stars32) does not resolve this problem because the inferred gas masses (using Ne ~ 1024 cm−2 and ne ≲ 108 cm−3) require ionizing luminosities ≳109L⊙ to keep each of them ionized. Only AGN accretion can realistically power such large ionizing luminosities in regions under a few hundred light days. This upper limit is consistent with the prediction from AGN radius–luminosity relation33 of approximately 5 light days for a Hα luminosity of 1043 erg s−1.
Our analysis eases or resolves some of the challenges faced by the AGN interpretation. First, removing the effects of electron scattering leaves intrinsic line cores 10 times narrower than those obtained from a simple Gaussian fit to the full line profile (the deconvolved black Gaussians in Fig. 3). Assuming these intrinsic line cores are entirely due to orbital motion around the SMBH, the new inferred black hole masses are, therefore, lower by about a factor of a hundred (Extended Data Table 1). Our estimates of the maximum SMBH masses are consistent with the SMBH–host galaxy scaling relation found at lower redshifts34 (Fig. 4), alleviating much of the black hole mass and early growth problems, and the number density problem. Second, we infer a high column density of ionized gas, which should suppress soft X-ray emission by photoelectric absorption, even at low metallicities, because of He absorption35. However, the column densities we infer here will attenuate the hard X-rays only by a factor of a few (Methods)—less than the ≳1 dex required to satisfy the observations6,7,8,9,10. Therefore, more importantly, steep hard X-ray spectral slopes and/or power-law cut-offs at relatively low spectral energies are also required to suppress the X-rays. These steep hard X-ray slopes are found in high-accretion rate AGN, such as narrow-line Seyfert 1 (NLS1) objects36, possibly because of enhanced Compton cooling of the corona by strong soft X-ray emission from a bright disk37. Finally, the high-density gas cocoon may help to explain the radio non-detections29 by free-free absorption38 and by suppressing jet formation by baryon loading.
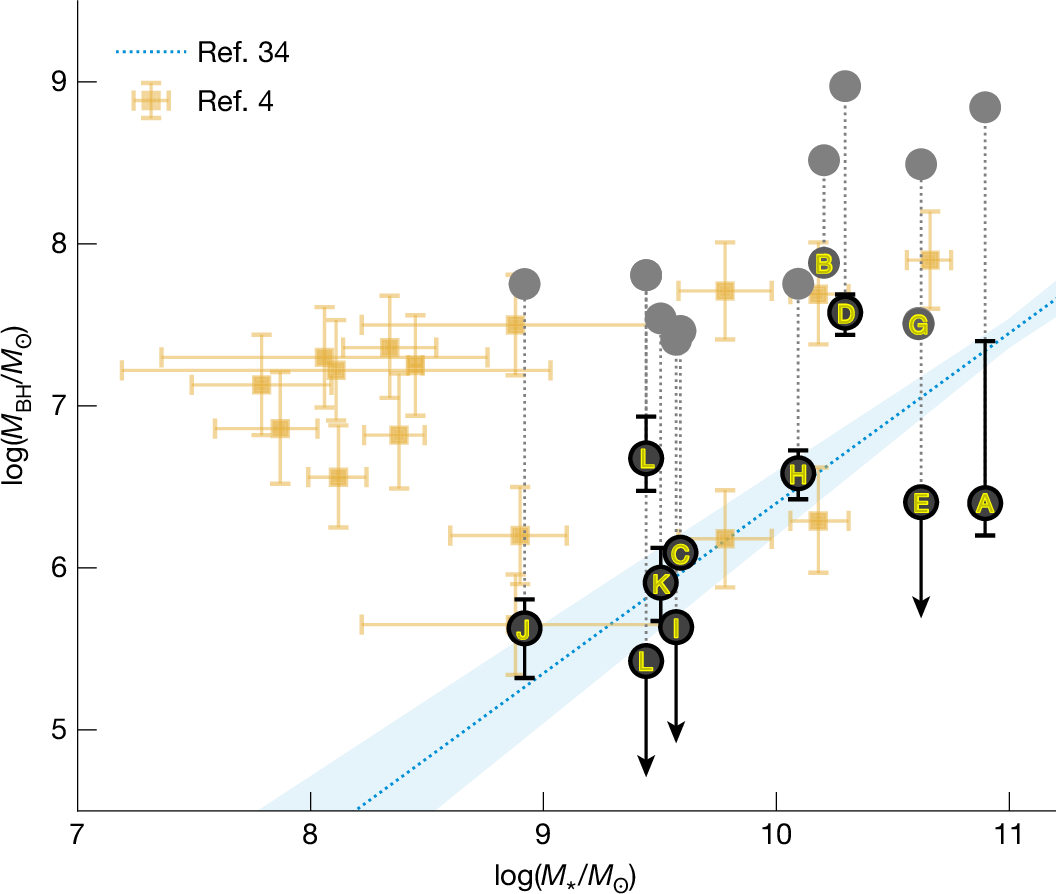
The SMBH masses are determined from the Doppler components of our fiducial model (letter-labelled points) using a virial relation49. Their uncertainties represent the 16th and 84th percentiles of the posterior distributions, while the upper limits are defined as 2σ values. Objects B and G may have complex absorption features that could substantially change their MBH—they are therefore plotted only in grey. The posterior of FWHMDoppler for object L is strongly bimodal (Extended Data Table 3), so log(MBH) is split into two points. Previous estimates from the literature are also shown (yellow points), most of which are included in our low-SNR stack, which has median inferred log(MBH) ≲ 5.6. We also show the black hole masses inferred with a Gaussian model