Cell-free chromatin state tracing reveals disease origin and therapy responses
TL;DR
cf-EpiTracing is a sensitive automated platform that profiles histone modifications in cell-free DNA from minimal plasma. It accurately identifies disease origins, subtypes, and therapy responses across multiple conditions, enabling early diagnosis and prognosis.
Key Takeaways
- •cf-EpiTracing enables accurate deconvolution of cell types of origin using histone modifications in cell-free DNA.
- •The platform detects early-stage diseases, stratifies lymphoma subtypes, and predicts therapeutic responses.
- •It outperforms existing methods in sensitivity and specificity, requiring as little as 50 μl of plasma.
Tags
Abstract
Cell-free DNA in blood originates from fragmented chromatin released by dying cells from both healthy and diseased tissues1,2. These fragments carry rich molecular modalities that can reveal pathological alterations in tissues of origin3,4,5,6,7,8,9,10. Here we develop cf-EpiTracing, a highly sensitive automated platform that profiles histone modifications in cell-free DNA from as little as 50 μl of human plasma. By integrating multimodal chromatin states with machine learning, cf-EpiTracing enables accurate deconvolution of cell types of origin. We generated 2,417 cf-EpiTracing profiles from plasma of 125 healthy individuals and 549 patients with inflammatory bowel disease, colorectal cancer, coronary heart disease or lymphoma. cf-EpiTracing enabled unbiased identification of primary diseased tissues and other organ involvement, stratification of B cell lymphoma subtypes with different genetic and epigenetic underpinnings, and detection of early-stage diseases or lesions. Surveying dynamics of epigenetic signatures uncovered disease transformation from follicular lymphoma to diffuse large B cell lymphoma. Further, cf-EpiTracing revealed genomic translocations and epigenetic alterations in patients with mantle cell lymphoma. Of note, our study leverages holistic epigenetic signatures, independently of knowledge of gene transcription, to accurately report recurrence risk and therapeutic response. Together, these findings establish cf-EpiTracing as an automated, non-invasive, epigenome-centric framework with broad applications in early diagnosis, molecular subtyping and prognostic prediction.
Main
Liquid biopsies targeting cfDNA analytes are emerging as a promising noninvasive diagnostic approach, with clinical potential in prenatal testing11,12, disease diagnosis10,13,14 and transplantation monitoring15,16,17. However, an inability to determine tissues of origin and limited efficiency with low cfDNA abundance as well as profound heterogeneities of genetic variations among patients preclude widespread applications18,19,20,21,22. Plasma cell-free nucleosomes have been assayed by cell-free immunoprecipitation (cfChIP)10,23,24, imaging25, enzyme-linked immunosorbent assay26 and mass spectrometry27 to yield molecular information on diseased cell types. Inference of tissue of origin in plasma cfChIP has been performed on the basis of the assumed positive correlation between trimethylation of K4 of histone H3 (H3K4me3) and gene transcription10. Yet, H3K4me3 is insufficient to interpret gene regulatory mechanisms underlying tissue pathogenesis and changes in cell states without accompanying transcriptional changes28,29,30,31,32,33,34.
Here we develop cf-EpiTracing, an automation platform for capturing a combination of cell-free histone modifications from trace quantities of human plasma with high sensitivity. cf-EpiTracing not only enables early-stage disease detection, but also stratifies patients with lymphoma into subtypes with different molecular underpinnings and disease progression stages as well as therapeutic response. As a proof of concept, cf-EpiTracing-defined epigenetic signatures outperform existing clinical indices in predicting prognosis in patients with colorectal cancer (CRC) or lymphoma.
cf-EpiTracing on an automated platform
We developed cf-EpiTracing, a method implemented on a Biomek i5 automated workstation to capture genome-wide multiple cell-free histone modifications in human plasma (Fig. 1a and Methods). In brief, antibodies against histone modifications were covalently conjugated to paramagnetic beads. To control for batch effect and sample variations, each 25–200 μl plasma sample was spiked with lightly fixed chromatin derived from Drosophila S2 cells. Distinct from cfChIP, in which adapters for PCR amplification and sequencing are attached by on-bead ligation, cf-EpiTracing incorporates barcoded adapters into immobilized DNA fragments via Tn5 transposase tagmentation (Supplementary Tables 1 and 2). The follow-up steps, such as DNA releasing and library preparation, are finished in the same well. Of note, the cf-EpiTracing design relies on a two-round barcoding strategy to achieve high throughput, facilitating the parallel processing of multiple samples in 96-well plates. Simplified procedures allow efficient profiling of cell-free epigenomes in hundreds of samples within 6 h after antibody incubation.
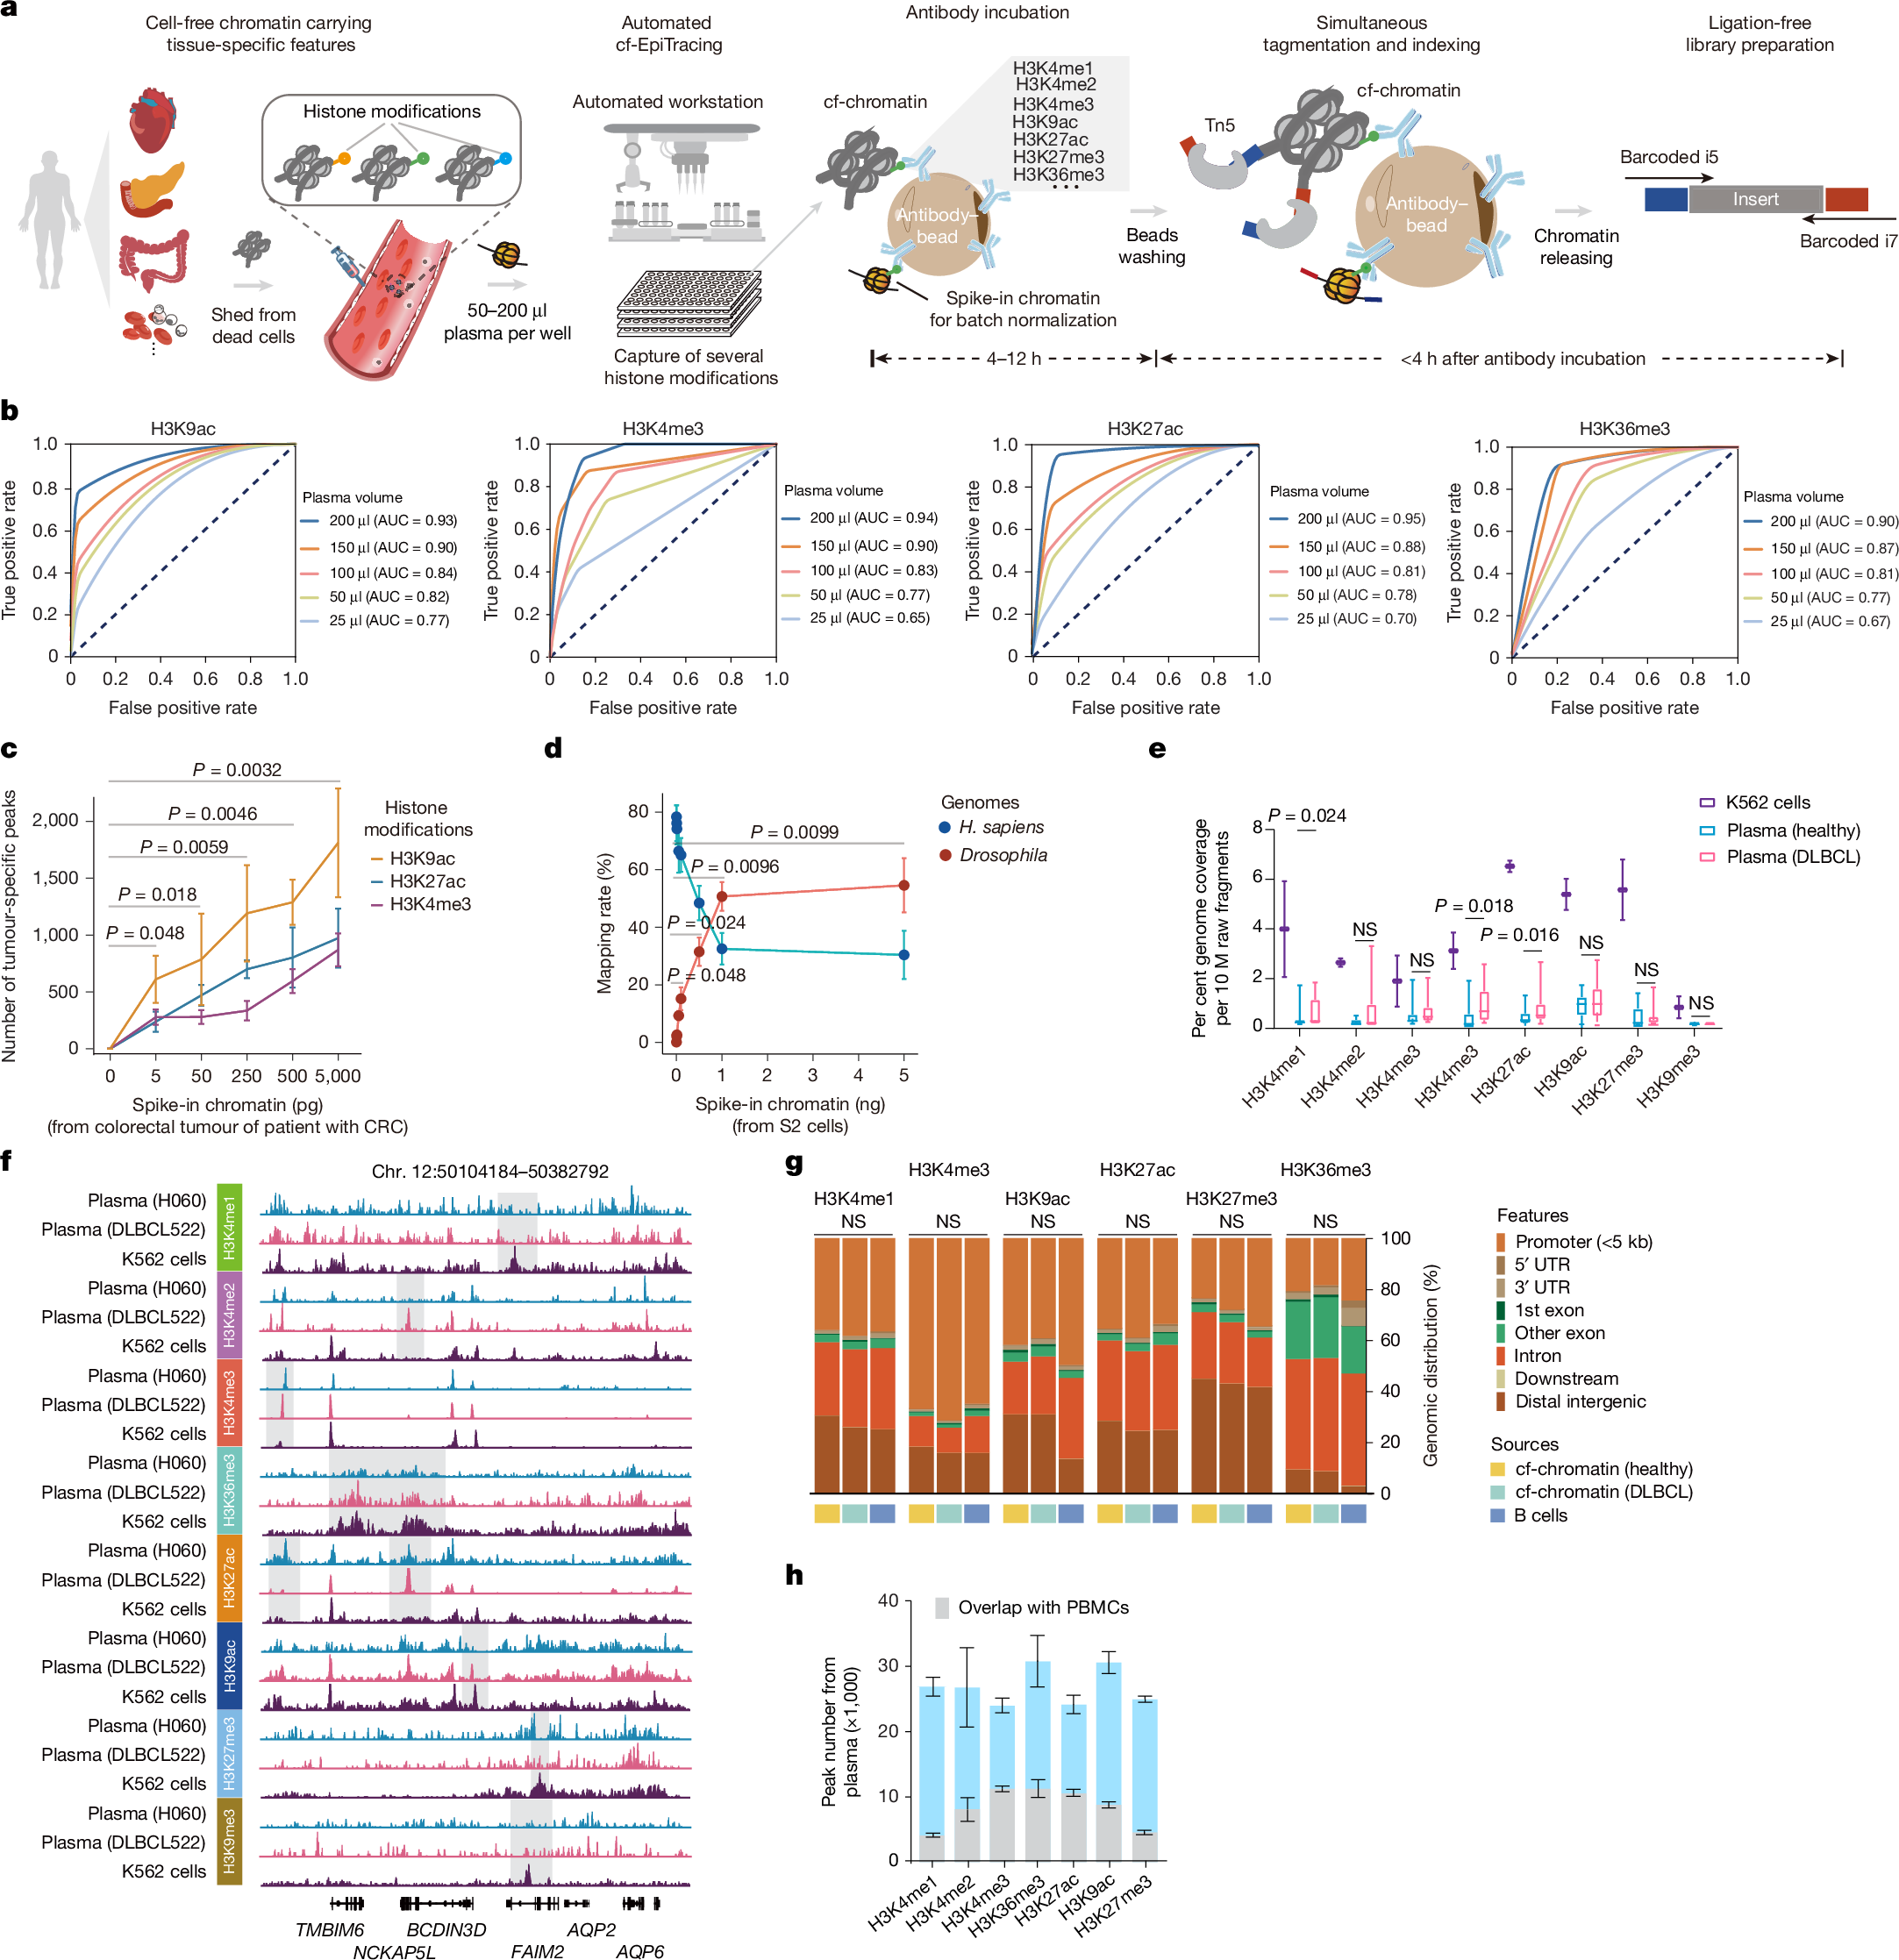
a, The cf-EpiTracing experimental workflow. b, Receiver operating curves for cf-EpiTracing data with varying volumes of human plasma. Merged cf-EpiTracing signals from 200 μl plasma from healthy donors (n = 125) were used as gold standard. c, Plasma from representative healthy individuals (n = 3) was spiked with varying amounts of fragmented chromatin from a colorectal tumour of a patient with CRC (stage III). The top 10,000 peaks were selected for peak calling in both plasma and tumour tissue. P values are shown for H3K9ac. d, Plasma from a representative healthy individual was spiked in with varying amounts of fragmented chromatin of Drosophila S2 cells. The graph shows mapping rate of raw reads to the Homo sapiens or Drosophila genomes. Data represent three biological replicates for H3K4me3, H3K27ac and H3K36me3. e, Normalized genome coverage of peak regions from ChIP–seq data of K562 cells (n = 2) and cf-EpiTracing data from healthy individuals (n = 15) or patients with DLBCL (n = 15). In box plots, the centre line is the median, box edges delineate first and third quartiles and whiskers extend to 1.5× interquartile range. f, Track view of cf-EpiTracing signals for eight histone modifications from a healthy individual (H060, blue), a patient with DLBCL (DLBCL522, pink), and K562 cells (purple). Genomic regions with dynamic signals across three samples are highlighted in grey boxes. g, Genomic feature distribution of cf-EpiTracing peaks of cf-chromatin from healthy individuals (n = 15), patients with DLBCL (n = 15) and ChIP–seq peaks of B cells (n = 3). Mean genomic distribution percentage for each feature was calculated among samples. UTR, untranslated region. h, Peak numbers of multiple histone modifications in cf-EpiTracing profiles from all healthy donors (n = 125). Grey boxes show overlaps with PBMC peaks. Data are expressed as mean ± s.d (c,d,h). P values by t-test (two-sided, c–e) and two-sided Kruskal−Wallis test (g). NS, not significant.
Streamlined cf-EpiTracing enables measurement of various epigenomic modalities with small amounts of sample. After normalization with the spike-in Drosophila chromatin reference35,36, batch effects and sample variations are well controlled and corrected (Extended Data Fig. 1a). cf-EpiTracing demonstrated high peak accuracy with samples ranging from 50 μl to 200 μl (area under the curve (AUC), 0.77–0.95), and lower accuracy with 25 μl samples (Fig. 1b and Extended Data Fig. 1b). To further examine the detection sensitivity of target signals, we performed a titration of fragmented chromatin from CRC tumour tissues or Drosophila S2 cells added into plasma from healthy donors. External signals with as little as 0.005 ng equivalent chromatin were reliably detected in healthy plasma (Fig. 1c,d).
We performed cf-EpiTracing with plasma samples from healthy individuals and from patients with diffuse large B cell lymphoma (DLBCL) for multiple histone modifications, marking active promoters (H3K4me2, H3K4me3, acetylation of K9 of histone H3 (H3K9ac) or H3K27ac), primed and active enhancers (H3K4me1, H3K4me2, H3K9ac or H3K27ac), gene body of active genes (H3K36me3) and repressive regions (H3K9me3 or H3K27me3) (Fig. 1e and Supplementary Table 3). Good reproducibility of cf-EpiTracing data was confirmed in plasma from self-reported healthy donors for each histone modification (Extended Data Fig. 1c). Notably, we observed a high correlation between plasma and blood cells within the same histone modification, with evident distinction between different histone modifications in most cases (Extended Data Fig. 1d).
Furthermore, we benchmarked cf-EpiTracing with cfChIP methods10,23. As expected, Tn5 tagmentation of cell-free chromatin (cf-chromatin) predominantly produced sub-nucleosome patterns (median 123 bp) compared with the directly purified cfDNA or ligation-based cfChIP fragments (median around 170 bp; Extended Data Fig. 2a). Compared with the public cfChIP data from approximately 2 ml of human plasma10, cf-EpiTracing with 200 μl of plasma exhibited overall comparable signals, but a better signal-to-noise ratio and increasing peak accuracy, using either cfChIP or cf-EpiTracing peaks as gold standard (Extended Data Fig. 2b–d). In a pairwise comparison, cf-EpiTracing outperformed cfChIP across different plasma volumes from the same samples (Extended Data Fig. 2e). Next, we determined the abundance of histone modifications in human plasma by examining the normalized genome coverage of peak regions in healthy individuals and patients with DLBCL (Fig. 1e,f). Among eight screened histone modifications, H3K9ac, H3K27ac and H3K36me3 were most prevalent in cf-chromatin. Repressive histone modifications (H3K27me3 and H3K9me3) were abundant in K562 cells but showed limited peaks and coverage in plasma. Patients with cancer exhibited discernible levels of global histone modifications in plasma cf-chromatin, particularly H3K4me1, H3K27ac and H3K36me3, compared with healthy controls (Fig. 1e). Owing to its lower abundance in plasma and relatively limited dynamics across tissues and cells37, H3K9me3 was excluded from further analyses. The cf-EpiTracing data from healthy donors and patients with DLBCL showed similar genomic distribution patterns to those in tissues and primary cells (Fig. 1g). Notably, we observed considerable plasma-specific signals in each histone modification, probably released from non-peripheral blood mononuclear cell (PBMC) remote tissues (Fig. 1h). Together, these results demonstrated that cf-EpiTracing provided an efficient, robust automated framework for genome-wide profiling of multiple histone modifications with high sensitivity using as little as 25 μl of human plasma.
ICSs for inferring tissue of origin
We next initiated integrated analyses to delineate tissue or cell type-specific signatures, referred to as integrated chromatin states (ICSs). These ICSs infer specific regulatory signatures in tissues or cells by jointly quantifying combinatorial presence and absence of histone modifications across the reference epigenome, encompassing 7 histone modifications derived from 65 tissues and primary cells (downloaded from BLUEPRINT38, Roadmap Epigenomics39 and ENCODE40 projects; Fig. 2a, Extended Data Fig. 3a and Supplementary Table 4). Our analysis focused on regulatory regions with the chromatin activity and cell type specificity, rather than relying on each of these histone modifications. We trained an 18-ICS ChromHMM41 model consisting of 13 active and 5 repressed ICSs (Extended Data Fig. 3b,c and Supplementary Table 5). Benchmarking the capacity of distinguishing all 65 tissues and primary cells, we showed that the ICSs, particularly those denoted by H3K27ac, H3K4me3 and H3K9ac, exhibited the highest variability and tissue specificity (Extended Data Fig. 3d). Subsequently, we defined a compendium of tissue-specific signatures comprising thousands of genomic regions for each tissue and cell type (Methods). The ICSs of cf-chromatin were subjected to deconvolution for tissue and cell type-specific signatures and scored for potentially regulated genes, facilitating tracing of tissues or cell types of origin and delineation of regulatory events (Fig. 2a).
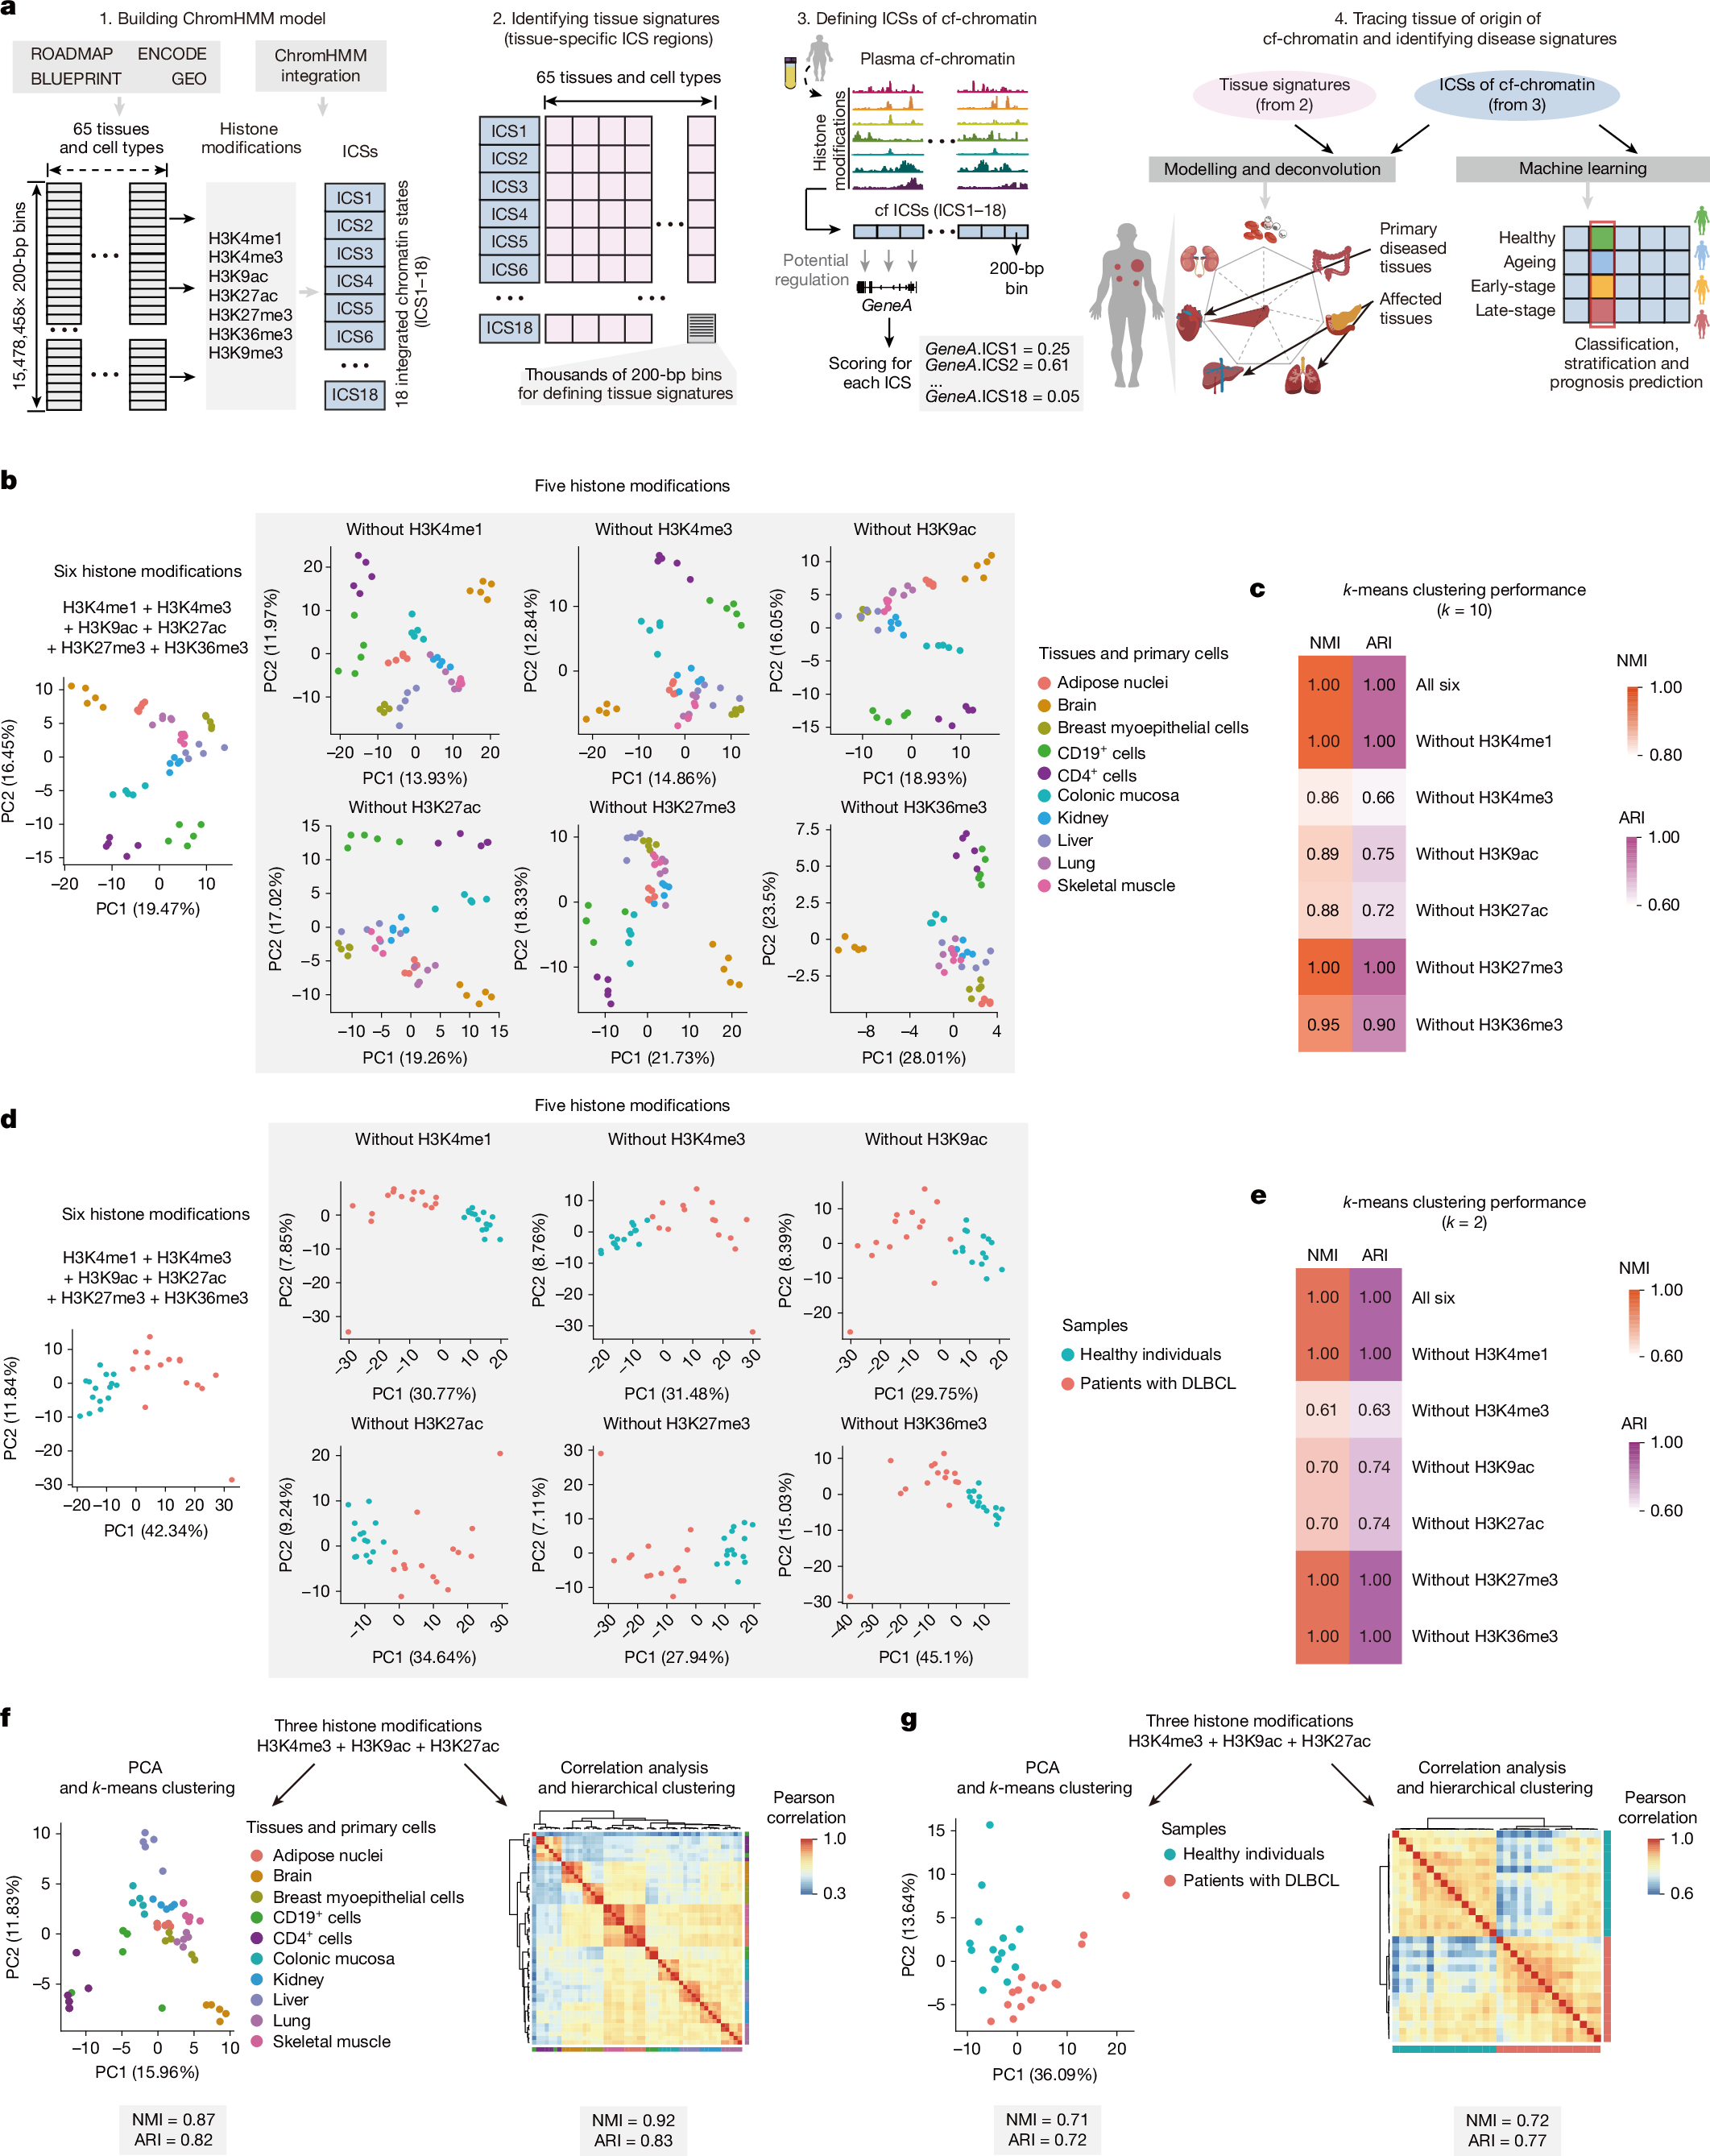
a, Schematic of the computational pipeline for identification of tissue-of-origin signatures and disease screening. b, PCA visualization of 10 representative tissues and primary cells (n = 5 each) using signals in genomic regions of signatures for 65 tissues and primary cell types defined by 18 tissue-specific ICSs. Signals in these genomic regions were computed using combined histone modifications from ChIP–seq datasets. c, Heat map showing k-means clustering performance using indicated combinations of histone modifications in tissues and primary cells. d, PCA visualization of patients with DLBCL (n = 15) and healthy individuals (n = 15) using signals in genomic regions for B cell signatures defined by 18 tissue-specific ICSs. Signals in these genomic regions were computed using combined histone modifications from plasma cf-EpiTracing data. e, Heat map showing k-means clustering performance using indicated combinations of histone modifications in plasma. f, PCA visualization (left) and correlation heat map (right) of 10 representative tissues and primary cells (n = 5 each) based on signals in genomic regions for tissue-specific signatures of all 65 tissues and primary cells. Tissue-specific signatures in ICS1 (Znf/Rpts), ICS2 (Het), ICS3 (Quies1), ICS4 (ReprPCWk), ICS5 (ReprPC), ICS8 (Quies2), ICS10 (TxWk) and ICS11 (Tx) were removed from analyses. The signals in these genomic regions of tissue-specific signatures were computed using the top three histone modifications with the highest performance in clustering tissues and cells, as identified in c. g, PCA visualization (left) and correlation heat map (right) for patients with DLBCL (n = 15) and healthy individuals (n = 15) using signals in genomic regions for tissue-specific signatures of B cells. Tissue-specific signatures in ICS1, ICS2, ICS3, ICS4, ICS5, ICS8, ICS10 and ICS11 were removed from analyses. The signals in genomic regions for tissue-specific signatures were computed, using the top three histone modifications with the highest performance in clustering plasma samples, as identified in e.
We first tested the minimum requirement of histone modifications to accurately capture intra-tissue variabilities. We conducted principal component analysis (PCA) clustering on 10 representative tissues and cells, leveraging detected signals in genomic regions of tissue-specific 18-ICS defined signatures (Fig. 2b). Signals were calculated by integrating chromatin immunoprecipitation with sequencing (ChIP–seq) data involving different combinations of histone modifications to generate ICSs for each tissue or cell type. A combination of H3K4me3, H3K9ac and H3K27ac had the largest effect, as evidenced by the decrease upon exclusion of each with normalized mutual information (NMI) and adjusted Rand index (ARI) in k-means clustering (Fig. 2c). Hierarchical clustering analyses further supported the predominant contribution of these three histone modifications in classifying tissues or cell types (Extended Data Fig. 4a,b). Consistent with these results at the tissue and cell level, H3K4me3, H3K9ac and H3K27ac cf-EpiTracing together proved effective in detection of the signatures associated with diseased tissues and cell types in patients with cancer (Fig. 2d,e and Extended Data Fig. 4c,d). Notably, we observed no substantial loss of accuracy in unsupervised clustering of tissues and cell types or plasma samples when adopting these top three contributing histone modifications in the integration analyses (Extended Data Fig. 4e,f).
The ChromHMM framework effectively leverages state transition probabilities to accurately infer chromatin states, even when using a subset of histone modifications. We noted that inferring 18 ICSs solely through integrating these top three contributing histone modifications provided limited interpretation of ICSs associated with heterochromatin and transcriptional repression. These ICSs are less distinguishable by signals in H3K4me3, H3K9ac and H3K27ac. Therefore, we prioritized the selection of the ten most informative ICSs that are fully characterized using H3K4me3, H3K9ac and H3K27ac (ICS6, ICS7, ICS9 and ICS12–18) in downstream applications. Our data showed that exclusion of other chromatin states, which could not be directly distinguished by these three histone modifications, did not materially affect the performance of cf-EpiTracing in classifying tissues, cells and plasma samples (Fig. 2f,g).
Tracing patient tissue-specific lesions
We assessed the accuracy and specificity of cf-EpiTracing in capturing tissue-of-origin signatures across diverse patient cohorts. These cohorts included age-matched healthy individuals (n = 125) and patients with CRC (n = 107), coronary heart disease (CHD; n = 23) and various subtypes of B cell lymphoma (n = 309; Extended Data Fig. 5a), spanning various stages of in-treatment and pre-treatment from multiple clinical centres (Supplementary Table 6). Our unbiased screening quantified genomic regions for tissue-specific signatures and nominated primary diseased, affected and involved tissues across the body (Fig. 2a and Methods). To assess the sensitivity, we first ascertained the detection of elevated tissue signatures, which were well-correlated with diseases. As expected, we observed prominent signatures from digestive tissues, cardiac tissues and B lymphoid cells in the cf-chromatin of patients with CRC, CHD and B cell lymphoma, respectively (Fig. 3a and Extended Data Fig. 5b,c). Tissue signature ICSs associated with primary diseased tissues readily differentiated patients from healthy individuals and from one another in the generalized linear models (GLMs; Methods). The GLM classifier exhibited robust performance in distinguishing patients with CRC (AUC = 0.965; sensitivity=0.864; specificity=0.924), CHD (AUC = 0.971; sensitivity=0.800; specificity=0.963) and B cell lymphoma (AUC = 0.963; sensitivity=0.839; specificity=0.962) from other individuals in testing groups (Fig. 3b). A global survey of tissue signatures across disease types versus healthy individuals revealed evident signatures from the immune system in addition to the signatures from the primary diseased tissues, indicating possible inflammation and immune dysregulation in patients (Fig. 3c)
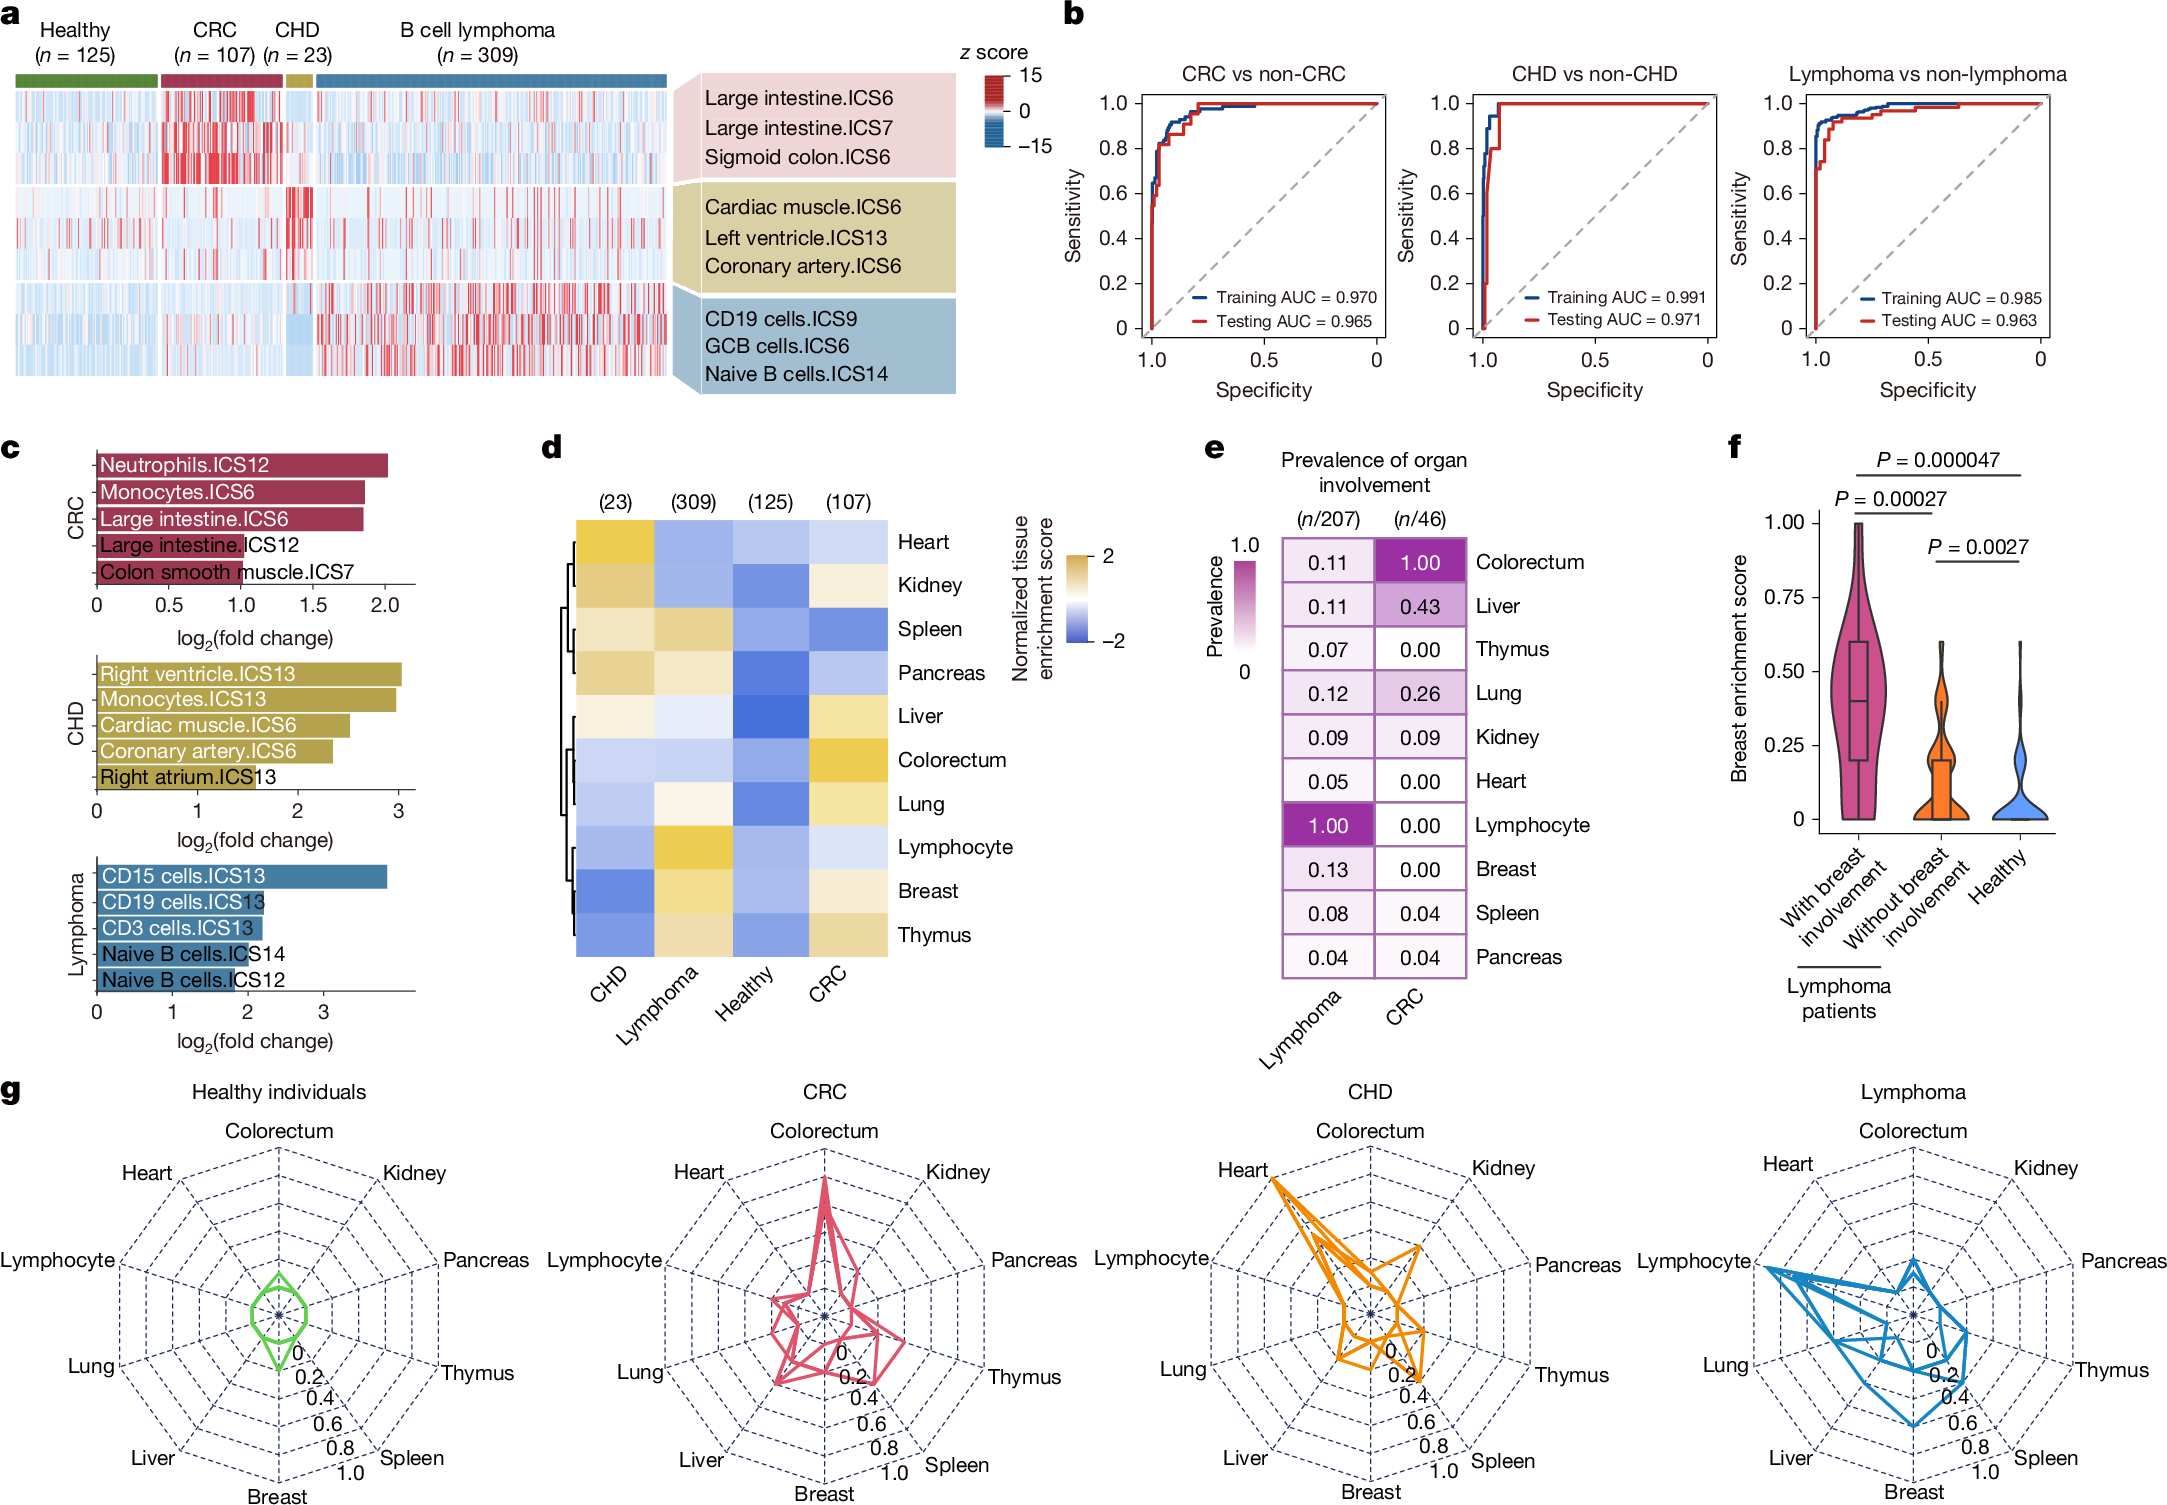
a, Heat map showing tissue-of-origin signals from diseased tissues (colorectum, heart and lymphocyte) across healthy individuals and patients with CRC, CHD or lymphoma. Rows are representative tissue signature ICSs associated with diseased tissues. The heat map was scaled by row. b, Receiver operating characteristic (ROC) curves showing binary classification performance of tissue signatures associated with primary diseased tissues in patients with CRC, CHD or lymphoma in the training (80% of samples) and test (20% of samples) groups. GLMs were used. Non-CRC individuals refer to all healthy individuals and patients with CHD or lymphoma collectively. Non-CHD indivi