Ligand-specific activation trajectories dictate GPCR signalling in cells
TL;DR
연구진은 M2 무스카린 아세틸콜린 수용체(M2R)에 대한 형광 바이오센서 패널을 개발하여 살아있는 세포에서 리간드별 활성화 궤적을 실시간으로 관찰했습니다. 이 연구는 서로 다른 작용제가 최소 네 가지의 구별되는 활성 상태를 생성하며, 이러한 상태가 G 단백질 활성화 능력을 결정함을 보여줍니다.
Key Takeaways
- •M2R에 대한 형광 바이오센서 패널을 개발하여 살아있는 세포에서 리간드별 활성화 궤적을 실시간으로 모니터링할 수 있게 되었습니다.
- •서로 다른 작용제(예: ACh, iperoxo)가 최소 네 가지의 구별되는 활성 상태를 생성하며, 각 상태는 G 단백질 활성화 능력이 다릅니다.
- •리간드별 활성화 궤적과 수용체-G 단백질 복합체의 상대적 풍부도가 G 단백질 선택성과 활성화 정도를 결정합니다.
- •이러한 관찰은 살아있는 세포에서 리간드 효능의 분자적 본질을 밝히며, GPCR 약물 발견에 새로운 가능성을 제시합니다.
Tags
Abstract
G-protein-coupled receptors (GPCRs) are key mediators of cell communication and represent the most important class of drug targets1,2. Biophysical studies with purified GPCRs in vitro have suggested that they exist in an equilibrium of distinct inactive and active states, which is modulated by ligands in an efficacy-dependent manner3,4,5,6,7,8,9,10,11. However, how efficacy is encoded and whether multiple receptor states occur in living cells remain unclear. Here we use genetic code expansion12 and bioorthogonal labelling13,14,15,16 to generate a panel of fluorescence-based biosensors for a prototypical GPCR, the M2 muscarinic acetylcholine receptor (M2R). These biosensors enable real-time monitoring of agonist-promoted conformational changes across the receptor’s extracellular surface in intact cells. We demonstrate that different agonists produce equilibria of at least four distinct active states of the G-protein-bound M2R, each with a different ability to activate G proteins. The formation of these M2R–G-protein complexes occurs over 0.2–5 s along trajectories that involve both common and ligand-specific conformational changes and appear to determine G-protein selectivity. These observations reveal the molecular nature of ligand efficacy in intact cells. Selectively exploiting such different GPCR activation trajectories and conformational equilibria may open new avenues for GPCR drug discovery.
Main
Activation of cell surface receptors by extracellular ligands is the hallmark of cell–cell communication and controls most physiological functions in humans. GPCRs are the largest class of such receptors1,2. After ligand activation, GPCRs communicate their message into cells by recruiting and activating intracellular G proteins17. GPCR ligands can activate (agonist) or inactivate (antagonist/inverse agonist) receptors to various extents, and this diversity in ligand efficacy is exploited in drug therapy18. However, the molecular nature of ligand efficacy and the mechanisms of GPCR activation in living cells remain largely unclear.
Fluorescence spectroscopy studies with purified β2-adrenergic receptors19,20,21,22, and more recent nuclear magnetic resonance (NMR) and double electron–electron resonance (DEER) spectroscopy studies, have established that GPCRs do not operate as simple on/off switches but exist in a dynamic equilibrium of multiple inactive and active states3,4,23,24,25. Partial agonists are believed to stabilize conformational states that are structurally different from those stabilized by full agonists6,11,26,27. Likewise, single-molecule Förster resonance energy transfer (FRET) and advanced NMR spectroscopy studies have demonstrated that GPCRs can form distinct signalling complexes with G proteins28,29, in which the G proteins may possess different nucleotide affinities5,7. Partial agonists have been proposed to stabilize GPCR–G-protein complexes with reduced efficacy towards nucleotide exchange5,7,30,31. However, all of these studies were performed in isolated systems using purified receptors reconstituted in detergent micelles or nanodiscs. Whether GPCRs in the physiological environment of a living cell also adopt different conformations and form distinct signalling complexes is essentially unclear.
Here we develop a new type of conformational GPCR biosensors to probe the existence and ligand modulation of such GPCR–G-protein-signalling complexes in intact cells. Using the M2R as a model, we demonstrate that agonist activation leads to formation of an equilibrium of distinct GPCR signalling complexes along ligand-specific activation trajectories. These distinct activation trajectories and the relative abundances of these distinct receptor–G-protein complexes dictate the type and extent to which specific G proteins are activated.
Development of GPCR biosensors
GPCR activation results in large-scale receptor conformational changes1,32,33,34,35. Most prominently, outward movement of the intracellular part of transmembrane domain 6 enables coupling to and activation of G proteins. In turn, G-protein binding promotes conformational changes in the receptor, including its extracellular domains and the ligand-binding pocket, which stabilize agonist binding1,32,36. This communication between extra- and intracellular receptor domains represents the principle of allosteric coupling.
To track conformational changes at the extracellular surface of GPCRs at a high spatial resolution, we sought to develop a new type of biosensor. These biosensors should be genetically encoded, equipped with minimally sized labels (similar to those used in NMR, DEER and single-molecule FRET studies on isolated receptors) and retain an unmodified intracellular surface to preserve G-protein coupling. We chose the M2R as a model because structural studies have shown that its extracellular conformational changes on activation, including closure of the binding pocket, are the most pronounced among all class A GPCRs of which the structures have been solved36,37,38,39.
The least invasive way to attach probes to a GPCR at the single-residue resolution in living cells is by bioorthogonal chemistry on genetically encoded chemical anchors12,13,14,15. In brief, a non-canonical amino acid (ncAA), also known as an unnatural amino acid, carrying an anchor for rapid catalyst-free labelling is incorporated into the receptor using genetic code expansion technology (GCE). The label is then attached post-translationally by ultrarapid strain-promoted inverse electron-demand Diels–Alder cycloaddition, which occurs within minutes without interfering with native functional groups. Using this strategy, we previously demonstrated quantitative labelling of GPCRs on the live cell surface40.
We screened the entire extracellular surface of the M2R to identify positions at which the click-ncAA trans-cyclooct-2-ene lysine (TCO*K)41 was efficiently incorporated and yielded robust labelling with a cell-impermeable, tetrazine-conjugated cyanine dye (Tet–Cy3) (Fig. 1a). Of 72 receptor mutants, 25 displayed good cell surface expression and labelling (Extended Data Fig. 1). The other 47 constructs were not expressed, not trafficked to the cell surface or showed no labelling at all (Fig. 1b and Supplementary Fig. 1). As a control, labelling in the absence of TCO*K produced no fluorescence (Supplementary Fig. 2).
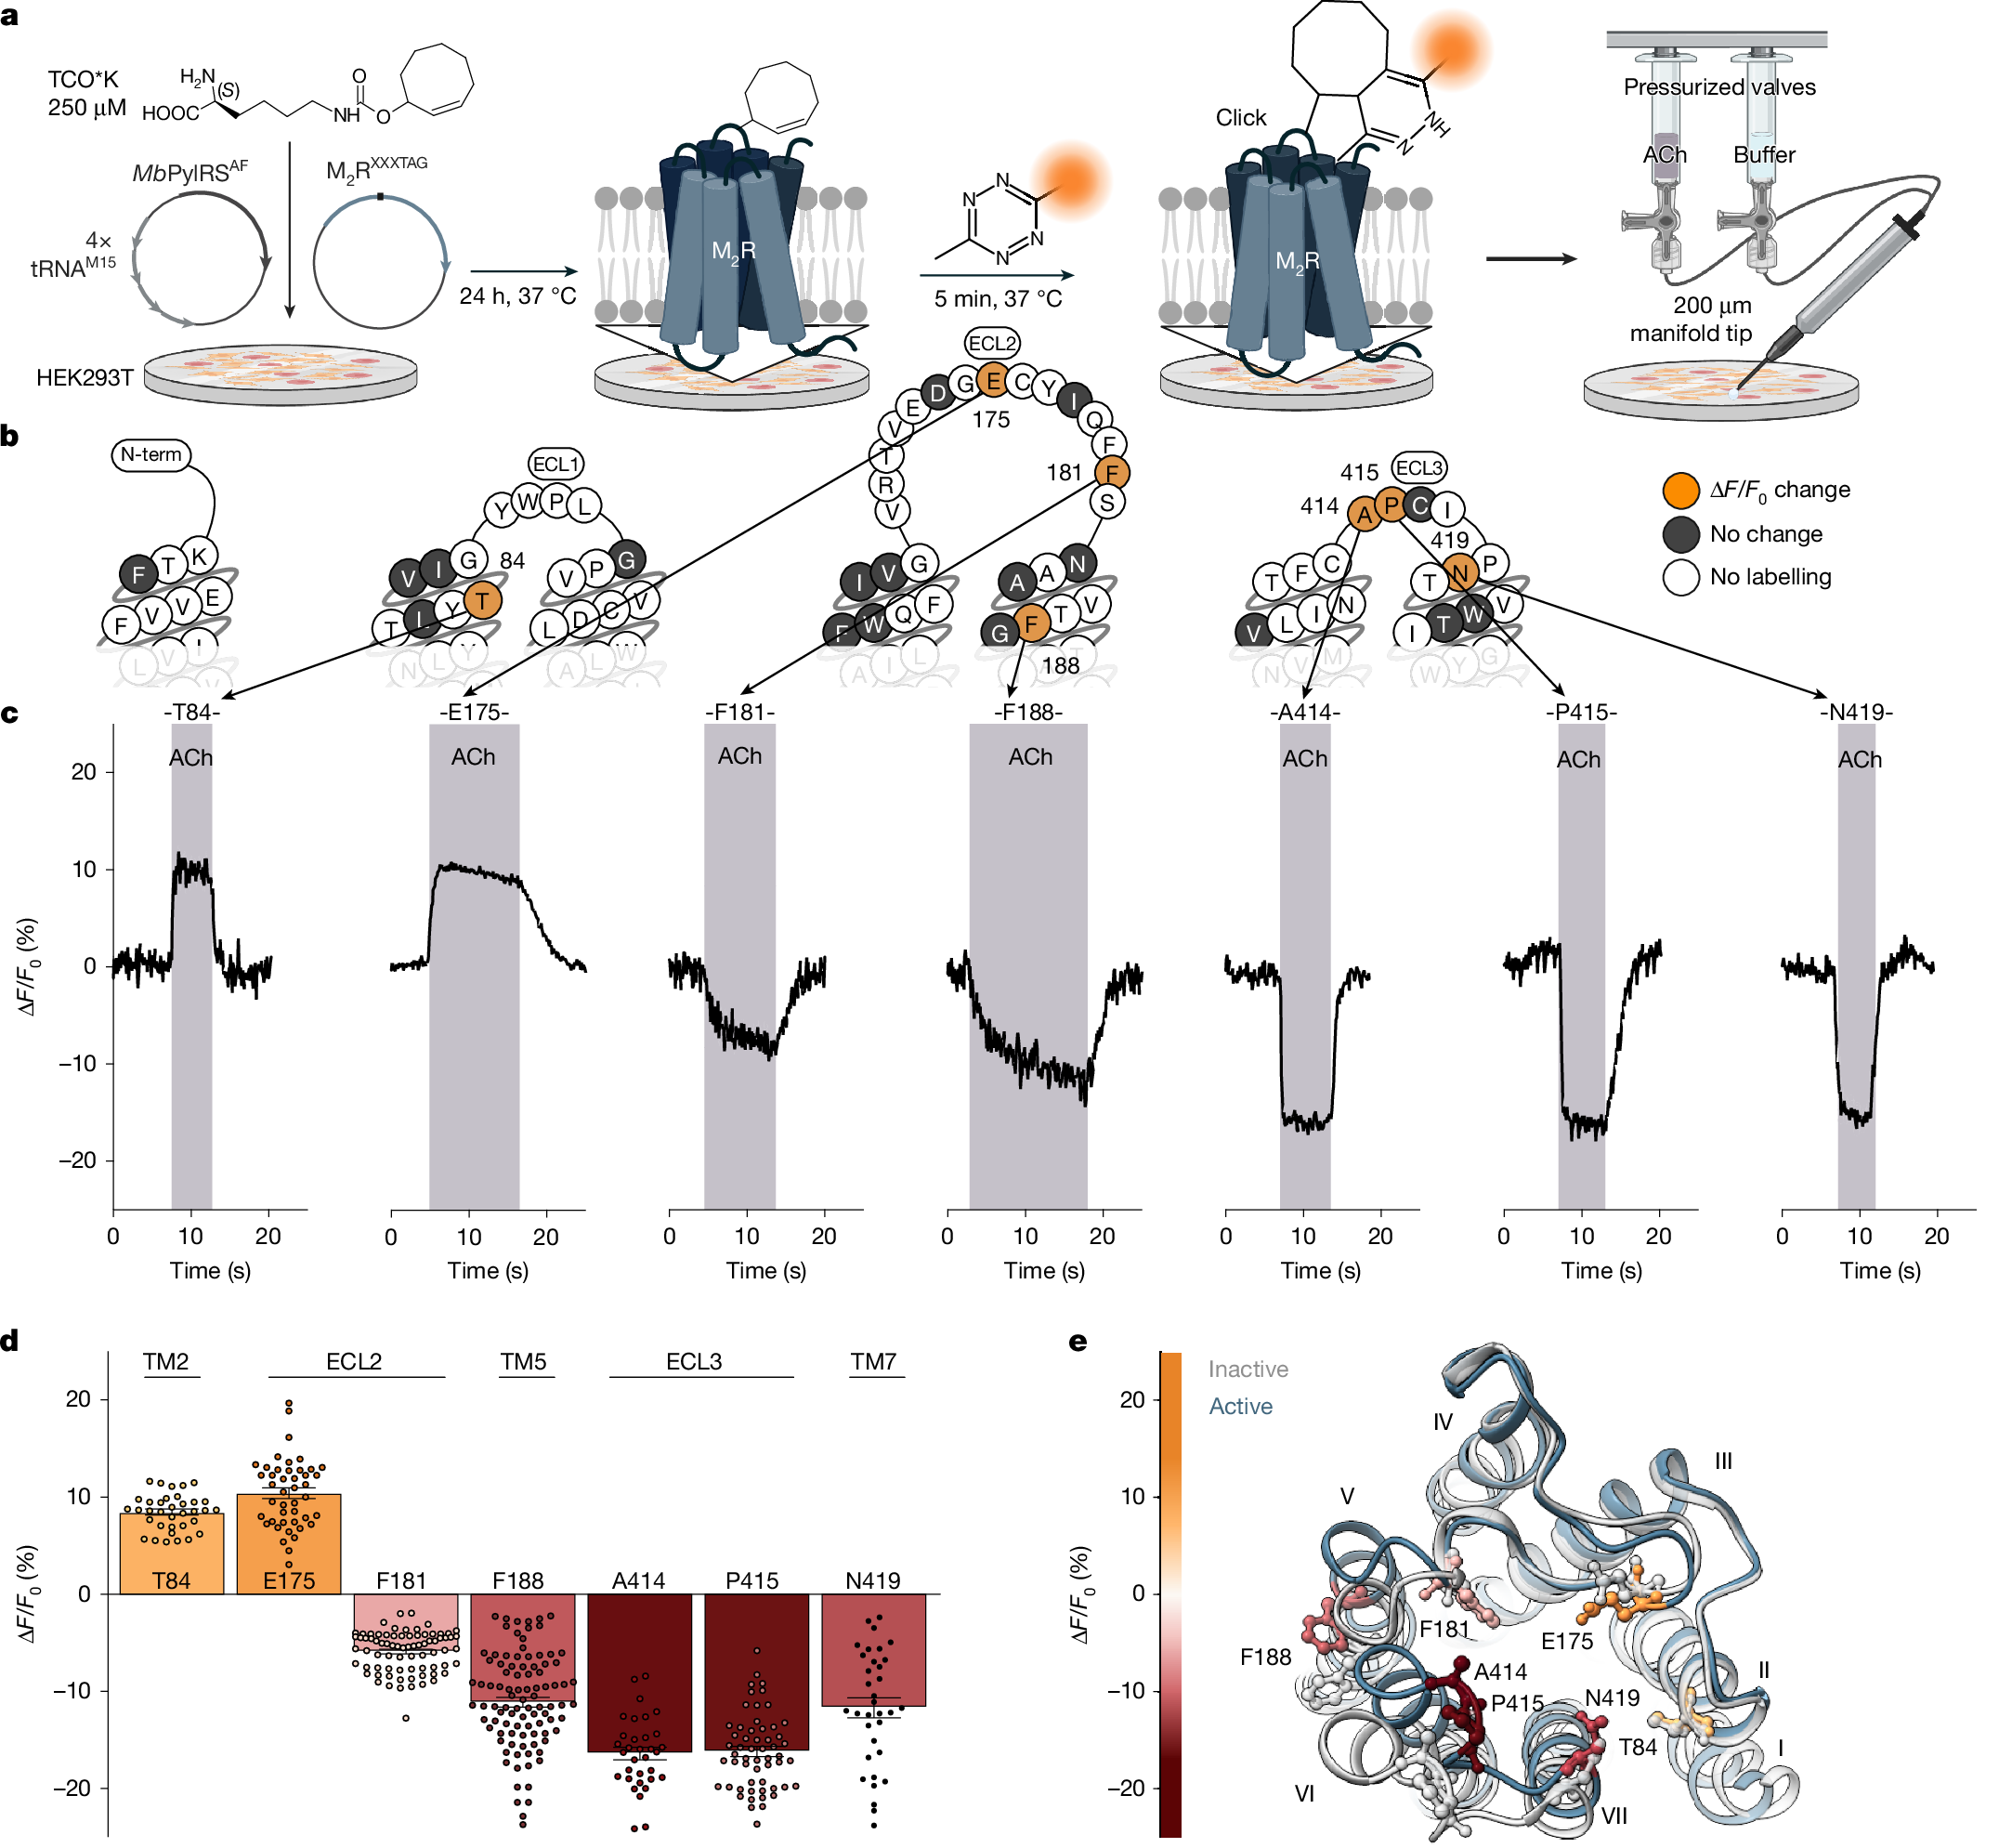
a, Genetic incorporation of a ncAA (TCO*K) and bioorthogonal labelling of M2R with Tet–Cy3 (Methods). Cells expressing biosensors are stimulated by continuous pressurized application of agonist (ACh) or buffer through a manifold tip. Created in BioRender. Thomas, R. (2025) https://BioRender.com/loxqlqf. b, Snake plot of M2R indicating all positions that were robustly labelled (orange and grey) and showed activation-related changes in fluorescence intensity (orange). The numbers are the residue numbers. Positions that could not be labelled are indicated in white. ECL1, extracellular loop domain 1; ECL2, extracellular loop domain 2; ECL3, extracellular loop domain 3. c, Representative changes in fluorescence intensity (ΔF/F0) were recorded over time from several individual HEK293T cells expressing M2R biosensors labelled at the indicated amino acid positions. Cells were superfused with 1 mM ACh. The shaded areas indicate the duration of agonist addition, and the unshaded areas indicate agonist washout with buffer. d, Mean fluorescence intensity changes (ΔF/F0) of all seven agonist-sensitive biosensors after activation with 1 mM ACh. Positive values indicate an increase in fluorescence; negative values indicate a decrease after ACh superfusion. Data are mean ± s.e.m., with each datapoint representing a single cell. M2R84 (35 cells examined over 17 independent experiments), M2R175 (44, 11), M2R181 (76, 9), M2R188 (96, 15), M2R414 (33, 7), M2R415 (56, 9), M2R419 (34, 12). TM2, transmembrane domain 2; TM5, transmembrane domain 5; TM7, transmembrane domain 7. e, Top view of the X-ray crystal structure of the active M2R (blue; Protein Data Bank (PDB): 4MQS). The positions of incorporated TCO*K yielding GPCR biosensors are colour coded according to the gradient, representing the mean ACh-induced changes in fluorescence intensity (ΔF/F0). For comparison, the X-ray crystal structure of the inactive M2R (PDB: 3UON) is shown in grey. The roman numerals indicate the number of the transmembrane helix. The constructs used were SP-M2RXXXTAG (Methods).
Next, we applied the endogenous M2R agonist acetylcholine (ACh) to single cells expressing one labelled construct each using a superfusion device (Fig. 1a). Seven of the 25 Cy3-TCO*K-M2R constructs exhibited robust and reproducible changes in their fluorescence emission intensities (Fig. 1c,d), therefore serving as reporters for M2R activation. We quantified the labelling efficiency at these M2R biosensors using fluorescence correlation spectroscopy40,42. Four M2R biosensors showed quantitative Cy3 labelling (positions Thr84 (M2R84), Glu175, Ala414 and Pro415) and three reached labelling efficiencies of 60–80% (positions Phe181, Phe188 and Asn419; Extended Data Fig. 1). Importantly, all seven M2R biosensors robustly activated G proteins and internalized after ACh exposure, indicating full functionality (Extended Data Fig. 2). Notably, labelling position Ala414 with either the rhodamine dye TAMRA or the cyanine dye Cy5 also resulted in M2R activation biosensors (Supplementary Fig. 3).
Cyanine fluorophores such as Cy3 are environmentally sensitive23,42,43. We propose that the observed fluorescence changes arise from local microenvironmental changes (such as transitions to either more hydrophobic or to more polar microenvironments) caused by ligand-promoted receptor conformational changes. Mapping the position of ACh-sensitive labels onto high-resolution structures of the inactive and active M2R (Fig. 1e) shows that all positions featuring ACh-promoted fluorescence changes lie in extracellular receptor domains that move during receptor activation37,38,39. All seven biosensors retain the ability to respond to the positive allosteric modulator LY2119620 (ref. 38), which binds at the extracellular allosteric binding site (Extended Data Fig. 3). Thus, we infer that the M2R biosensors report on activation-related conformational changes of the receptor. Supporting this, binding of the antagonist N-methylscopolamine did not induce fluorescence changes at any of these positions (Extended Data Fig. 2).
ACh-stimulated fluorescence changes varied in both direction (fluorescence increase or decrease) and amplitude (ΔF/F0, −16% to +10%) (Fig. 1c,d and Supplementary Table 1). All changes were strictly dependent on the presence of ACh and returned to the baseline after ACh washout (Fig. 1c). Moreover, ACh-mediated changes in fluorescence were also concentration dependent, with potencies matching reported ACh affinity values (around 1–6 µM; Extended Data Fig. 4), which further supports the specificity of the observed effects.
Ligand-unique conformational states of the M2R
The M2R biosensor panel enables monitoring receptor conformational changes across the entire extracellular surface (Fig. 1e) while leaving the intracellular domains, which couple to G proteins, untagged. This makes it an ideal tool for investigating the existence of distinct, ligand-specific GPCR active states and their coupling to G proteins in intact cells. To study agonist effects, we selected M2R agonists differing in their reported efficacies in classical pharmacological assays: the endogenous full agonist ACh, the superagonist iperoxo39,44,45,46, and the partial agonists arecoline and pilocarpine. All of the agonists stimulated G-protein activation at all seven biosensors in a concentration-dependent manner, similar to wild-type (WT) M2 receptors (Extended Data Fig. 5). We noted that higher agonist potency tended to correlate with a smaller dynamic range of the functional response (Extended Data Fig. 4i). This would be compatible with the notion that some biosensors might display slightly different spontaneous activity compared with WT M2 receptors. Only at the M2R181 biosensor were all of the agonists less potent and less efficacious. Nonetheless, the rank order of agonist potencies and efficacies at all biosensors matched WT receptors (Extended Data Fig. 5 and Supplementary Table 2). This demonstrates that conformational data obtained with the panel of biosensors can be projected to WT receptors.
Stimulation of the M2R biosensor family with a saturating concentration of iperoxo changed fluorescence emission at six out of the seven ACh-responsive M2R biosensors (Fig. 2 and Extended Data Fig. 6). Compared with ACh, iperoxo produced larger responses at five biosensors (M2R84, M2R175, M2R414, M2R415 and M2R419), but smaller fluorescence changes at the M2R188 biosensor. Notably, the M2R181 biosensor did not respond at all (Fig. 2a,b and Extended Data Fig. 6) at any of the sequences of agonist addition (Supplementary Fig. 4). Absolute ΔF/F0 amplitudes after iperoxo exposure (Fig. 2b and Supplementary Table 1) were normalized to ACh at each M2R biosensor and plotted in a radar plot (Fig.