Sparse-to-dense coding transformation between hippocampal areas CA3 and CA1
Abstract
The hippocampus is crucial for spatial memory and navigation. It contains place cells1,2,3,4,5,6,7: spatially selective neurons found in areas CA1 and CA3—two distinct hippocampal subregions with substantially different anatomical connectivity8. Previous studies have found highly similar spatial coding between CA1 and CA3 place cells3,9,10,11. This raises the question of why two subregions that form consecutive processing stages would exhibit identical neural coding. Here we hypothesized that the lack of differences between CA1 and CA3 spatial coding is due to the experimental paradigm: using small arenas. We tested this hypothesis by simultaneously recording from CA1 and CA3 neurons in bats flying in flight tunnels up to 200 m in length. We identified highly distinct neural coding in CA1 and CA3: whereas CA1 neurons exhibited dense spatial coding, consisting of multiple place fields12, CA3 neurons exhibited ultrasparse spatial coding, consisting predominantly of single place fields. Despite this marked difference, the sizes of place fields were very similar between the two subregions, across 5 different environment sizes ranging from 6 m to 200 m. Using a neural-network model, we show that such a sparse-to-dense transformation can facilitate fast learning of new spatial maps. We also found that in a large multicompartment environment, place cells were strongly modulated by trajectory history—a contextual effect (retrospective coding) that could last for over 100 m. Together, by using large naturalistic environments, we identified a CA3-to-CA1 coding transformation that serves to reformat spatial information into a more efficient, compressed neural code.
Distinguishing examples while building concepts in hippocampal and artificial networks
The perforant pathway and CA3-Schaffer collateral afferents coordinate to regulate spatial learning
Mechanisms of experience-dependent place-cell referencing in hippocampal area CA1
Main
Navigation and spatial memory are vital abilities for the survival of animals in natural environments. The hippocampal formation has a key role in these spatial functions, and it contains several types of spatial cells—neurons whose activity is correlated with the animal’s position in space, which together form an elaborate cognitive map of the environment13,14,15,16. One of these spatial cell types is place cells, which are found in the hippocampus. In small environments, these cells are typically characterized by a high firing rate when the animal passes through a single confined location in space—termed the place field—and a much lower activity outside this field1,2,3,4,5,6,7.
The hippocampus comprises several distinct subregions that contain place cells, including areas CA1 and CA3. Area CA3 lies upstream of CA1 and projects heavily to CA1 (refs. 8,17). These two subregions differ markedly in their anatomical connectivity: area CA1 contains little intrinsic excitatory connections, while area CA3 has strong recurrent connectivity, and CA1 also functions as a major output from the hippocampus to the subiculum and cortex, while CA3 does not8,17,18,19. Despite these fundamental differences in anatomical connectivity, the basic spatial coding properties of place cells in CA1 and CA3 in small experimental setups are very similar, consisting mainly of single place fields with similar field sizes and spatial information3,9,10,11. Major differences between CA1 and CA3 were reported regarding their remapping properties when the environment is changed3,4,20,21, as well as differences in long-term stability of place fields22,23,24,25, but in small stable environments, the basic neural coding of space seems to be rather similar between these two areas. Some studies have reported small differences in place-fields sizes, firing rates or fraction of place cells between CA1 and CA3 (refs. 3,10,11,26,27,28); however, overall, these differences were rather small, especially considering the substantially different anatomy of these two areas. While both CA1 and CA3 place cells exhibit single place fields in small environments11, one study—which investigated the spatial representations of CA1 and CA3 place cells in rats exploring a larger environment (1.8 m × 1.4 m box)—showed a slightly larger number of place fields per neuron in both regions, but did not find a difference between the two subregions in terms of the number of place fields or their field sizes26. Another study29 recorded CA3 place cells in rats running on a larger linear track (18 m) and found mostly single place fields, but this study did not record in CA1, and therefore no direct comparison was available between the two subregions. Collectively, on the basis of rodent experiments that directly compared place cells in CA1 and CA3, no substantial differences have been found thus far in the basic neural-coding properties between the two brain areas. This presents the question of why the hippocampus contains two consecutive processing stages, CA3 and CA1, with a highly different anatomy but very similar neural coding of space.
We posited that this conundrum arises because thus far, CA1 and CA3 place cells were directly compared only in relatively small environments—and we hypothesized that in more naturalistic spatial scales of hundreds of metres or kilometres, fundamental differences may be revealed between spatial coding in CA1 and CA3. In our previous work12, we recorded CA1 neurons in flying mammals (Egyptian fruit bats) as they were flying in a 200-m-long tunnel and found that CA1 place cells exhibited multiple place fields with varying sizes for different fields of the same neuron (multiple fields in CA1 were also shown in rodents navigating a large environment30). This multifield multiscale spatial code is fundamentally different from the single-field code observed in CA1 of bats and rodents in small laboratory environments. However, thus far, no recordings have been conducted in CA3 in such large environments with ecological spatial scales. Here we recorded simultaneously from both CA1 and CA3 place cells in bats flying in long flight tunnels (130, 180 and 200 m) and in shorter tunnels (6 and 15 m). Similar to rodent studies, in the smaller environments, we found no difference in spatial coding between CA1 and CA3: place cells in both regions exhibited single place fields with similar field sizes. By contrast, we found a major difference between CA1 and CA3 place cells in the large-scale environments. In contrast to CA1 place cells, CA3 place cells predominantly exhibited only single place fields in the long tunnel. Overall, our results demonstrate a sparse-to-dense coding transformation between hippocampal subregions CA3 and CA1. Moreover, in a large multicompartment environment, we found a memory effect in the neural coding, which was more robust in CA1 than in CA3. These fundamental neural-coding differences between these two hippocampal subregions—revealed here by using very large environments—suggest distinct functional roles for CA1 and CA3 in real-world, large-scale ecological settings.
Sparse CA3 coding versus dense CA1 coding
We trained bats to fly back and forth in a long flight tunnel: 130, 180 or 200 m in length (Fig. 1a and Extended Data Fig. 1a,b; each bat was tested in one tunnel length). The bats flew between two spherical landing-platforms (balls) positioned at the two ends of the tunnel, where the bats could land to receive food and rest. After training, we used a wireless neural logger to record neurons from dorsal CA1 and dorsal CA3 in five bats flying in the long tunnel, and an additional nine bats with only dorsal CA1 recordings (Fig. 1b,c, Methods and Extended Data Table 1). Overall, we recorded 810 putative pyramidal neurons from dorsal CA1 of 14 bats, and 457 putative pyramidal neurons from dorsal CA3 of five bats. Place cells comprised 76.3% and 58.6% of the pyramidal neurons in CA1 and CA3, respectively, exhibiting significant spatial tuning and distinct place fields (nCA1 = 618 out of 810 and nCA3 = 268 out of 457 were place cells; numbers were pooled across the three large environments; significant place cells were defined on the basis of spatial information compared to spike shuffles; Methods). We analysed the neuronal data separately for each flight direction, because the firing-rate maps of place cells are independent between two movement directions in linear environments12,31.
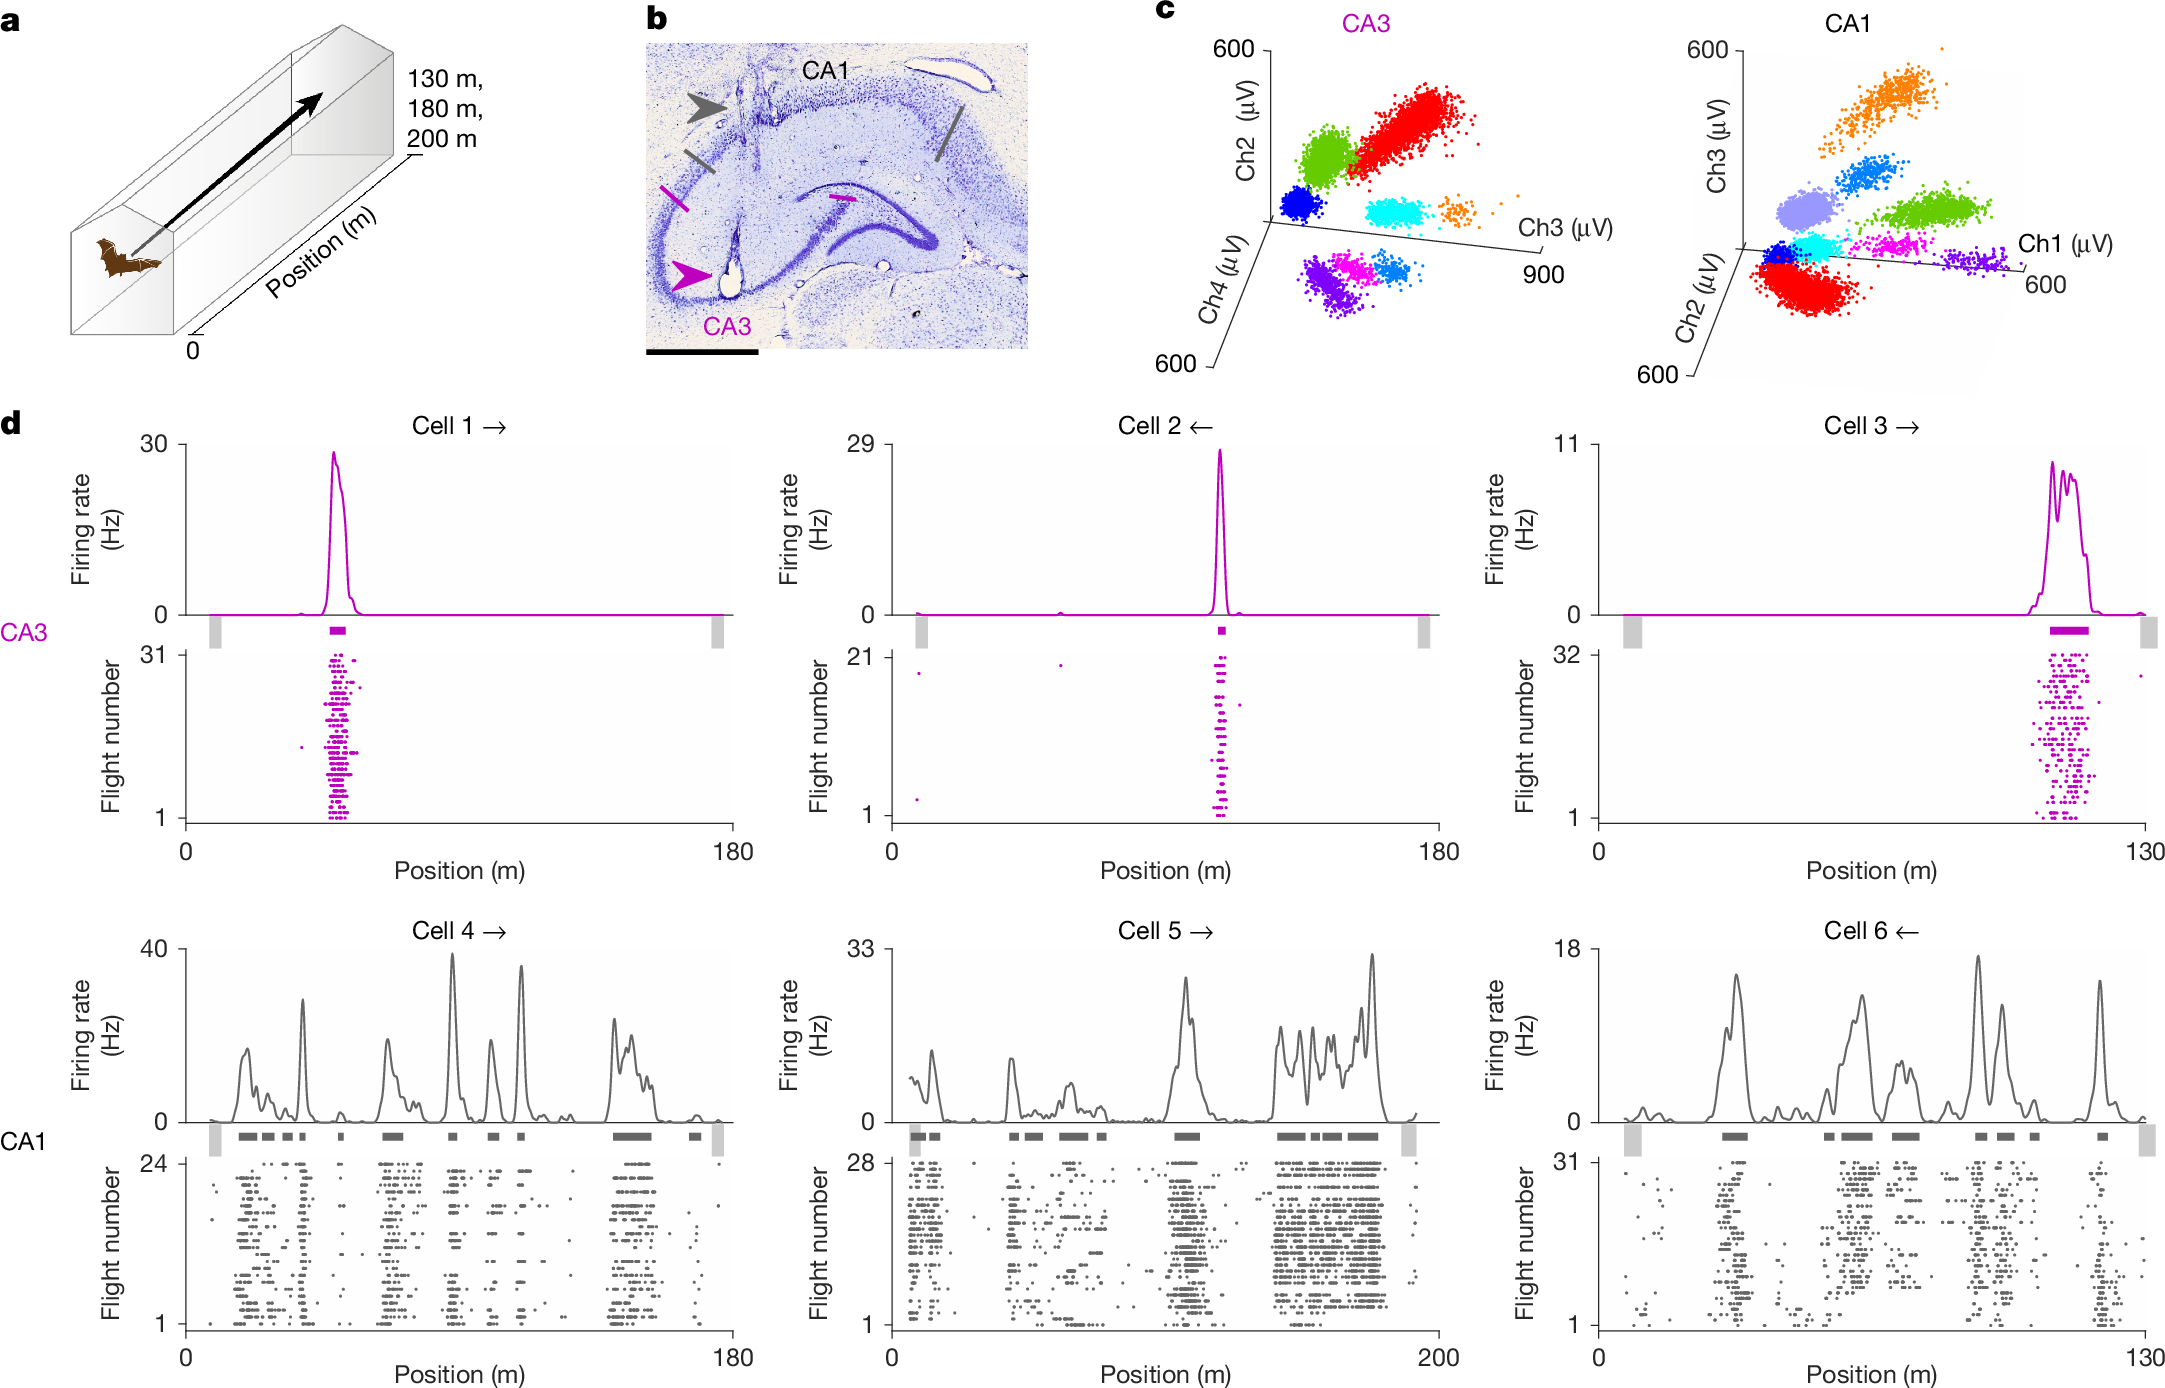
a, Experimental setup. Bats flew in a very long linear tunnel with a length of 130, 180 or 200 m. We also recorded from bats flying in smaller tunnel segments: 6 or 15 m. Illustration: G. Brodsky. b, Coronal section through the dorsal hippocampus of bat 2, in which we recorded in both CA1 (the grey arrowhead indicates tetrode tracks) and CA3 (the purple arrowhead indicates an electrolytic lesion). Scale bar, 1 mm. The lines indicate the approximate anatomical borders of CA1 (grey) and CA3 (purple). Overall, five bats had simultaneous recordings in both CA1 and CA3, and an additional nine bats had recordings in CA1 only. c, Spike sorting of two tetrodes, one in CA3 (left) and one in CA1 (right) (data from full recording sessions: 63 and 67 min). Shown are spike clusters of different well-isolated neurons (colours), with spike amplitudes plotted for three of the tetrodes’ four channels (Ch1–4). d, Examples of six cells: three in CA3 (top, purple) and three in CA1 (bottom, grey). For each cell, shown are firing-rate maps (top; bin size, 20 cm) and spike-raster plots (bottom); the flight direction is indicated by an arrow. Detected place fields are denoted by thick horizontal lines above the raster plots. The light grey vertical bars indicate zones with low flight speed (take-off or landing). Additional examples are shown in Extended Data Fig. 2.
Consistent with our previous report12, CA1 place cells in the long tunnel exhibited multiple place fields per direction, with varying field sizes (examples are shown in Fig. 1d, bottom row, and Extended Data Fig. 2b; population: Fig. 2a,b, grey). In contrast to CA1 place cells, the large majority of CA3 place cells exhibited spatial firing-rate maps with a single field (examples are shown in Fig. 1d,top, and Extended Data Fig. 2a; population: Fig. 2a; compare the number of fields in CA3 (purple) versus CA1 (grey); the distributions for individual bats are shown in Extended Data Fig. 3). Specifically, 73.7% (250 out of 339) of the significant place cells × directions in CA3 had a single field, compared with only 29.6% (292 out of 986) in CA1. Moreover, many CA1 place cells had 5 or even ≥10 fields (31.9% (197 out of 618) had ≥5 fields in at least one direction)—indicating multifield firing, which almost never occurred in CA3 (Fig. 2a; only 0.7% (2 out of 268) of CA3 place cells had ≥5 fields). This difference in the number of place fields was highly significant across the recorded population of CA1 and CA3 neurons (Fig. 2a, bottom; Wilcoxon rank-sum test, P = 4 × 10–56)—in each of the three different large-scale tunnels (see the individual bats and tunnels in Fig. 2a, top, and Extended Data Fig. 3a). These findings could not be explained by differences in spike-sorting quality between CA1 and CA3 (Extended Data Fig. 4j–l). Despite this marked difference in the number of place fields, the sizes of place fields were almost identical between CA1 and CA3: both areas exhibited a similar log-normal distribution of field sizes (entire population: Fig. 2b, bottom; Wilcoxon rank-sum test, P = 0.66; see Fig. 2b, top, and Extended Data Fig. 3b for individual bats). Peak firing rates per map were also similar between CA1 and CA3 (Extended Data Fig. 4a). Firing-rate maps in bothCA1 and CA3 were highly stable (Fig. 2c; median correlations, r = 0.78 in CA1 and r = 0.86 in CA3; assessed via Pearson correlation between firing-rate maps in first versus second half of the session; see Extended Data Fig. 4c, top, for stability for odd versus even flights, which yielded similar results; note that the difference in stability between CA1 and CA3 (Wilcoxon rank-sum test, P = 8 × 10⁻⁹) was not a by-product of the denser CA1 coding (Extended Data Fig. 4d)). CA3 place cells exhibited much higher spatial information than CA1 place cells (Fig. 2d; P = 10–72), as well as lower spatial coverage (Fig. 2e; P = 9 × 10–31) and sparser firing-rate maps (P = 7 × 10–59; Fig. 2f and Extended Data Fig. 3c–e). Past studies in rodents have reported higher spatial information, higher stability and lower spatial coverage in CA3 than in CA1 (refs. 10,11); however, these previously reported differences were very small compared with the large diff