Distinct genetic architecture in the tails of complex traits
Abstract
Complex traits are highly polygenic, with heritability explained by many hundreds of common variants of small effect together with rare variants of large effect1. Yet how this genetic architecture varies along the trait continuum has been underexplored, as has the role of natural selection in shaping this variation. Here we developed an approach based on polygenic risk scores that reveals widespread departures from common-variant architecture in one or both of the tails of 74 quantitative traits. These observations were replicated across ancestries, cohorts and repeated measures and using an alternative family-based approach2. Incorporating rare variants identified from sequence data resulted in marked reductions in these deviations, suggesting that rare alleles of large effect are key drivers of trait-tail architecture. Forward simulations showed that stabilizing selection could generate the observed patterns, whereas modelling reproductive success provided empirical support for the role of selection. These findings show that although complex traits are polygenic in the population at large, they have a distinct and less polygenic architecture in their tails due to selection. This has implications for rare-variant discovery and complex trait and disease prediction.
Polygenic architecture of rare coding variation across 394,783 exomes

Integrating common and rare variants improves polygenic risk prediction across diverse populations
Capturing additional genetic risk from family history for improved polygenic risk prediction
Main
The number of genetic variants identified by genome-wide association and sequencing studies is now so large that a complete picture of the genetic architecture of many complex traits is starting to emerge1,3. Illustrating all known variants for a complex trait or disease on a spectrum of allele frequency versus effect size produces a characteristic ‘trumpet’ shape4,5, in which rarer alleles have increasingly larger effects owing to stabilizing selection6. These effects are sometimes so large relative to those of common alleles that they cause extreme trait values on most genetic backgrounds. For example, mutations in ACAN usually result in short stature, those in LEP cause leptin deficiency, and those in HNF1A produce large deviations in glucose homeostasis7,8,9. Moreover, Fiziev et al. found that their PrimateAI-derived rare-variant polygenic risk scores (PRSs) were particularly predictive for individuals with phenotypic extremes10 and rare alleles with marked effects on complex disease have also been identified11,12.
Given the importance of natural selection in shaping the joint distribution of allele frequency and effect size (Fig. 1a,e), the relative contribution of common and rare variants may vary across the trait continuum according to historical selective pressures. Consequently, we would expect selection-dependent variation in the distribution of heritability (Fig. 1b,f), of PRSs (Fig. 1c,g) and of trait similarity within families (Fig. 1d,h) across the trait continuum. In practice, selective pressures vary over time, so a trait broadly subject to stabilizing selection may have also undergone intermittent periods of directional selection towards new optimal values as environments changed13. Moreover, complex traits are highly pleiotropic, meaning that selection on most variants is integrated over multiple traits14. Nonetheless, a range of realistic forms of selection on human complex traits may be expected to produce broadly similar patterns, albeit with variation in magnitude and symmetry across the trait distribution.
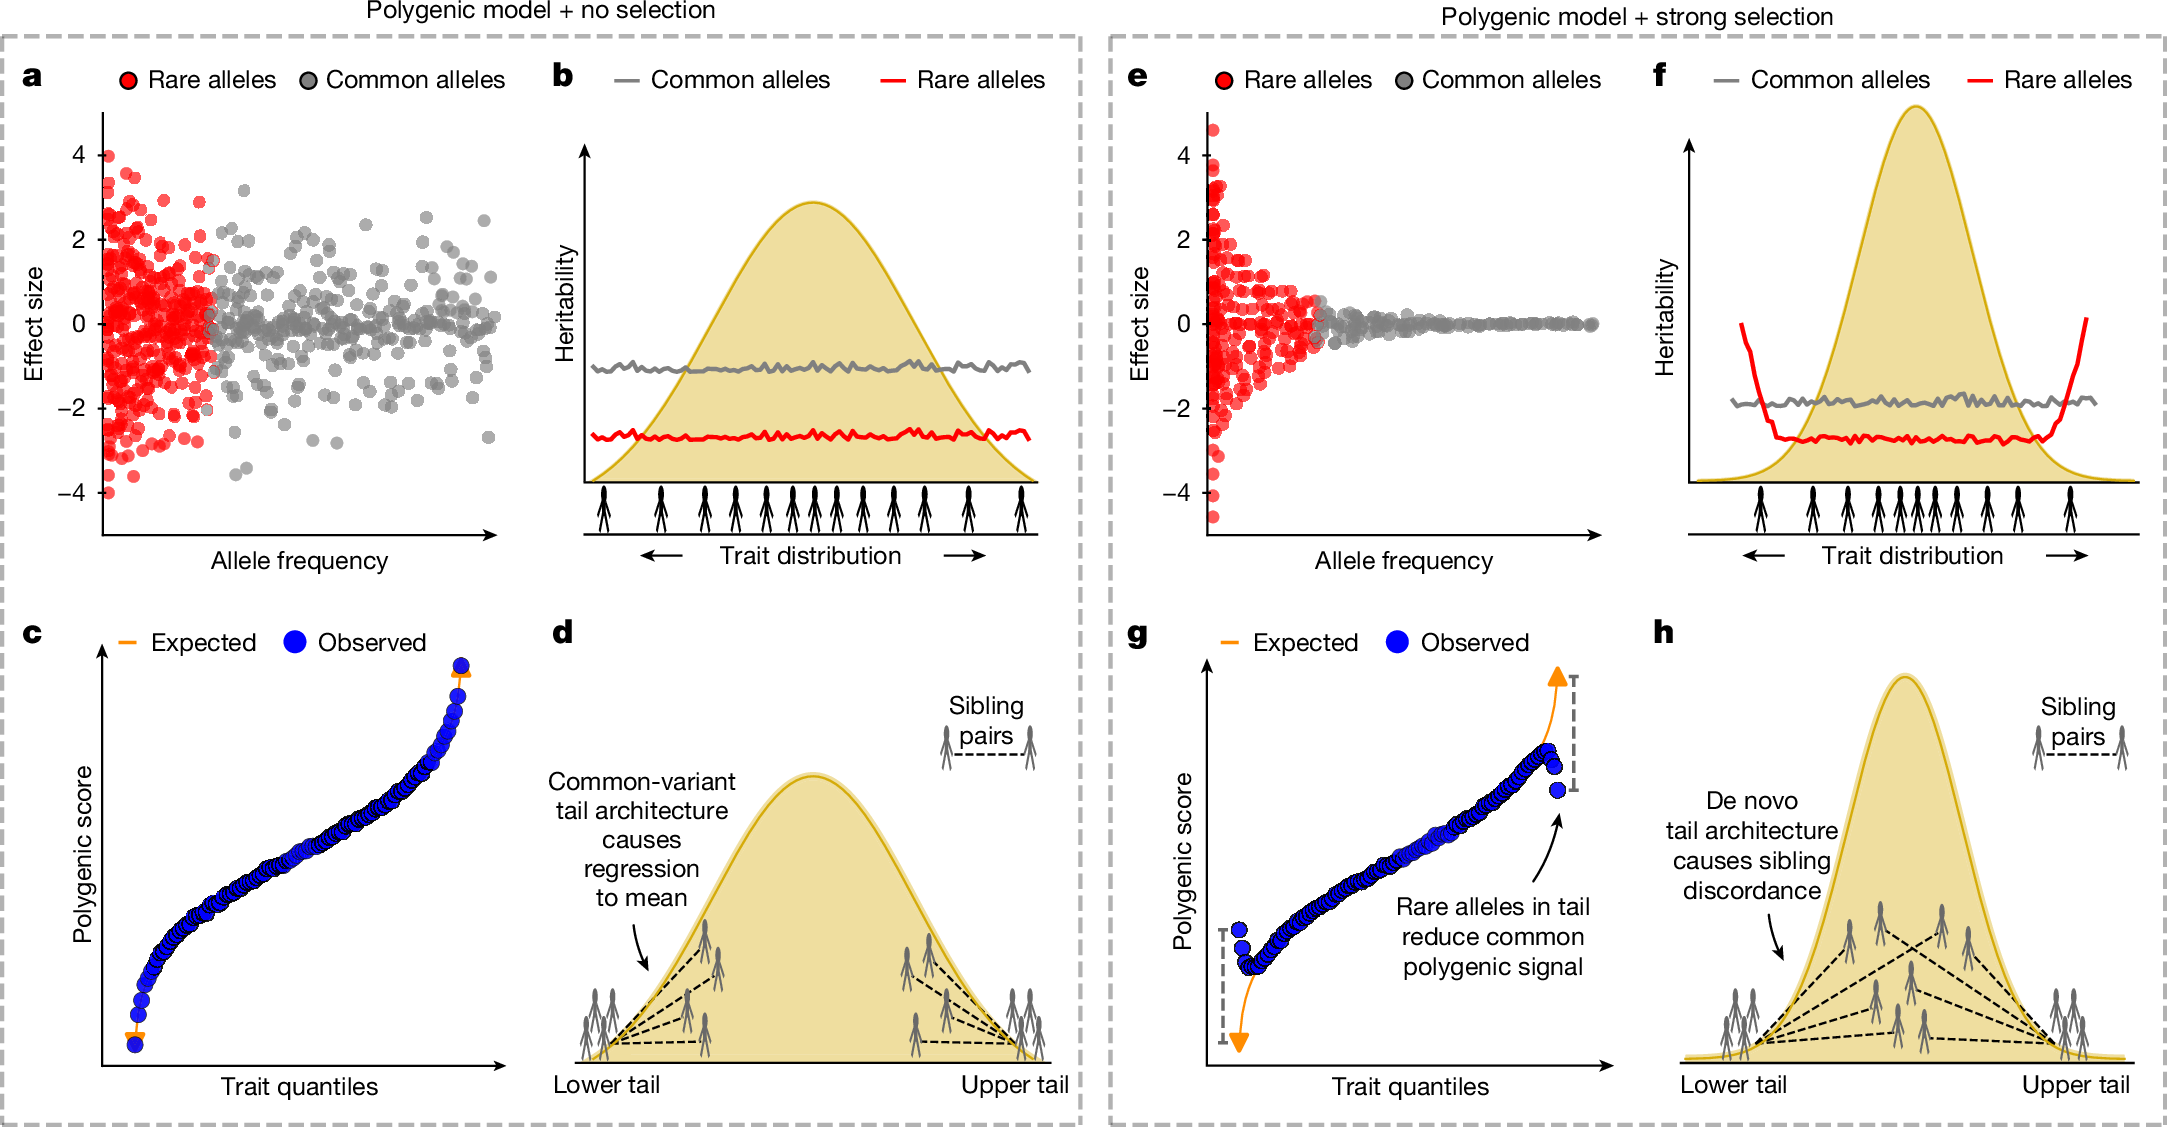
a–d, In the polygenic model with no selection: the minor allele frequency (MAF) and effect size of variants affecting the trait are uncorrelated (a); common and rare variants are uniformly distributed across the trait continuum and common variants explain more heritability (b); the trait and common-variant polygenic score have a linear relationship (c); and siblings of individuals in the tails of the trait distribution also show low/high trait values, with regression to the mean to an extent dependent on trait heritability (d)2. In this model, common-variant architecture predominates the entire trait distribution. e–h, In the polygenic model with strong selection (here, stabilizing selection): there is a strong negative exponential relationship between MAF and effect size (e); common variants explain more heritability overall, but rare variants contribute more in the tails (f); the common-variant polygenic score regresses to the mean in the trait tails owing to large-effect rare alleles not included in the polygenic score (g); and under selection so strong that tails are characterized by de novo architecture, siblings of individuals in the trait tails have trait values drawn from the background distribution (h). In this model, common-variant architecture predominates in the body of the trait distribution, whereas rare-variant architecture prevails in the tails. These models illustrate two extremes of selection that are unrealistic in practice, but most complex traits should have genetic architecture that varies across the trait continuum in a manner between these two extremes.
On the basis of the existence of rare alleles that can alone generate extreme trait values, as well as growing evidence that stabilizing selection is a pervasive driver of complex trait architecture6,15,16, we proposed that stabilizing selection on some traits may have been sufficiently strong to have produced marked enrichments of rare alleles of large effect in their tails. The magnitude of such enrichments would depend on the number, effect sizes and frequencies of these alleles across the genome, whereas their symmetry would depend on the relative contributions of stabilizing and directional selection in recent history. Motivated by the expected differences in genetic architecture across traits subject to different forms and strengths of selection (Fig. 1), we used two complementary approaches to test for tail-specific departures from common-variant architecture: first, we introduced the PRS-on-phenotype outlier test (POPout), which evaluates whether PRS values in the lower and upper tails depart from a linear relationship fitted across the trait–PRS distribution; and, second, we extended a previously developed family-based framework2 to derive STANDout, a test based on differences between individuals in the tails and their siblings, to detect rare-variant tail architecture. We applied these methods to 74 quantitative traits from the UK Biobank (UKB), tested generalizability by replication across repeated measures, multiple ancestries and the All of Us Research Program, and then assessed direct evidence for the role of rare variants using whole-exome sequencing (WES) and whole-genome sequencing (WGS) data. Finally, we tested whether selection could generate the observed signals using forward simulations17 and empirical inference of selection from lifetime reproductive success16. Our findings reveal distinct genetic architecture in the tails of complex traits, highlight the role of selection in the causes of phenotypic extremes, and suggest strategies for increasing the discovery of rare variants and improving the accuracy of complex trait and disease prediction.
Widespread POPout effects
We analysed quantitative traits in the UKB18, covering a broad range of blood biomarkers and physical, cognitive and behavioural measures. After quality control (QC) to ensure, for example, adequate heritability, polygenicity and normality of the traits, 74 traits were selected for analysis (Methods). To limit the contribution of environmental factors, we residualized traits for relevant covariates and removed individuals who were diagnosed with cancer, were on statins or insulin medication, or were pregnant. The primary analysis included up to 369,132 individuals of European ancestry. For each trait, we performed genome-wide association studies (GWAS) in half the sample and computed common-variant PRSs in the other half, and then tested for tail-specific deviations in PRSs using POPout (Methods). This design separates discovery from scoring while retaining sufficiently large tail sample sizes.
POPout inverts standard PRS analyses19: instead of evaluating how phenotype varies across PRS quantiles20,21, POPout tests how PRS varies over phenotype quantiles, providing insight into variation in genetic architecture across the trait distribution. Under a null model in which common-variant architecture predominates the entire distribution, PRS should increase linearly with phenotype. Under a model in which high-effect rare alleles concentrate in the tails, individuals with extreme phenotypes will, on average, carry fewer common risk alleles than expected for their phenotype, producing regression of common PRS towards the mean in the tails. We quantify this deviation by testing whether PRS residuals in the lower and upper tails differ from expectations on the basis of a regression fit over the entire trait distribution, after verifying calibration in the body of the distribution (Methods). In primary analyses, the POPout test was applied to the lower and upper 1% tails (see description of sensitivity analyses), which balances extremeness with statistical power while reflecting prevalence rates of complex diseases.
Four ‘index traits’ provided examples of the observed POPout effects (Fig. 2a). Phosphate closely followed linear expectations, with negligible POPout effects. By contrast, red blood cell distribution width exhibited a pronounced upper tail effect (effect size of approximately 0.50 Z units), whereas haemoglobin concentration exhibited a pronounced lower tail POPout effect (approximately 0.37). Sitting height showed strong effects in both tails, consistent with symmetric enrichment of rare alleles expected under stabilizing selection. These four index traits were selected because they provided clear illustrations of different types of relationship; they are not representative of the general results.
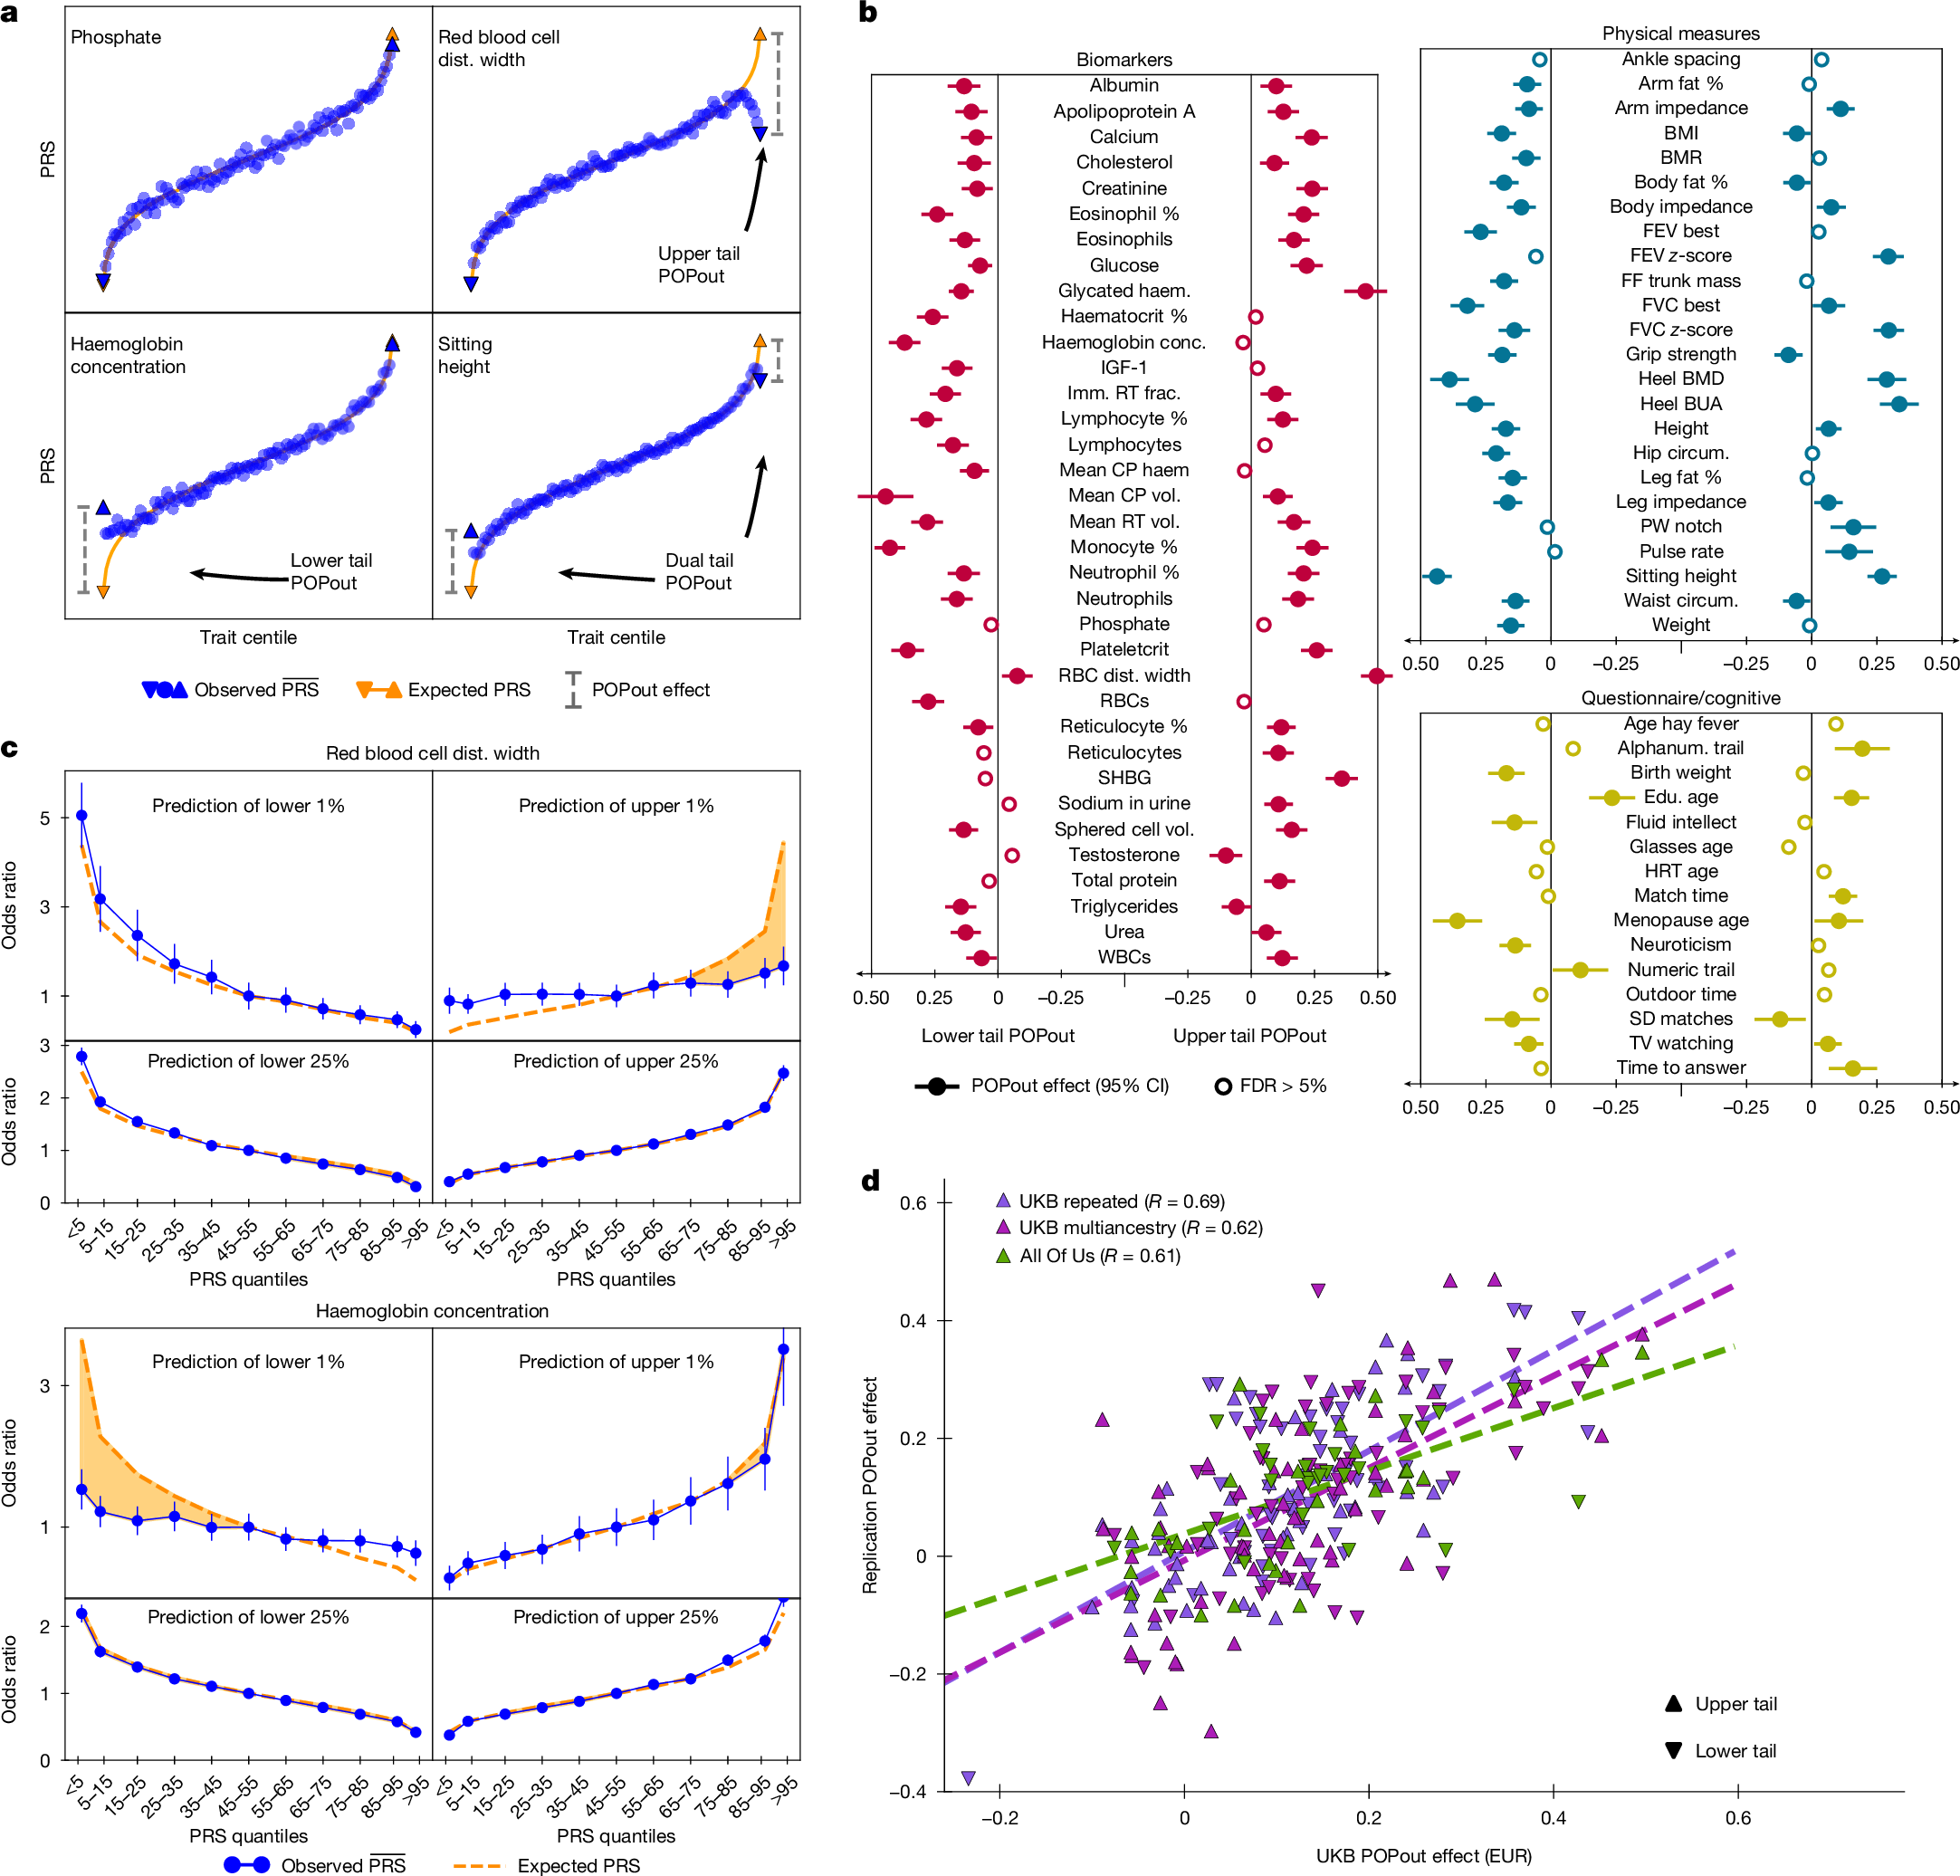
a, Trait centiles plotted against mean PRS value for four traits with different types of POPout effect. Expected PRS (orange) inferred from regression of PRS on trait (Methods). b, POPout effect sizes with 95% confidence intervals are shown for the 74 traits of the primary analysis, calculated using two-sided t-tests (Methods) with a mean of n = 127,083 UKB individuals of European ancestry per trait. c, Odds ratios (with 95% confidence intervals) calculated in n = 129,100 (red blood cell distribution width) and n = 129,416 (haemoglobin concentration) individuals from logistic regressions of a trait-related hypothetical disease on PRS quantile (index quantile versus central quantile), with disease defined as the lower or upper 1% (or 25%) tail (controls otherwise). The orange dashed line indicates expected performance assuming a linear relationship between the PRS and trait (the shaded area highlights the difference between expected and observed). d, POPout effect sizes from UKB European ancestry analysis (from b) plotted against POPout effect sizes in the replication cohorts for upper and lower tails of all overlapping traits that passed QC. Pearson correlation coefficients between UKB European ancestry cohort and the replication effect sizes of the 50 traits from the UKB repeated cohort (P = 1.26 × 10⁻¹⁵; mean n = 12,007 independent samples per trait), 55 traits from the UKB multiancestry cohort (P = 3.63 × 10⁻¹³; mean n = 17,407 independent samples per trait) and 27 traits from the All of Us cohort (P = 1.07 × 10⁻⁶; mean n = 53,196 independent samples per trait) are shown (Methods). Alphanum., alphanumeric; BMI, body mass index; BMD, bone mass density; BMR, basal metabolic rate; BUA, broadband ultrasound attenuation; circum., circumference; conc., concentration; CP, corpuscular; dist., distribution; edu., education; EUR, European ancestry; FEV, forced expiratory volume; FDR, false discovery rate; frac., fraction; FF, fat fraction; FVC, forced vital capacity; haem., haemoglobin; HRT, hormone replacement therapy; imm., immature; PW, pulse wave; RBCs, red blood cells; RT, reticulocyte; SD, symbol digit; vol., volume; WBCs, white blood cells.
Across the 74 traits, POPout showed widespread and often substantial departures from linear expectations in one or both tails (Fig. 2b). Sixty-eight traits showed significant POPout effects (false discovery rate < 5%) in at least one tail, most of which were positive effects, consistent with regression to the mean of the common PRS in extremes. In total, 108 trait tails were significant, with 98 showing positive POPout effects. This pattern of tail-specific architecture spanned trait domains, including blood cell indices, metabolic biomarkers, anthropometric measures, and behavioural and cognitive traits. The ten significant negative POPout effects could have resulted from epistatic, dominant or gene-by-environment effects, as more effect alleles than expected were associated with extreme values of these traits.
Sensitivity analyses across tail thresholds showed a consistent gradient (Extended Data Fig. 1). At 10% and 5% thresholds, fewer tails showed significant effects, and effect sizes were smaller (for example, mean effects of approximately 0.01 at 10%). At 0.5% and 0.1% thresholds, mean effects were larger (for example, approximately 0.18 at 0.5% and 0.33 at 0.1%), but fewer traits reached significance owing to reduced power. This suggests a biologically meaningful pattern, in which individuals whose trait value was driven by rare variants of large effect that were not captured by common PRSs, were increasingly likely to be found deeper in the tail.
Reduced PRS accuracy
POPout effects imply that common-variant PRSs often underperform in prediction of phenotypic extremes, and that the accuracy of PRSs for diseases underlain by phenotypic extremes will be likewise limited. To illustrate this, we emulated PRS prediction of hypothetical diseases defined by different phenotypic thresholds in the index traits (Fig.2c and Extended Data Fig. 2). The PRSs for red blood cell distribution width and haemoglobin concentration performed well when disease was defined by the lowest or highest quartile, but they underperformed markedly when disease was defined by the lowest or highest 1%. For red blood cell distribution width, the mean odds ratio for individuals with the top 5% PRS values was expected to be 4.1 according to a linear trait–PRS relationship, but it was in fact 1.8; for haemoglobin, the expected odds ratio in the lower tail was 3.7, whereas the observed value was 1.8. These gaps reflect what POPout quantifies: when the PRS regresses towards the mean in the tails, the distinction between cases (extreme individuals) and controls weakens, limiting prediction at the highest-risk end. Thus, even when common PRS distinguishes between individuals of modest risk well, it can have poor performance in exactly those individuals at the highest risk of disease and most severe outcomes, such as early-onset disease and rapid progression.
Replication of POPout effects
Here we performed three different forms of replication to test the generalizability of our primary findings, using our pretrained PRSs for each trait (Fig. 2d and Extended Data Fig. 3). In each replication analysis, which used samples independent of our primary analysis samples, we included only traits that passed our QC and had data for more than 5,000 individuals given inferred replication power (Methods). First, we tested UKB participants with repeated measures collected at baseline and follow-up (mean n = 12,007 individuals per trait). Averaging measures reduces the contribution of transient exposures such as short-term illness and medication use, as well as measurement error. POPout effect sizes in the repeated measures sample were strongly correlated with those of the primary analysis (R ≈ 0.69), suggesting robustness to transient environmental factors and measurement error.
Second, we performed a UKB replication in a held-out multiancestry sample (mean n = 17,407 individuals per trait). Despite the known challenges of PRS portability22,23, POPout effects were again strongly correlated with the primary analysis (R ≈ 0.62), indicating that tail deviations are a cross-ancestry phenomenon.
Third, we performed a matched-ancestry replication in individuals of European ancestry from the US-based All of Us cohort24 (mean n = 53,196 individuals per trait). This provided a stringent replication, because the cohort was recruited in a different healthcare setting on a different continent, using independent sampling, clinical and assay procedures. POPout effects were replicated with strong correlation (R ≈ 0.61) across overlapping traits. Together, these replications suggest that tail-specific departure from a linear trait–PRS relationship may be a stable and global feature of complex traits.
Tail architecture inferred from siblings
Whereas the population-based POPout method relies on genotype data and PRS construction, family-based analyses offer an orthogonal approach that is robust to several forms of population structure2. UKB includes more than 17,000 sibling pairs of European ancestry not used in our population analyses. We therefore applied STANDout, a joint test that aggregates evidence from sibling-based models designed to distinguish tail architectures driven by common variants, by rare variants or by de novo mutations (Methods).
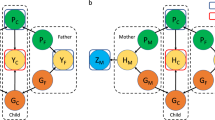
The key intuition is that differences among siblings for a trait are partly governed by the genetic architecture of the trait (Fig. 3a). Under common-variant architecture, siblings of individuals with extreme trait values are expected to have high but less extreme trait values, depending on heritability. Under de novo-dominated tail architecture, siblings resemble the population background, whereas under Mendelian-like tail architecture driven by large-effect segregating rare alleles, half the siblings share the large-effect allele and also have extreme trait values, whereas the other half resemble the population. STANDout combines evidence across these patterns to test for departures from common-variant expectations.
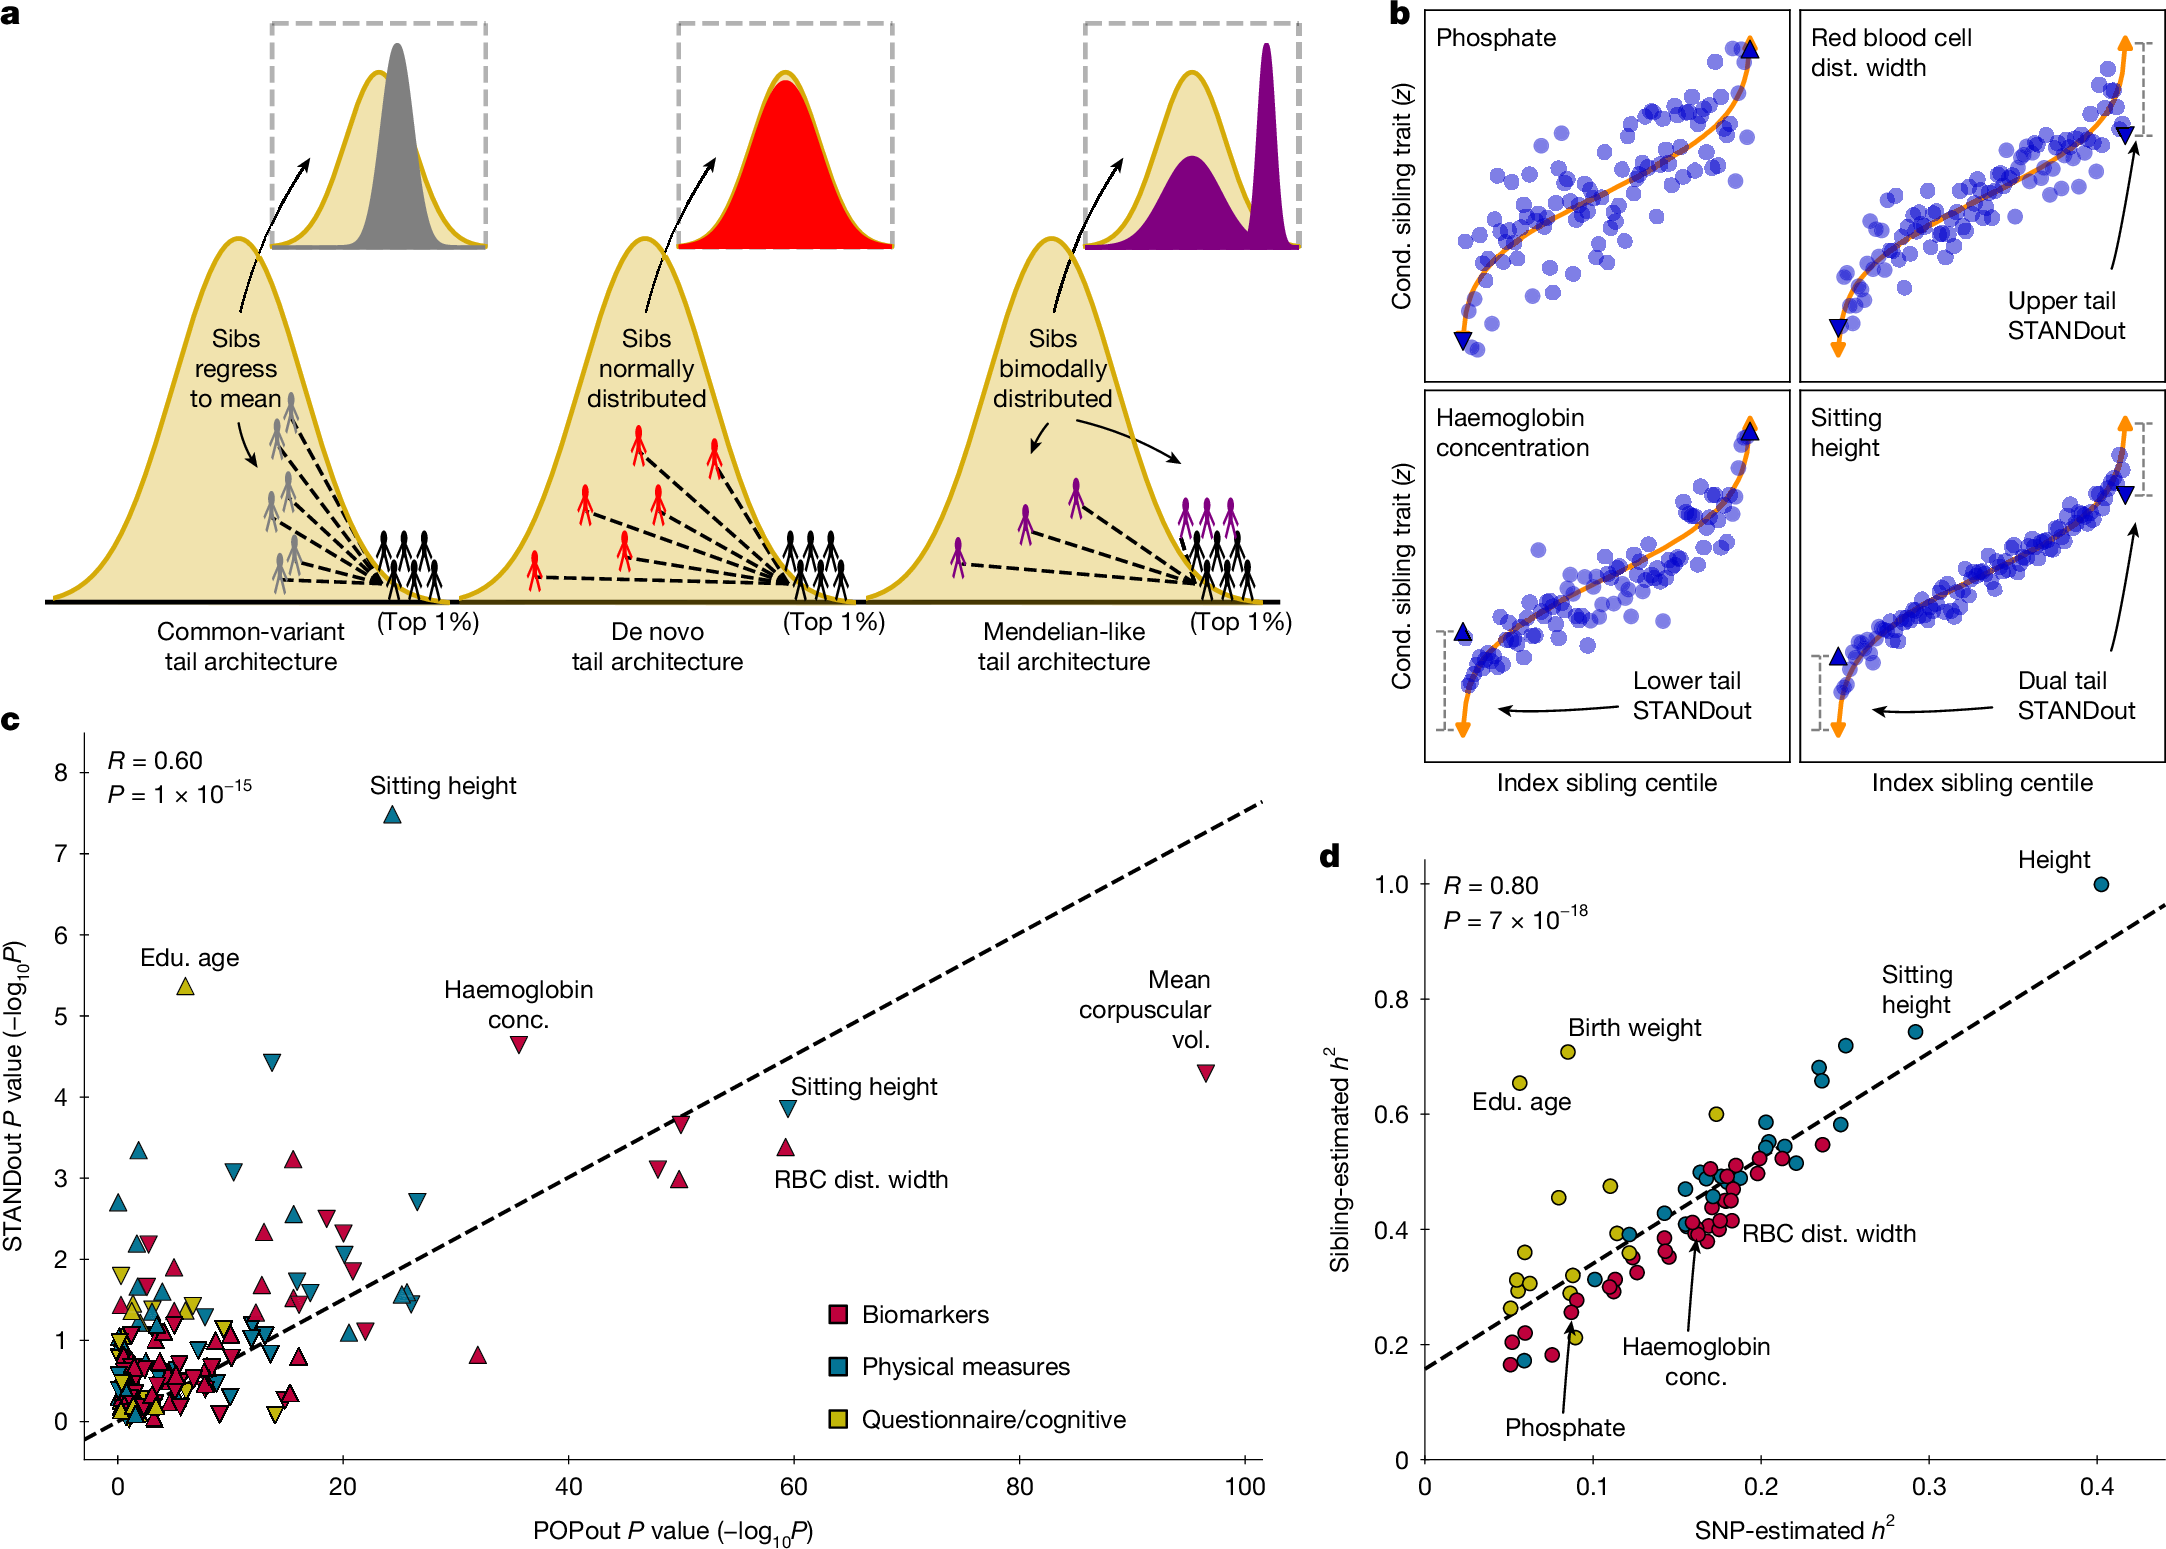
a, Schematic of relationships between sibling trait values under tails governed by common-variant (grey), de novo (red) and Mendelian-like (purple) architecture; here Mendelian-like refers to rare (but not de novo) large-effect alleles segregating in families. b, Index sibling trait centiles plotted against mean trait value of other (conditional) sibling for the four index traits (Fig. 2a). c, POPout P values (based on two-sided t-tests) plotted against STANDout P values (based on χ2 statistics with 4 d.f.) for the 74 traits. Pearson correlations and corresponding P values (two-sided test) are shown. d, LD score regression25 SNP-estimated heritability plotted against heritability estimated from sibling-pair trait similarity (Methods). Pearson correlations and corresponding P values (two-sided test) are shown. Sibs, siblings.
Across the 74 traits, STANDout results broadly replicated the POPout results. In terms of the index traits, STANDout recapitulated the lack of tail deviation for phosphate and identified strong tail-specific deviations from common-variant architectur