Wind shear enhances soil moisture influence on rapid thunderstorm growth
TL;DR
Wind shear interacts with soil moisture contrasts to enhance rapid thunderstorm growth, with extreme initiations 68% more likely under favorable soil conditions. This combination improves predictability for deep convection, especially in regions like sub-Saharan Africa.
Key Takeaways
- •Wind shear amplifies the influence of soil moisture patterns on convective storm initiation, leading to more extreme thunderstorm growth.
- •Extreme convective initiations are 68% more likely under favorable soil moisture conditions compared to unfavorable ones, particularly with strong wind shear.
- •The interaction between soil moisture-driven circulations and wind shear direction determines rainfall patterns, with reversed shear favoring negative soil moisture–precipitation feedbacks.
- •This mechanism provides a potential source of predictability for where deep convection develops, aiding in forecasting rapidly developing thunderstorms.
Tags
Abstract
Convective storms can develop rapidly, creating hazards to local populations through intense precipitation, strong winds and lightning1. The large-scale environment in which thunderstorms develop is often well captured in forecast systems, yet predicting where individual storms will initiate remains a fundamental challenge. It is known that differential heating driven by soil moisture (SM) patterns creates atmospheric circulations that favour convective initiation over drier soils2,3, whereas wind shear between low and mid levels can enhance storm growth4,5. Here we show that the most extreme initiations are especially favoured over SM contrasts by means of an interaction with wind shear. Analysing 2.2 million afternoon events across sub-Saharan Africa, we find 68% more initiations classed as extreme given favourable (versus unfavourable) soil conditions, with greatest vertical storm growth occurring where SM-driven circulations oppose the direction of shear-induced cloud displacement. Developing clouds follow the mid-level wind direction and, where this opposes the low-level flow, rainfall is strongly correlated with locally drier soils. Although such shear conditions are particularly common over tropical north Africa, the effect favours negative SM–precipitation feedbacks globally. The combination of SM heterogeneity and wind shear provides a potentially important source of predictability for where deep convection develops, particularly for the most rapidly developing thunderstorms.
Main
According to the World Meteorological Organization6, convective storms and their associated hazards were responsible for about 30,000 deaths and approximately US $500 billion in economic losses globally in 2010–2019. Advances in storm early-warning systems are reducing death tolls over time but economic losses are mounting owing to increasing exposure. Moreover, as the climate warms, these storms are projected to become more intense7. Such storms typically develop during the afternoon, in response to the destabilization of the atmospheric profile from daytime land–atmosphere fluxes of sensible heat (H) and latent heat (LE). Deep convective initiation (CI) can occur on timescales of tens of minutes as a cumulonimbus cloud deepens rapidly1. Updraughts within the cloud generate lightning, whereas evaporation of falling precipitation creates strong wind gusts. The resulting locally intense rain rates can trigger flash-flooding, particularly in urban areas with poor drainage systems.
Atmospheric conditions favourable for intense deep convection are typically characterized by thermodynamic instability of low-level air, often measured by convective available potential energy (CAPE), and vertical wind shear—the change of wind speed and direction with altitude, which influences thunderstorm organization and longevity4,5. CI itself is frequently tied to low-level convergence zones that provide a lifting mechanism8,9, such as along air mass boundaries and storm outflows or within synoptic-scale disturbances10,11, and can also be triggered by land-surface characteristics12. Cloud deepening and growth before CI depend not only on the atmospheric instability but also on the structure of the environmental wind field, which governs cloud motion, entrainment and the maintenance of convective updraughts. Strong directional shear, in particular, inhibits CI where initial updraughts fail to reach a minimum width to withstand enhanced entrainment13,14 but supports subsequent growth by increasing storm-relative inflow of unstable boundary-layer air15,16. The latter makes sheared environments conducive to the formation of severe or long-lived organized storms17,18.
Although present forecasting systems, based on numerical weather prediction and, increasingly, artificial intelligence, can predict the occurrence of favourable atmospheric conditions for convection over a region, it remains a fundamental challenge to predict where on scales of tens of kilometres (hereafter mesoscale) storms will trigger, particularly in the absence of well-known terrain features, such as mountains and coastlines. Land-surface properties, notably vegetation and SM, can influence convection by their influence on the partition of surface insolation into turbulent H and LE. Although fixed surface properties such as cropland, forest and urban areas can be accurately mapped and incorporated into forecasting systems, SM poses a greater challenge as it changes substantially in response to every new rainfall event, particularly in semi-arid regions.
Many studies examining how SM affects CI have focused on vertical profiles of atmospheric temperature and humidity, in particular, how changing the balance between H and LE can affect whether convection will be triggered19. In this view, wetter soils can promote CI by moistening the atmosphere and drier soils by warming near-surface air. However, at the mesoscale, observations of CI locations over diverse regions of the world point instead to a primary role for spatial variations in surface fluxes on scales of approximately 10–40 km (refs. 3,20,21,22,23). These show that CI is favoured on the downstream edge of drier soil patches. Numerical simulations provide a mechanism for this behaviour—strong contrasts in SM create gradients in H, which in turn drive planetary boundary layer (PBL) temperature and surface pressure gradients and thus mesoscale circulations analogous to sea breezes24,25,26. Convergence associated with these circulations is maximized where the background wind opposes the surface-induced flow27, hence favouring CI at the downwind edges of dry soils2,3. This mechanism explains why, globally, afternoon rainfall is more likely over locally drier soils (a negative spatial soil moisture–precipitation (SM–P) feedback)28,29. By contrast, global climate models simulate strong positive SM–P feedbacks because they lack the spatial resolution to capture both SM-induced and convective circulations28. In the new generation of high-resolution global convection-permitting simulations, this bias is addressed and a strong, negative spatial SM–P feedback is simulated, alongside a generally weak positive temporal SM–P correlation30, consistent with observations29.
Beyond regional analyses in known SM–P ‘hotspot’ regions31, it is unclear the extent to which CI is favoured over drier soil more generally, given that the mechanism relies on SM-limited (rather than energy-limited) LE32, and both high wind speeds25 and topographic variability33 disrupt convergence over drier soils. Notably, the effect of wind shear on SM–CI relationships has not been explored, even though shear often plays a key role in severe storm development.
Here we examine a 21-year CI dataset derived from satellite imagery across sub-Saharan Africa (SSA) (south of 25° N) to answer these questions. The domain provides a broad range of surface and atmospheric conditions, including surface aridity, CAPE and wind shear. We adapt an approach developed in previous studies20 to identify CI events at time t0 on the basis of rapid cooling to at least −40 °C in cloud-top temperature using high-resolution (15 min, about 3–5 km) satellite imagery from the Meteosat Second Generation (MSG) series (2004–2024). This yields 2,234,556 primary CIs during the afternoon (1200–1800 local time (LT); Extended Data Fig. 1). Cloud cooling rate is defined as the change in the local (within 25 km) minimum brightness temperature from t0−30 to t0 + 30 min. To characterize pre-CI spatial heterogeneity, we use surface SM derived from measurements around 0930 LT of the Advanced Scatterometer (ASCAT; 2007–2024). Clear-sky daytime land-surface temperature (LST) imagery (also from MSG) provides an independent source of surface conditions to validate our results, and continuous lightning data from Meteosat Third Generation (MTG) are available from July 2024. Pre-initiation low-level (100 m) and mid-level (650 hPa) winds are from the 5th European Centre for Medium-Range Weather Forecasts Reanalysis (ERA5)34, degraded to 1° resolution, with shear defined as the vector difference between winds at these levels, whereas Integrated Multi-satellitE Retrievals for GPM (IMERG)35 provides precipitation data.
Composite analysis
Following previous studies3,20,21,22, we performed a spatial composite of pre-CI SM, having first rotated the SM field around the initiation location so that all cases shared a common low-level wind direction. Figure 1a depicts a clear elliptical structure with CI favoured at the downwind edge of dry soil, consistent with those previous studies in SM hotspot regions. Our vast dataset allows us to better explore how the local SM contrast around CIs varies under different conditions. We define ΔSM as the difference between the pixel just upstream of the CI and areas 50 km away (Fig. 1). We find negative ΔSM values for all but the most topographically complex locations, qualitatively consistent with idealized numerical modelling33. We also see a weaker signal when sampling climatologically wetter parts of SSA, in which we expect SM to have less influence on LE. Note that our analysis excludes densely vegetated tropical forest regions, in which SM retrievals are not possible (Extended Data Fig. 2). There we would expect little sensitivity of LE (and hence convection) to SM outside the driest periods of the year.
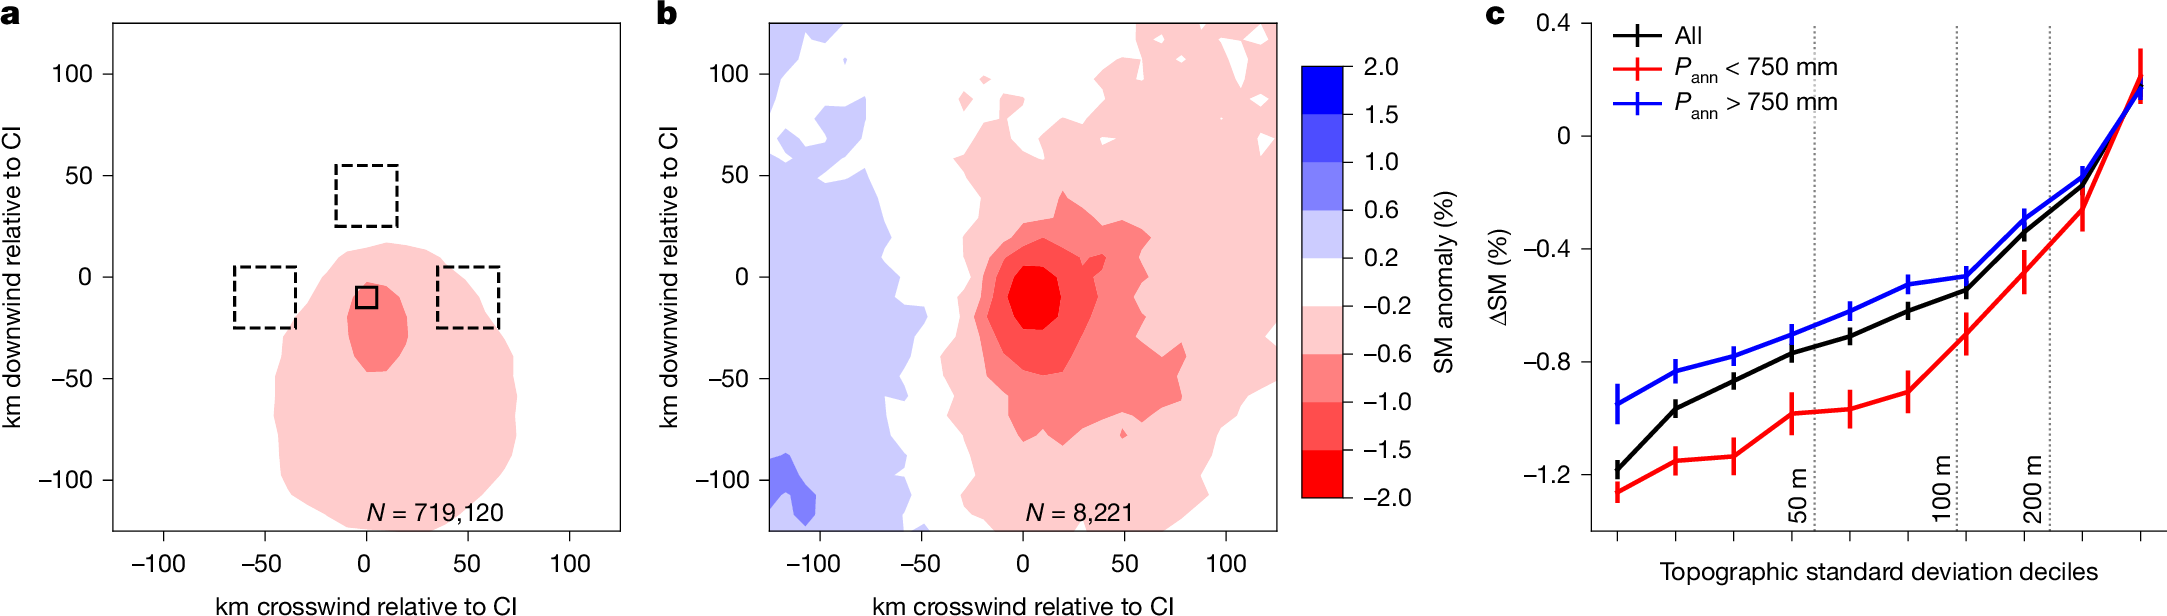
a,b, Composite mean SM anomaly patterns (%; shaded) observed before CI events. For each CI event, the data have been rotated around the initiation pixel at 0,0 so that the 100 m wind is flowing bottom to top in the figure, for all cases (a) and only cases of extreme convective growth (b), corresponding to the 99th centile of local cloud cooling rate. c, Local SM contrast ΔSM (%) from all CIs (black), averaged over decile bins of topographic standard deviation (bars denote standard error of the mean). The dataset is also split into climatologically wetter (blue) and drier (red) locations on the basis of a precipitation threshold of 750 mm year−1. ΔSM quantifies the SM difference between the pixel 10 km upstream of the CI (solid box in a) and the mean over pixels in the three dashed boxes centred 50 km away.
We define extreme CI events as those in the top 1% of cloud cooling rates, corresponding to −78 °C h−1 or more. Of these extreme events, 45.6% reach minimum temperatures of −82 °C or colder (about 17 km altitude; Extended Data Fig. 3), equivalent to typical tropical tropopause temperatures36. Compared with the all-events composite, extreme CIs exhibit a markedly stronger SM signal (Fig. 1b). They tend to occur under moderate to strong wind shear; 85% of extreme CIs have shear magnitude exceeding 6 m s−1, compared with 49% for all cases. They are strongly favoured over central and tropical north Africa (Extended Data Fig. 1), a global hotspot of lightning and mesoscale convective system activity37. They occur preferentially on the northern side of the tropical rain belt (Extended Data Fig. 2), in which wind shear38 and SM heterogeneity39 tend to be larger than within the rain belt. However, the larger-magnitude signal in Fig. 1b is not simply because of sampling locations and seasons with stronger space-time SM variability. These cases are statistically more distinct from their background SM states than the all-cases composite (Extended Data Fig. 4).
Sensitivity to wind shear
Figure 2 presents the same set of cases as in Fig. 1a but now stratified according to the direction of the mid-level wind relative to the low-level flow. There is a marked separation in pre-event SM between these four shear directions and, again, the amplitude of the pattern is notably stronger than in Fig. 1a. When the mid-level wind is well aligned with the low levels (‘v650+’; 34.8% of all cases), a strong positive downstream SM gradient is the most prominent feature, consistent with arguments underpinning previous analyses2,3. However, when the mid-level wind opposes the low levels (‘v650−’; 23.5% of cases), the dominant SM gradients are crosswind. Finally, when the mid-level winds blow to the left or right (‘v650L’ or ‘v650R’), they are associated with a rotation in maximum SM gradients of about 45° relative to Fig. 2a, with wetter soils lying downstream of the combined low-level and mid-level wind vector. Taken together, this shows that wind shear direction plays a central role in mediating the influence of the land surface on CI. The all-cases elliptical structure in Fig. 1a is simply a superposition of markedly stronger SM structures from four distinct mid-level orientations.
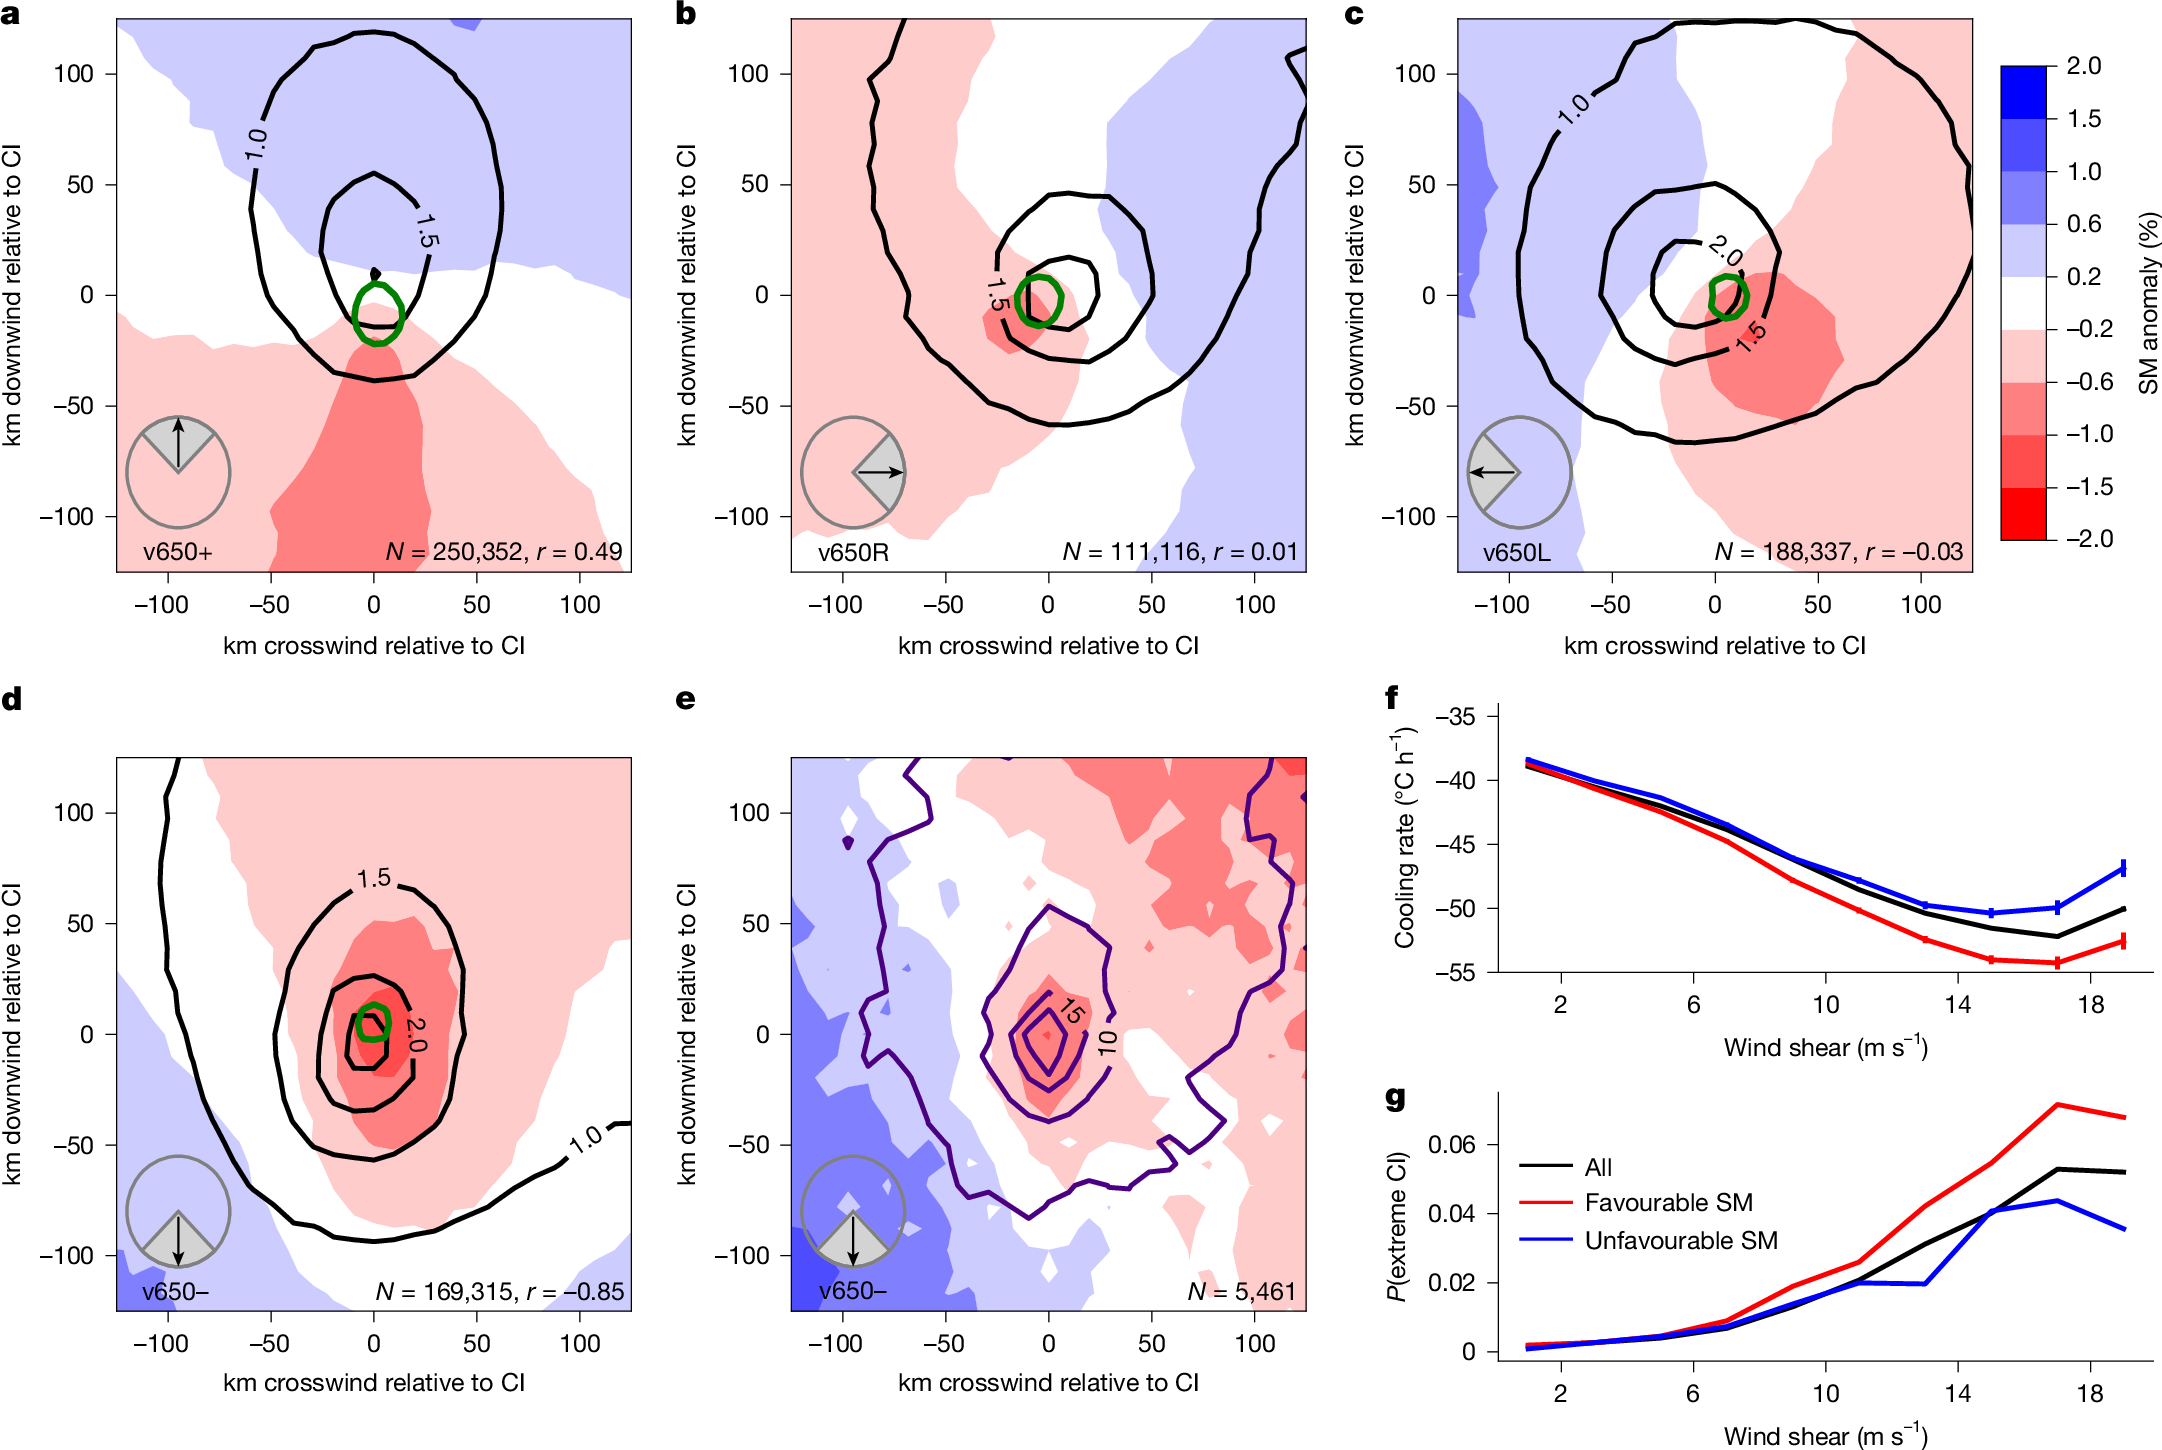
a–d, Composite mean SM anomalies (shaded; %) around CI events, rotated according to the 100 m wind, as in Fig. 1. Data are stratified into quadrants of mid-level wind direction (inset) relative to the low-level flow; v650+ (a), v650R (b), v650L (c) and v650− (d). Black contours depict 3-h post-initiation P accumulations (mm). The green contour identifies where warm cloud (maximum temperature of 0 °C) cover expands by at least 10% between t0−75 and t0−45 min. The number of events (N) and the Pearson correlation coefficient (r(SM,P)) are provided for each shear configuration. e, Composite mean SM anomalies and lightning activity (indigo contours; flashes over 3 h starting 15 min before initiation) for v650− cases for July–December 2024. f,g, Cloud-top cooling rate (°C h−1) (f) and probability of CI being extreme (%) (g) as a function of wind shear magnitude for all cases (black) and for favourable (red) and unfavourable (blue) SM patterns for CI. Bars in f denote standard errors and cooling-rate differences between favourable and unfavourable patterns are significantly different (P < 0.001) for all wind shear bins >2 m s−1.
We now examine how wind shear magnitude influences the SM control on CI. Considering all events irrespective of shear direction (Fig. 2f), cloud growth is strongly sensitive to shear magnitude, with clouds cooling on average by more than 50 °C in an hour for shear exceeding 12 m s−1, although there is evidence of a reversal in this trend for shear stronger than 18 m s−1. This is consistent with theories about the role shear plays in CI (refs. 13,40). To diagnose the impact of SM gradients on cloud growth, we define direction-specific ‘favourable’ and ‘unfavourable’ SM contrasts (ΔSMsh) on the basis of composite mean SM structures in Fig. 2a–d (see Methods and Extended Data Fig. 5). Favourable SM configurations (centred on drier soils) accelerate vertical cloud growth compared with the all-cases mean (Fig. 2f), whereas unfavourable patterns (centred on wetter soils) tend to grow more slowly. Moreover, the sensitivity of growth to SM increases with wind shear magnitude. Thus, under high shear conditions, in which extreme CIs are more likely, cloud growth is especially sensitive to SM and this underlies the larger-amplitude composite SM pattern for extreme events in Fig. 1b. For strong shear (>12 m s−1), the probability of a CI being classified as extreme (Fig. 2g) is 5.17% for favourable SM configurations, compared with 3.08% for unfavourable SM, a relative increase of 68%.
These shear-based composites also provide distinct behaviour in terms of subsequent rainfall accumulations. Controlled by the mid-level wind, rainfall propagates away from the initiation location. In the case of no directional shear (v650+; 34.8% of all cases), the rainfall maximum occurs about 20 km downstream, over relatively wet soil. This yields a positive spatial SM–P correlation (r(SM,P) = 0.49), consistent with a previous numerical study2. In the reverse shear case (v650−; 23.5% of cases), the opposite occurs, with rain highly organized over dry soils (r(SM,P) = −0.85) and the amplitude of the composite-mean rainfall pattern markedly increased. For crosswind shear, correlations are close to zero, as rainfall is maximized over the strongest SM gradient in the composite mean. The 6 months of available continuous lightning observations illustrate a highly localized lightning maximum around the CI location linked to SM patterns. Electrical activity is tightly organized within the driest soil pixels in the case of reversed shear (Fig. 2e). For the other shear directions, a well-defined local lightning maximum occurs above the strongest SM gradients (Extended Data Fig. 6).
Mechanistic interpretation
We propose the following mechanistic arguments to explain our findings. First, we note that, in each of the four shear directions, shallow cloud development at t0−1 h (green contours in Fig. 2) is maximized about 5–20 km ups