Intestinal macrophages modulate synucleinopathy along the gut–brain axis
TL;DR
Intestinal muscularis macrophages (ME-Macs) are identified as early initiators of α-synuclein pathology in Parkinson's disease, modulating its spread from the gut to the brain via T cell expansion and neurodegeneration. Depleting ME-Macs reduces pathology and improves motor function in mouse models.
Key Takeaways
- •ME-Macs in the intestinal muscularis externa engulf misfolded α-synuclein, leading to endolysosomal dysfunction and triggering α-synuclein pathology in Parkinson's disease models.
- •ME-Macs modulate the expansion of CD4+ T cells in the enteric nervous system, which travel to the brain via the dura mater as pathology progresses.
- •Targeted depletion of ME-Macs reduces α-synuclein pathology in both the gut and central nervous system, prevents T cell migration, and mitigates neurodegeneration and motor dysfunction.
- •The study supports the 'body-first' PD hypothesis, where pathology originates in the gut and spreads to the brain, with ME-Macs playing a crucial role in early disease stages.
Tags
Abstract
Emerging evidence suggests that Parkinson’s disease (PD) may have its origin in the enteric nervous system (ENS), from where α-synuclein (αS) pathology spreads to the brain1,2,3,4. Decades before the onset of motor symptoms, patients with PD suffer from constipation and present with circulating T cells responsive to αS, suggesting that peripheral immune responses initiated in the ENS may be involved in the early stages of PD1,5,6,7. However, cellular mechanisms that trigger αS pathology in the ENS and its spread along the gut–brain axis remain elusive. Here we demonstrate that muscularis macrophages (ME-Macs), housekeepers of ENS integrity and intestinal homeostasis, modulate αS pathology and neurodegeneration in models of PD8,9. ME-Macs contain misfolded αS, adopt a signature reflecting endolysosomal dysfunction and modulate the expansion of T cells that travel from the ENS to the brain through the dura mater as αS pathology progresses. Directed ME-Mac depletion leads to reduced αS pathology in the ENS and central nervous system, prevents T cell expansion and mitigates neurodegeneration and motor dysfunction, suggesting a role for ME-Macs as early cellular initiators of αS pathology along the gut–brain axis. Understanding these mechanisms could pave the way for early-stage biomarkers in PD.
C1q-dependent clearance of alpha-synuclein allows macrophages to transiently limit enteric synucleinopathy in male mice
Metagenomics of Parkinson’s disease implicates the gut microbiome in multiple disease mechanisms
Inflammatory gut as a pathologic and therapeutic target in Parkinson’s disease
Main
There is growing awareness that the ENS may represent the initial site of αS pathology in PD. Constipation is one of the earliest and most common symptoms in patients with PD and probably reflects ENS dysfunction1,10. The concept of body-first PD is strongly supported by postmortem and multimodal imaging studies showing early Lewy pathology in the ENS of patients with PD, suggesting a caudo-rostral distribution from the intestine to the brainstem and other brain regions2,11. Further, intestinal injections of αS in mice result in the hierarchical spread of Lewy pathology to the brain, strongly implicating the ENS in early stages of disease3,4. However, little is known about the cellular and molecular mechanisms that could trigger the onset of αS pathology in the ENS and progression to the brain.
Tissue-resident macrophages are specialized phagocytes that orchestrate numerous niche-specific functions critical for tissue homeostasis12. In the intestine, macrophages facing the microbiota are continually replaced by blood monocytes and are strategically positioned in the murine lamina propria to engulf penetrating pathogens13. By contrast, ME-Macs reside in the muscularis externa (ME) and support the functional integrity of the myenteric plexus, a network of enteric neurons integral to gastrointestinal motility8,9,14. ME-Macs colonize the murine intestine before birth, are self-maintained but gradually replaced throughout life and maintain enteric neuronal health through the production of neurotrophic factors and the clearance of debris. In the ageing murine intestine, ME-Macs accumulate αS and express PD-associated genes Gba1 and Lrrk2, raising the intriguing question of whether ME-Macs could confer risk in body-first PD pathology15. Whereas central nervous system (CNS)-resident macrophages have been implicated in αS pathology, the role of ENS-resident ME-Macs remains unclear7,16,17.
Here we show that ME-Macs are necessary for the formation and distribution of αS pathology in the intestine and the CNS. In mouse models of PD, including αS transgenic mice and ME injections of patient-derived-αS, ME-Macs, but not enteric neurons, contain misfolded, aggregated αS that coincides with endolysosomal activation in ME-Macs. Mechanistically, we found that ME-Macs in PD mouse models modulate T cell expansion in the ENS. We further show that T cells invade the CNS as αS pathology progresses, and preventing T cell egression ameliorated neurodegeneration. Functionally, we show that injection of anti-CSF1R with anti-CCR2 into the ME, targeting ME-Macs, ameliorated αS pathology in both the ENS and CNS, abolished T cell migration along the gut–brain axis and improved motor defects and neurodegeneration in mouse models of synucleinopathy. Together, our results uncover the role of ME-Macs in the onset and progression of αS pathology and motor impairments along the gut–brain axis in body-first PD.
ME-Macs engulf and modify αS pathology
We first investigated the onset of αS pathology in the ENS versus CNS in 3KL αS transgenic mice, in which αS expression is driven by Thy1 and the 3K construct introduces phenotypic amplification of familial E46K mutations promoting αS tetramer destabilization and aggregation18. 3KL mice demonstrate key features of PD pathology including progressive cortical pathological αS, hereafter defined as s129p+ αS, selective neuronal loss and l-DOPA responsive motor impairments at 8 months of age18. Immunohistochemistry (IHC) on mechanically separated duodenal ME demonstrated significantly increased s129p+ αS surrounding HuC/D+ myenteric ganglia, a specialized group of enteric neurons within the ME, of 3KL versus wild-type (WT) mice (Fig. 1a–c) at 3 months. We focused on the duodenum, a region highly innervated by the vagus nerve. We also observed s129p+ αS in the ME of postmortem PD tissues (Extended Data Fig. 1a,b). Further, increased total gut transit time was observed in 3-month 3KL versus WT, suggesting impaired ENS function and constipation (Fig. 1d). However, we found no changes in murine myenteric ganglia and glial volume, measured by HUC/D and glial fibrillary acidic protein, indicating the absence of neuronal death despite αS and enteric pathology (Extended Data Fig. 1c,d). To investigate underlying molecular changes, we performed digital spatial profiling (DSP) on duodenal myenteric plexus in 3-month 3KL versus WT mice using a multiplexed antibody panel consisting of PD-associated targets (Fig. 1e). We observed increased expression of proteins related to autophagy and lysosomal biology in myenteric ganglia of 3KL versus WT, including PINK1, LRRK2 and VPS35 that are associated with familial PD (Fig. 1e). Of note, DSP confirmed upregulation of s129p+ αS in myenteric plexus and elevated total αS levels in both the lamina propria and myenteric plexus (Extended Data Fig. 1e). In the brain, we observed increased punctate αS s129p+ staining in cholinergic neurons of the dorsal motor nucleus of the vagus of 3KL animals at 6 months compared with age-matched WT controls (Extended Data Fig. 1f–k).
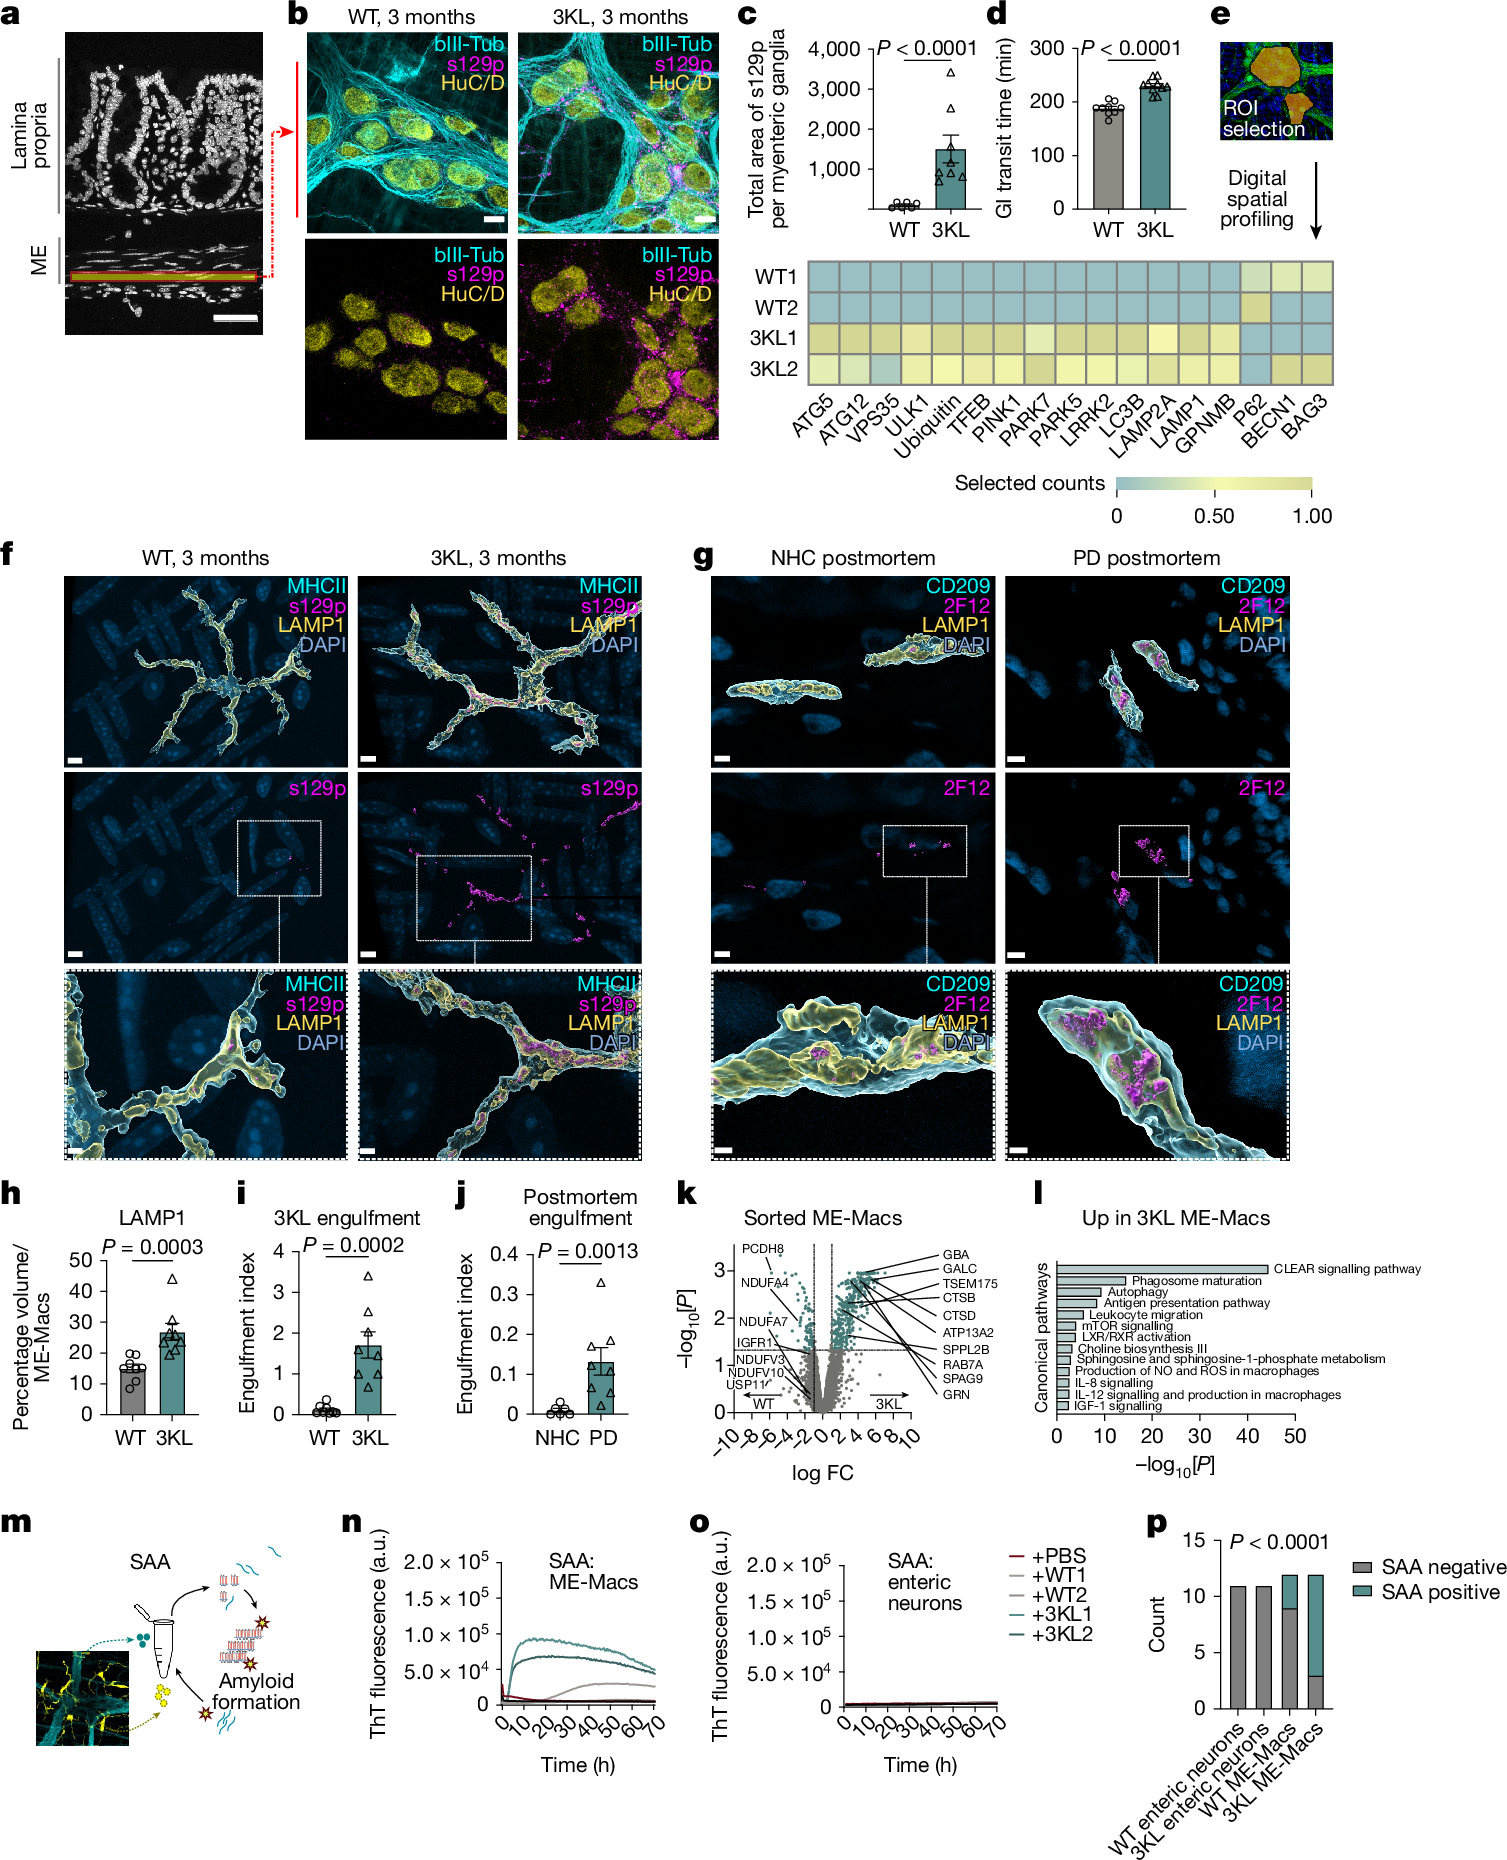
a, Schematic of gut cross-section. b, Confocal image of duodenal myenteric plexus of 3-month WT versus 3KL. c, Quantification of s129p+ αS pathology: n = 6–8 mice; 1 datapoint, average of 1 mouse; 3–10 ROIs per mouse. Three experiments, data analysed using an unpaired t-test. d, Whole gastrointestinal transit time in 3-month WT versus 3KL, n = 9–10. Two experiments, unpaired t-test. e, Hierarchically clustered heatmap of ROI-specific nCounter digital counts across PD-relevant protein targets in duodenal myenteric plexus of 3-month WT versus 3KL, n = 2, 2–3 ROIs per mouse. f–j, Confocal images of engulfed αS by murine MHCII+ duodenal (f) and human CD209+ jejunal (g) ME-Macs, quantified murine LAMP1 lysosomal volume (h) and engulfment of s129p in murine (i) and αS (2F12) in human (j) LAMP1+ lysosomes. n = 8 mice per genotype (h,i) and n = 6 NHC and 8 PD postmortem samples (j). Two experiments, Mann–Whitney test (h–j). k, Volcano plot showing differentially expressed proteins in sorted ME-Macs of 3-month WT versus 3KL. n = 2 per genotype, with 3 mice pooled per biological unit. l, Biological processes enriched in 3-month 3KL ME-Macs, one-sided hypergeometric test. m, Schematic of SAA on sorted duodenal ME-Macs versus enteric neurons. n,o, αS aggregation kinetics through SAA in duodenal enteric neurons (n) and ME-Macs (o). p, SAA-positive versus negative count in different cell lysates. A sample was counted positive if aggregation onset (lag time) was at least 2 h shorter than negative control (PBS). n = 11 (enteric neurons), n = 12 (ME-Macs). Six experiments, Fisher’s exact test. Data are mean ± s.e.m. (error bars). FC, fold change; GI, gastrointestinal; NO, nitric oxide; ROS, reactive oxygen species; ThT, thioflavin T. Scale bars, 50 μm (a); 10 μm (b); 5 μm (f–j), insets 2 μm (f–j).
Inflammation has been linked to the initiation and progression of αS pathology, and many PD risk genes are enriched in immune cells7,19. Macrophages are the most abundant innate immune cells in the intestinal layers. ME-Macs have a crucial role in maintaining ENS integrity, with their loss leading to constipation8,9,14. We observed no significant differences in ME-Mac distribution across the duodenum, jejunum and ileum of 3-month WT versus 3KL animals (Extended Data Fig. 2a,b). Fluorescence-activated cell sorting (FACS) analysis of ME and lamina propria revealed unaltered differentiation of intestinal macrophages from monocyte precursors at 3 months, 4 months and 6 months of age13 (Extended Data Fig. 2c–f). By contrast, ME-Macs demonstrated increased expression levels of CSF1R and major histocompatibility complex class II (MHCII) (Extended Data Fig. 2g). We questioned whether ME-Macs, as professional phagocytes of the ENS, engage in the clearance of accumulating αS in surrounding myenteric neurons (Fig. 1f–j and Extended Data Fig. 2h,i). We assessed levels of lysosomal LAMP1 in ME-Macs and found an almost twofold increase in LAMP1 expression in ME-Macs from 3KL versus WT (Fig. 1h). We observed a roughly 14-fold increase in s129p+ αS engulfment by ME-Macs (that is, in LAMP1+ lysosomes) in 3-month 3KL mice compared with age-matched WT controls and a similar 14-fold increase in ME-Macs in postmortem jejunum of PD versus neurologically healthy control (NHC) participants (Fig. 1i,j and Supplementary Table 1a). Further, we found significant (P ≤ 0.05) differential expression of 474 proteins using mass spectrometry in sorted CX3CR1hiCD11clo ME-Macs of 3-month 3KL versus WT mice including lysosomal GRN, CTSB and CD68 (Fig. 1k and Extended Data Fig. 2k). Observed downregulated proteins included NDUFV3, NDUFB10, NDUFA4 and NDUFA7, part of the mitochondrial NADH-ubiquinone oxidoreductase complex that has been implicated in PD20 (Fig. 1k). Notably, 3-month 3KL ME-Macs acquire signatures related to phagosome maturation and lysosome pathways (collectively referred to as the coordinated lysosomal expression and regulation network)21, suggesting continuing clearance response in ME-Macs exposed to s129p+ αS and confirming our DSP data (Fig. 1l and Extended Data Fig. 2j).
We then asked whether s129p+ αS engulfed by 3KL ME-Macs shows altered pathological activity compared with WT ME-Macs and enteric neurons. We adapted the αS seed amplification assay (SAA) to isolated ME-Macs and enteric neurons to detect prion-like misfolded αS by means of templated aggregation of monomeric αS, which results in amplified binding to thioflavin T22 (Fig. 1m). Notably, lysates from isolated ME-Macs of 3-month 3KL demonstrated accelerated aggregation response within 10 hours in contrast to WT ME-Macs, suggesting increased aggregation activity in 3KL ME-Macs (Fig. 1n,o). No activity was observed in isolated enteric neurons from either 3-month 3KL or WT mice, despite the expression of total αS in enteric neurons but absence in ME-Macs (Fig. 1n–p and Extended Data Fig. 2l). The presence of αS aggregates in 3KL ME-Macs was further confirmed using the amyloid-binding dye Amytracker in isolated ME-Macs by flow cytometry (Extended Data Fig. 2m). In line with SAA data, we observed increased Amytracker signal in ME-Macs of 3-month 3KL versus WT mice but did not find positive signal in lamina propria Macs (Extended Data Fig. 2m,n). Together, these results indicate ME-Macs as potential modulators of αS amyloid aggregates in the ENS.
To further explore the gut–brain axis in synucleinopathy, we directly injected human PD brain-extracted αS fibrils (PD) versus identically extracted human neurological healthy control (NHC) brain preparations into ME of SncaWT/GFP knock-in mice3,4,23 (Extended Data Fig. 3a–e and Supplementary Table 1b). We used a purification protocol specifically designed to select for amyloid and other highly insoluble proteins24. The brain-extracted αS fibrils are hereafter designated as PD-αS and NHC-αS, respectively. Duodenal injection of PD-αS but not NHC-αS in ME increased endogenous αS expression in myenteric ganglia (Fig. 2a,b). We observed significant upregulation of s129p+ αS immunoreactivity at 1 month and 3 months postinjection, predominantly around neuronal cell bodies and to a lesser extent, in extraganglionic neurons, similar to 3-month 3KL (Fig. 2a–d). Prolonged total gut transit time was found post-PD-αS injection (Fig. 2e). Significant increase of s129p+ αS inclusions was observed at 3 months post-PD-αS injection in the brainstem (Fig. 2f,g). Further, an increased fraction of s129p+ αS in dopaminergic neurons of the substantia nigra pars compacta (SNpc) was observed, suggesting a potential route for pathological spread from the ENS to the CNS (Fig. 2h,i). We observed a selective loss of dopaminergic neurons in the SNpc at 3 months post-PD-αS versus NHC-αS injections (Fig. 2j,k and Extended Data Fig. 3f). By contrast, no dopaminergic neuronal loss was observed in the ventral tegmental area (VTA), consistent with the region-specific dopaminergic neuronal vulnerability in patients with PD25 (Fig. 2k). We then investigated whether ME-Macs engulfed s129p+ αS in response to PD-αS injections and observed a roughly 13-fold increase in lysosomal s129p+ αS in ME-Macs in PD-αS-injected animals compared with NHC-αS-injected controls at 1 month postinjection (Extended Data Fig. 3g–i). However, we found no overt production of inflammatory cytokines in the ME, suggesting the absence of local inflammation in the ME induced by αS injections (Extended Data Fig. 3j). These data indicate that body-first αS pathology, triggered by PD-αS injection into the ME, propagates from the ENS to the CNS, leading to region-specific dopaminergic neuron loss.
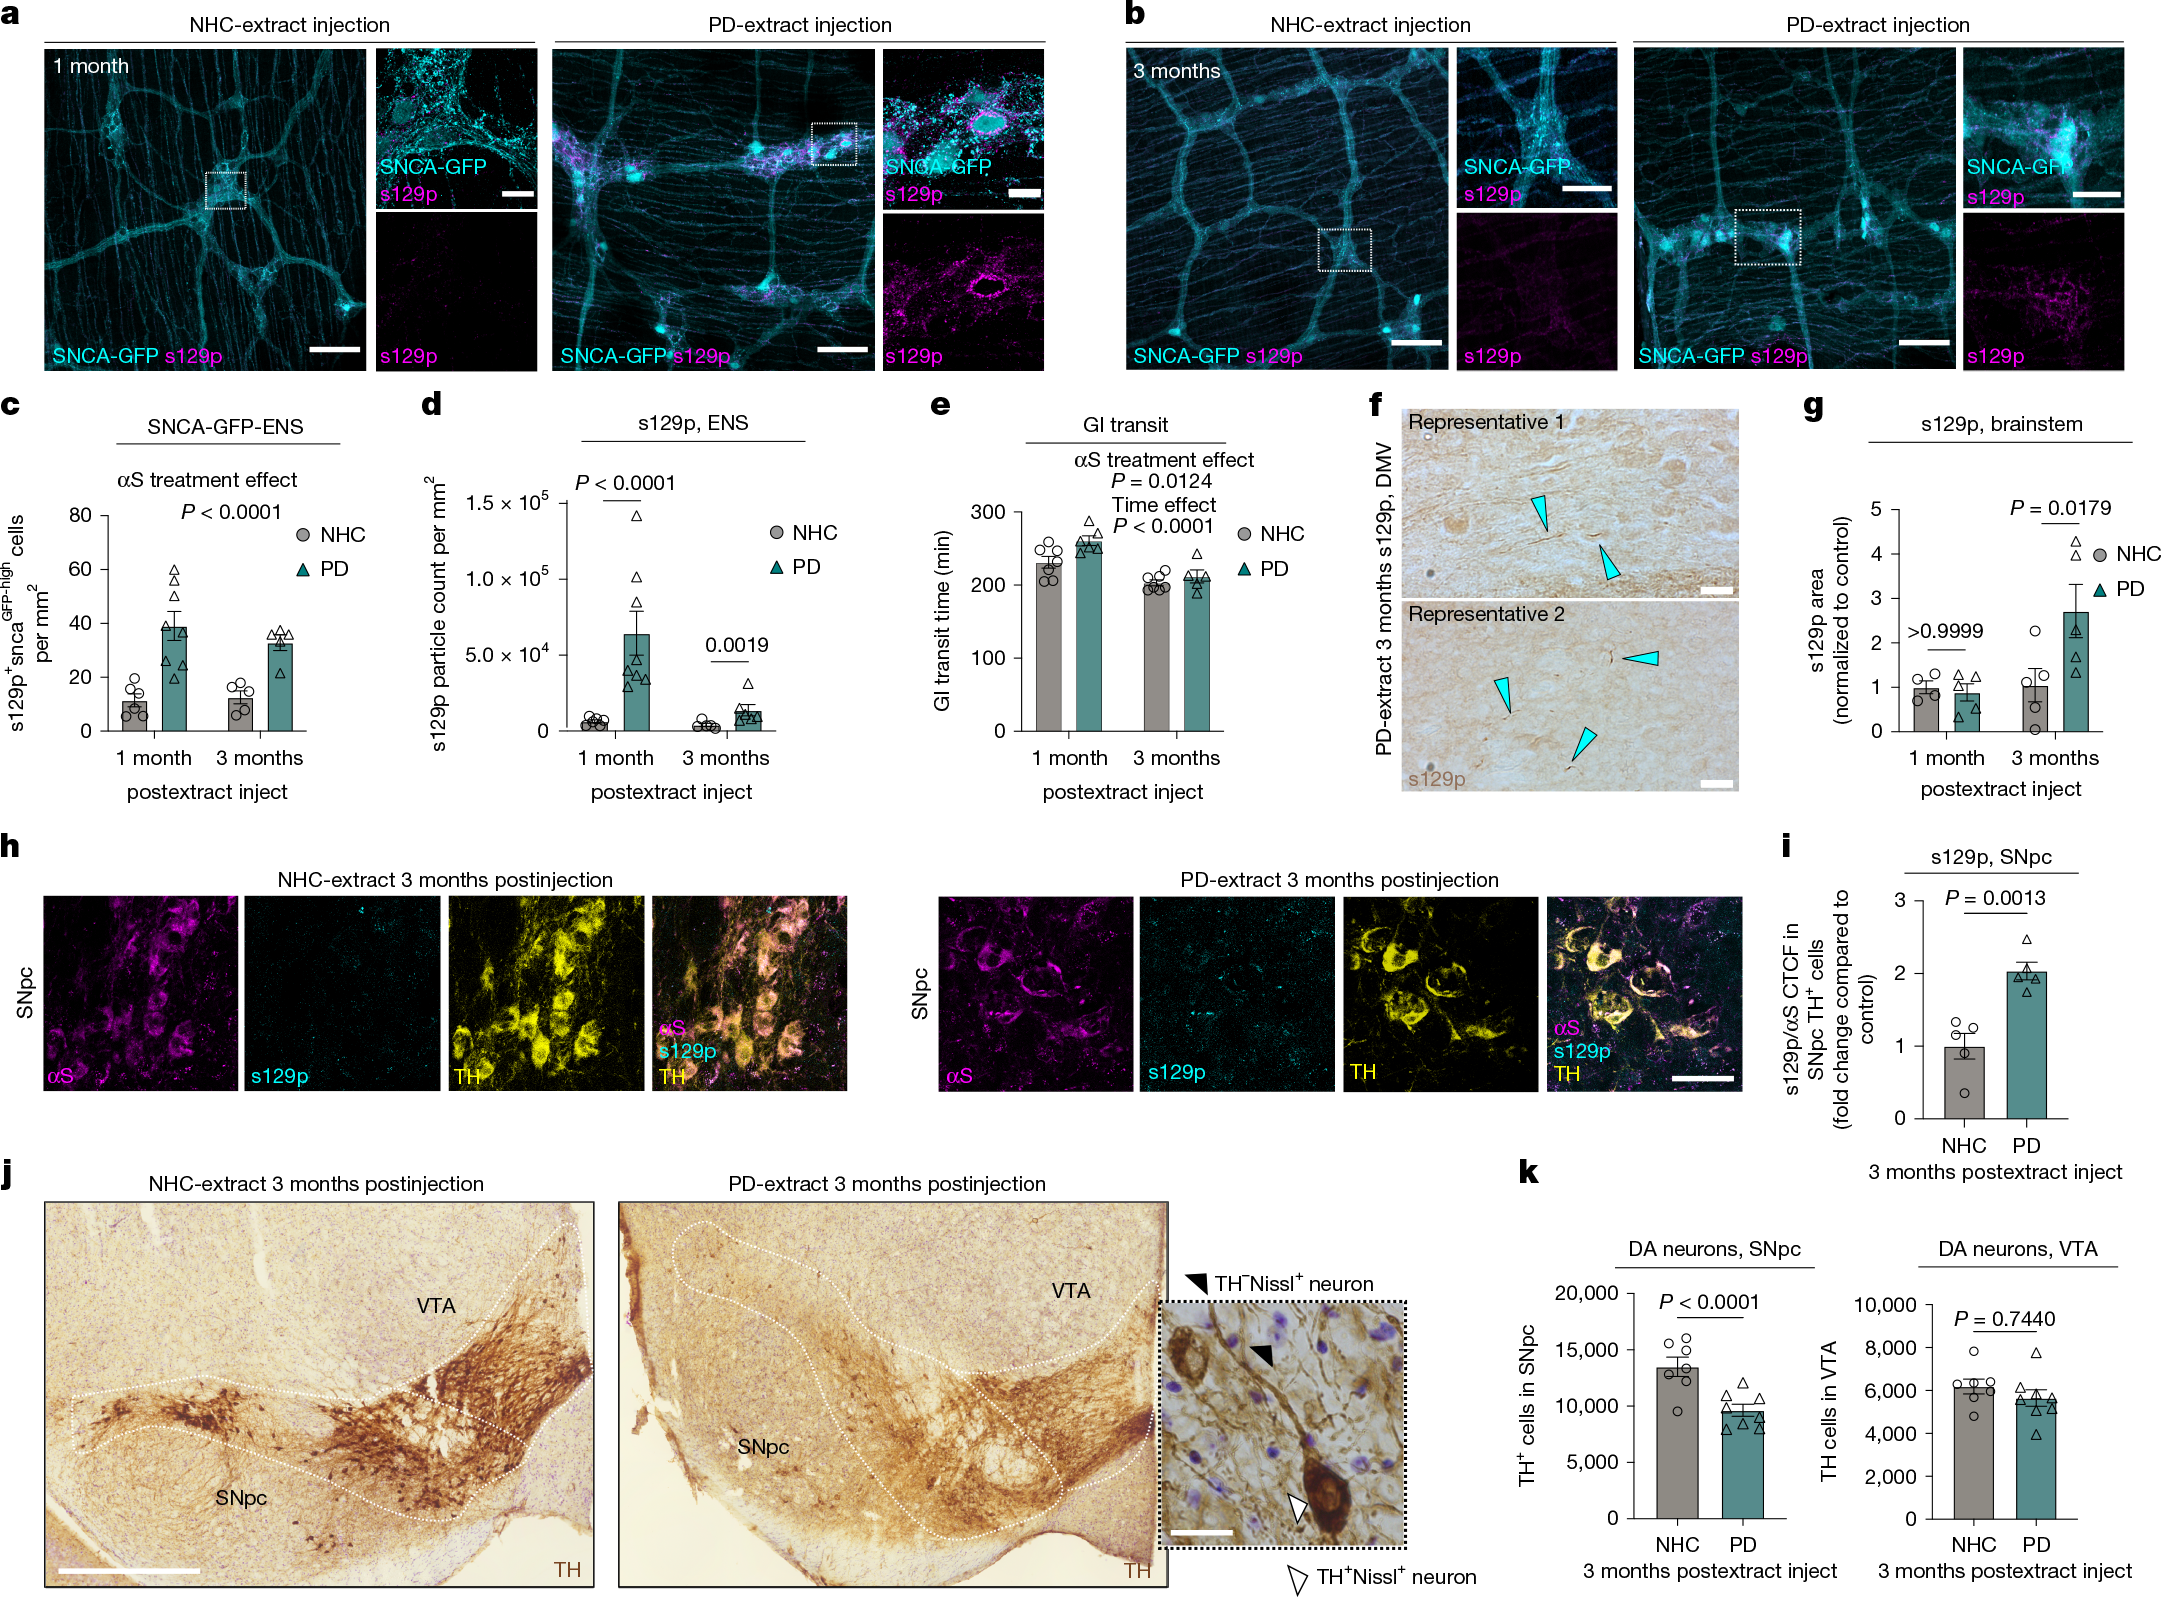
a,b, αS s129p+ pathology in duodenal myenteric plexus at 1 month (a) and 3 months (b) post-NHC-αS versus PD-αS injection. c, Quantification of αS-GFPhigh cells per mm2 at 1 month and 3 months postinjection. n = 6 for αS-NHC, 1 month; n = 8 for αS-PD, 1 month; n = 5 for αS-NHC and αS-PD, 3 months. Two experiments. d, Quantification of αS s129p+ pathology at 1 month and 3 months postinjection. One datapoint, average of 1 mouse, 5–9 ROIs per mouse. n = 6 mice for αS-NHC, 1 month; n = 8 for αS-PD, 1 month; n = 5 mice for αS-NHC and n = 6 mice for αS-PD, 3 months. Two experiments. e, Gastrointestinal transit time at 1 month and 3 months postinjection. n = 7 mice for αS-NHC, n = 6 mice for αS-PD, 1 month; n = 7 mice for αS-NHC, n = 5 mice for αS-PD, 3 months. Two experiments, data analysed using two-way ANOVA (c–e) with Bonferroni’s multiple-comparison test (d). f, Widefield images of s129p+ αS pathology in brainstem at 3 months postinjection, blue arrows highlight αS inclusions. g, Quantification of s129p+ αS pathology in brainstem at 1 month and 3 months postinjection, n = 4 mice for αS-NHC, 1 month and n = 5 mice for αS-NHC, 3 months; αS-PD, 1 month and 3 months. Two experiments, two-way ANOVA with Bonferroni’s multiple-comparison test. h, αS s129p+ pathology in SNpc at 3 months post-NHC versus PD-extract injection. i, CTCF of s129p αS normalized to total αS, n = 5 mice per group. Two experiments, unpaired t-test. j, TH+ immunostainings in SNpc and VTA using DAB, 3 months post-treatment. brightfield micrograph of dopaminergic neurons in the SNpc. k, Unbiased stereological quantification of TH+ cells in SNpc and VTA, n = 7 mice for αS-NHC, SNpc and VTA, n = 8 mice for αS-PD, SNpc and VTA. Three experiments, mixed-effect model with multivariate t-distribution posthoc test. Data are mean ± s.e.m. (error bars). Scale bars, 100 μm (a,b), insets 20 μm (a,b,j); 20 μm (f,j); 50 μm (h); 500 µm (j). DA, dopaminergic.