An X-ray-emitting protocluster at z ≈ 5.7 reveals rapid structure growth
TL;DR
A protocluster at redshift 5.7, detected via combined JWST and Chandra observations, reveals early hot intracluster medium formation and rapid large-scale structure growth in the early universe.
Key Takeaways
- •The JADES-ID1 protocluster at z ≈ 5.7 is the earliest known system with detected hot intracluster medium (ICM), indicating virial heating began just one billion years after the Big Bang.
- •Combined JWST galaxy overdensity and Chandra X-ray emission confirm a total mass of ~1.8×10^13 M⊙, making it a progenitor of today's most massive galaxy clusters.
- •The discovery suggests faster-than-predicted structure formation in some early universe regions, challenging standard cosmological models.
- •Multi-wavelength approaches (JWST for galaxies, Chandra for X-rays) are crucial for identifying and studying high-redshift protoclusters.
Tags
Abstract
Galaxy clusters are the most massive gravitationally bound structures in the universe and serve as tracers of the assembly of large-scale structure1. Studying their progenitors, protoclusters, sheds light on the earliest stages of cluster formation. However, detecting protoclusters is demanding: their member galaxies are loosely bound and the emerging hot intracluster medium (ICM) may only be in the initial stages of virialization2,3,4. Recent James Webb Space Telescope (JWST) observations located several protocluster candidates by identifying overdensities of z ≳ 5 galaxies5,6,7,8,9. However, none of these candidates was detected by X-ray observations, which offer a powerful way to unveil the hot ICM. Here we report the combined Chandra and JWST detection of a protocluster, JADES-ID1, at z ≈ 5.68, merely one billion years after the Big Bang. We measure a bolometric X-ray luminosity of \({L}_{{\rm{bol}}}=(1.{5}_{-0.6}^{+0.5})\times 1{0}^{44}\,{\rm{erg}}\,{{\rm{s}}}^{-1}\) and infer a total gravitating mass of \({M}_{500}=(1.{8}_{-0.7}^{+0.6})\times 1{0}^{13}\,{M}_{\odot }\), making this system a progenitor of today’s most massive galaxy clusters. The detection of extended, shock-heated gas indicates that substantial ICM heating can occur in massive halos as early as z ≈ 5.7. Also, given the limited survey volume, the discovery of such a massive cluster is statistically unlikely10, implying that the formation of the large-scale structure must have occurred more rapidly in some regions of the early universe than standard cosmological models predict.
Forming intracluster gas in a galaxy protocluster at a redshift of 2.16
A dense web of neutral gas in a galaxy proto-cluster post-reionization
Confirmation and refutation of very luminous galaxies in the early Universe
Main
Protoclusters are the earliest phase in the assembly of large-scale cosmic structures. These systems mark a transition from initial galaxy overdensities to fully virialized galaxy clusters. X-ray and Sunyaev–Zel’dovich (SZ) observations have been widely used to identify clusters and protoclusters in the early universe, up to z ≈ 2.5, that are either gravitationally collapsed or in the process of collapsing11,12,13,14,15,16,17,18,19. However, detecting protoclusters within the first billion years of the universe (z ≳ 5.5) remains a great challenge. At these early epochs, halos may not yet have experienced substantial virial heating (that is, shocks that bring the gas up to the virial temperature of the halo) or may only be in their earliest stages1,3. This makes observing the faint hot ICM, the key signature of the onset of virial heating, difficult. Therefore, identifying the first protoclusters undergoing virialization necessitates a multi-wavelength effort. Although overdensity measurements reveal dense galaxy environments, unambiguous confirmation of the onset of gravitational collapse comes from the detection of ICM20,21,22. In this work, we extend this approach by using JWST and Chandra data to investigate an even earlier protocluster, merely one billion years after the Big Bang.
JWST observations have revolutionized the study of high-redshift structures by identifying substantial populations of faint and distant galaxies23,24,25. Its near-infrared imaging capability and accurate photometric redshifts allow the identification of galaxy overdensities, paving the way for detecting the earliest protoclusters. In the JADES field26, one of JWST’s premiere regions, six protocluster candidates were identified in the redshift range z = 5–7 (ref. 8). Of these protoclusters, JADES-ID1 is the most compelling candidate, exhibiting high galaxy overdensity and cluster membership likelihood. A total of 66 galaxies are identified as potential members, with an inferred halo mass of \(\log ({M}_{{\rm{h}}}/{M}_{\odot })=13.2{8}_{-0.34}^{+0.37}\), the highest among the JADES fields8. Because only JADES-ID1 has the richness and halo mass to produce a detectable ICM signal in the JADES field, our X-ray analysis targets this protocluster candidate. The Chandra Deep Field South (CDFS)/JADES field uniquely combines deep JWST imaging with the deepest Chandra exposure over a single footprint, making it at present the only survey volume in which X-ray emission from the ICM of high-redshift protoclusters could, in principle, be detected. Further details on the identification of JADES-ID1 and quantitative tests ruling out the presence of projected foreground galaxy groups and clusters are presented in Methods section ‘JWST characterization of the JADES-ID1 protocluster’.
Within a projected radius of 42″ (≈250 kpc) around the JADES-ID1 centroid, we measure the local galaxy overdensity of δgal = 3.9 relative to the mean galaxy density across the JADES field at the same redshift slice8. In the inner 21″ (≈125 kpc) region (coinciding with the detected X-ray emission), the overdensity increases to δgal = 4.5. This corresponds to a 4.2σ overdensity detection (for details, see Methods section ‘JWST characterization of the JADES-ID1 protocluster’). At z ≈ 5.7, this overdensity is exceptionally rare. Above z >5 , the expected amplitude of galaxy overdensities falls off sharply owing to the declining galaxy number density, increasing photometric incompleteness and the fact that large-scale structure has had less time to collapse. Although the large galaxy overdensity associated with JADES-ID1 indicates a nascent protocluster, X-ray data can confirm whether the virialization has begun. Indeed, detecting hot ICM, best accomplished through sensitive X-ray imaging, can trace the gravitational potential of the protocluster and allows a more precise determination of its centroid, luminosity and total mass.
To examine the X-ray-emitting properties of JADES-ID1, we used deep Chandra Advanced CCD Imaging Spectrometer (ACIS-I) X-ray observations of the CDFS. The CDFS overlaps with the JADES field and is the site of the deepest X-ray observation ever conducted27,28. The data were analysed with CIAO tools29. First, the 99 individual observations (Extended Data Table 1) were reprocessed with the chandra_repro tool. These observations were then merged into a single event file, which had a total exposure time of 6.55 Ms. Next we generated images and their corresponding exposure maps in the 0.5–2.0-keV and 3–7-keV energy ranges. Bright X-ray point sources were excluded from the analysis. A complete description of the data analysis is presented in Methods section ‘Chandra data analysis’.
Figure 1 presents a multi-wavelength view of the JADES-ID1 protocluster and its surroundings. Although the JWST data reveal a galaxy overdensity at z ≈ 5.7, an initial inspection of the exposure-corrected 0.3–2.0-keV Chandra image does not show bright X-ray emission cospatial with JADES-ID1. It also indicates that none of the high-redshift galaxies are detected as individual X-ray point sources and a stack of the galaxy positions likewise shows no statistically significant signal (Methods section ‘Excluding alternative origins of the X-ray emission’). To better assess the presence of faint diffuse emission expected from a z ≈ 5.7 protocluster, we carry out an in-depth imaging analysis. To do this, we first filled the location of the excluded point sources using the dmfilth tool using the ‘global’ method. Next we subtracted the background components using an annulus with 40″–110″ radii around JADES-ID1 (Methods section ‘Chandra data analysis’). Finally, we applied Gaussian smoothing to the image with a kernel size of 15 pixels.
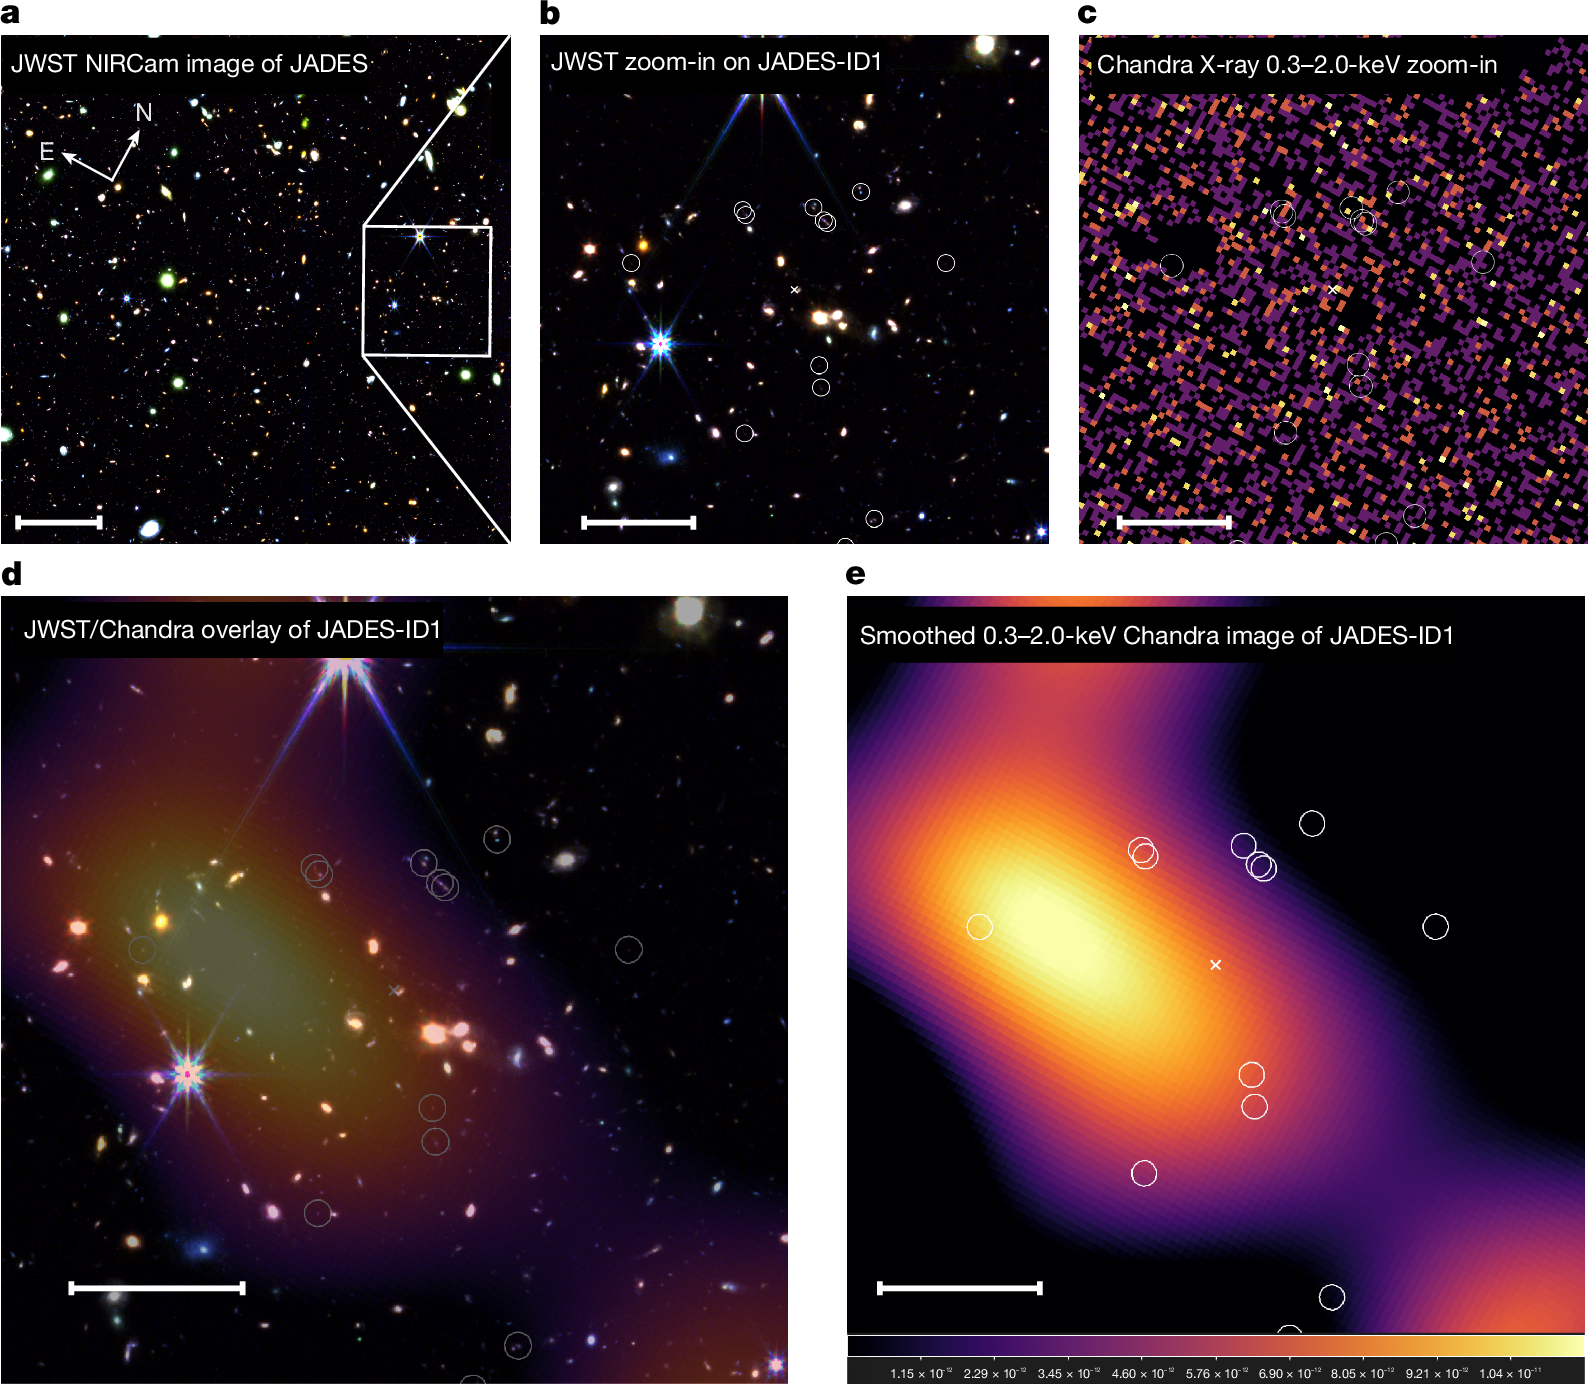
a, Composite JWST image of the JADES field with a 45″ × 45″ (265 × 265 kpc) box marking JADES-ID1. Scale bar, 30″. b, Zoom-in on that region. Scale bar, 10″. c, The exposure-corrected 0.3–2.0-keV band Chandra image of the same region. Scale bar, 10″. d, A JWST/Chandra overlay of JADES-ID1, in which the Chandra image has been processed by filling point sources, subtracting the background and applying Gaussian smoothing with a kernel size of 15 pixels. Scale bar, 10″, 59 kpc at z = 5.68. e, The same processed Chandra image, with the locations of likely cluster member galaxies highlighted. The Chandra image reveals extended X-ray emission that is spatially coincident with the galaxy overdensity identified by JWST. Scale bar, 10″.
The resulting image, shown in Fig. 1e, indicates that large-scale diffuse X-ray emission is present near the JWST-derived centroid. We find that the X-ray centroid (RA = 3 h 32 min 31.75 s, dec = −27° 46′ 51.5″) is offset by about 8″ (about 47 kpc) from the galaxy overdensity peak. Such separations are commonly observed in dynamically young or merging systems. Systematic studies of disturbed clusters find mean X-ray/optical offsets of about 75 kpc, with offsets reaching and exceeding roughly 100 kpc in the most unrelaxed cases30,31,32. Even high-redshift systems, which are still in the early stages of collapse or undergoing mergers, exhibit comparable offsets13,19. Furthermore, owing to the broad Gaussian smoothing kernel (15 Chandra pixels or 7.4″) applied to enhance faint emission, our X-ray centroid is uncertain at the few arcsecond level. The 0.3–2.0-keV Chandra image nonetheless clearly shows extended emission spatially coincident with the galaxy overdensity, suggesting the presence of a large-scale hot ICM. Motivated by the detection of extended emission, we quantify this emission through a multi-faceted approach: (1) we establish its extended nature by constructing a surface brightness profile; (2) we examine its presence in different X-ray energy ranges; and (3) we examine its spectral properties. We note that the unsmoothed, point-source-masked image was used for the further quantitative analysis.
To quantify the large-scale diffuse ICM emission associated with JADES-ID1, we constructed an exposure-corrected, azimuthally averaged surface brightness profile from the unsmoothed, point-source-masked 0.3–2.0-keV band Chandra image, centred on the X-ray centroid. The background was measured in an annulus with 40″–110″ (235–646 kpc at z = 5.68) radii. For the background subtraction, we accounted separately for vignetted (Milky Way foreground plus unresolved cosmic X-ray background) and non-vignetted (particle background) components by generating two exposure maps: one includes mirror vignetting and detector effects and the other only includes detector effects. We applied each map to its corresponding background components (see Methods section ‘Chandra data analysis’ for details). We also verified that the resulting surface brightness profile is insensitive to the exact choice of background region. The background-subtracted surface brightness profile, presented in Fig. 2, reveals extended X-ray emission within about 21″ (≈125 kpc) and a declining trend with radius from the centre. Beyond this radius, the signal-to-noise ratio declines and the emission becomes consistent with the background. Fitting this surface brightness profile with a β-model with fixed β = 0.6 yields a core radius of rc = 7.1″ ± 3.9″ (42 ± 23 kpc). The observed 0.3–2.0-keV band emission is much more extended than the Chandra point spread function (90% of the encircled is contained within 1″), confirming the truly extended nature of this emission.
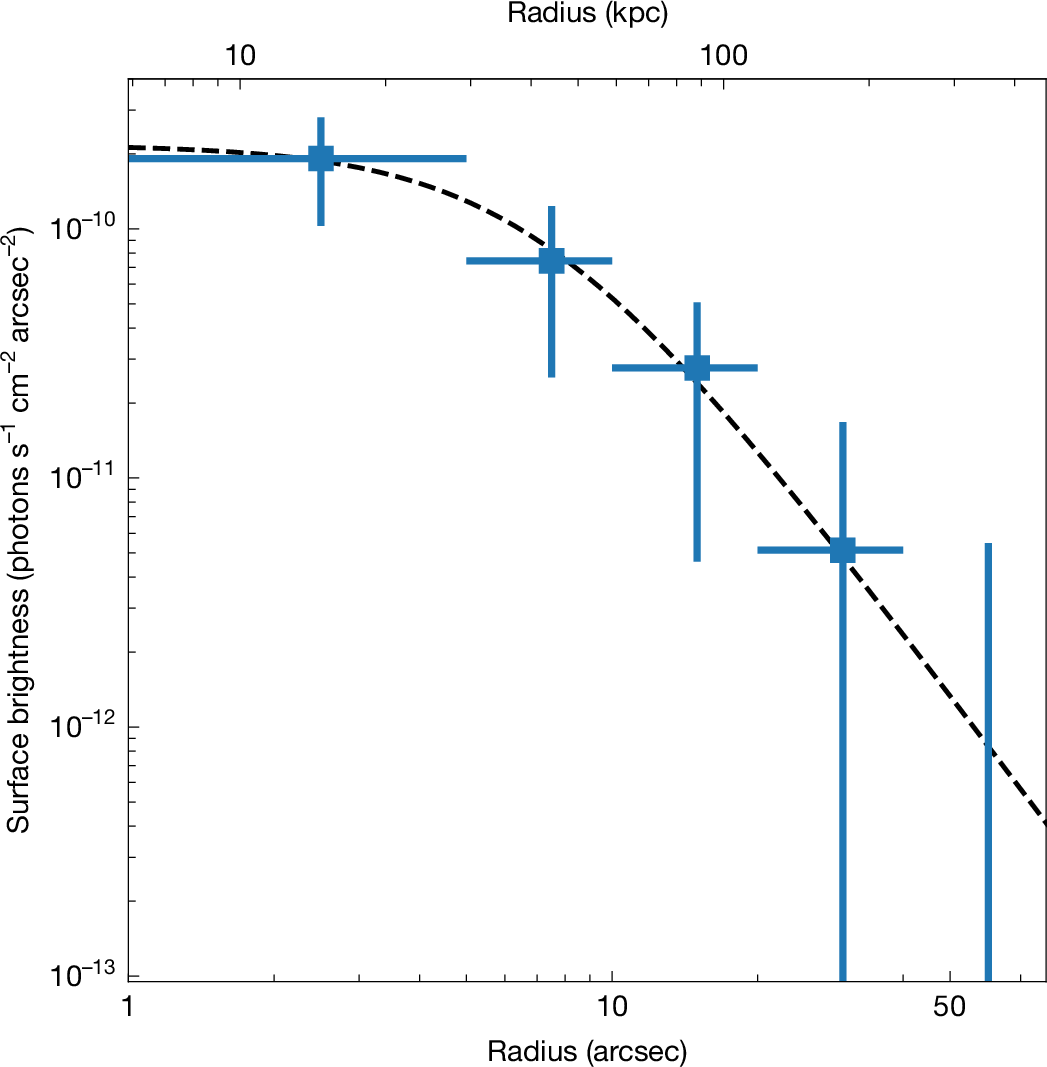
The 0.3–2.0-keV band profile was extracted in concentric annuli centred on the X-ray peak. The dashed line shows the best-fit β-model. The profile is corrected for exposure variations using the exposure map. The background is subtracted on the basis of the 40″–110″ (235–646 kpc at z = 5.68) annulus around the protocluster. The resulting background level is 8.03 × 10⁻¹⁰ photons s−1 cm−2 arcsec−2. Extended emission is detected out to approximately 21″ (≈125 kpc). The error bars represent statistical uncertainties derived using the Gehrels approximation58.
Within a 21″ aperture (≈125 kpc) of the JWST-derived centroid, in which the signal-to-noise ratio peaks, we measure 142 ± 45 net counts and 1,858 background counts, supporting the detection of an extended ICM. If this emission originates from plasma with a few keV temperature, we do not expect to detect X-ray emission in the 3–7-keV band. Indeed, at z ≈ 5.68, the observed 3–7-keV band corresponds to the 20.0–46.8-keV band in the rest frame of the cluster, in which such thermal emission is negligible. In agreement with this, the 3–7-keV band surface brightness profile does not show statistically significant X-ray emission in the same aperture. We detect only 51 ± 55 net counts and 2,947 background counts, consistent with the interpretation that the detected 0.3–2.0-keV band emission originates from a hot ICM.
Because of the relatively low count rate and the limited signal-to-noise ratio, extracting and fitting an X-ray spectrum of JADES-ID1 is not feasible. Instead, we investigate the spectral properties of the diffuse X-ray emission by calculating an X-ray hardness ratio HR = S/H, in which S and H correspond to the counts in the 0.5–1.2-keV and 1.2–2.0-keV bands, respectively (for details, see Methods section ‘X-ray hardness ratios’). Within the same 21″ source region, we obtain \({\rm{HR}}=1.8{4}_{-1.84}^{+1.96}\). Although the large uncertainties only allow a broad estimate, these values imply an ICM temperature of at least about 2.5 keV, consistent with a hot protocluster.
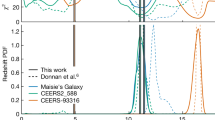
We next combine the key X-ray observables—the 0.3–2.0-keV band detection, the 3–7-keV band non-detection and the declining surface brightness profile—into a combined likelihood map. This map quantifies the likelihood of random fluctuation mimicking all of these observational signatures simultaneously. For details on this map, see Methods section ‘Detection significance map’. In this map, shown in Fig. 3, JADES-ID1 stands out as the highest likelihood detection. Specifically, we find that the combined likelihood of detecting a statistical fluctuation with these parameters is 2.6 × 10⁻⁷, which corresponds to a 5.0σ detection. Although a few other regions also show elevated values on this map, those may trace structures at lower redshifts or they could represent statistical fluctuations. Thus, we conclude that the detected diffuse emission most likely originates from hot ICM associated with the JADES-ID1 protocluster. Finally, we combine the JWST-based overdensity significance (≈4.2σ)8 and Chandra X-ray detection likelihood (≈5.0σ) to establish the overall confidence level for JADES-ID1. We thus obtain a joint P-value of 3.4 × 10⁻¹², which corresponds to a 6.9σ detection.
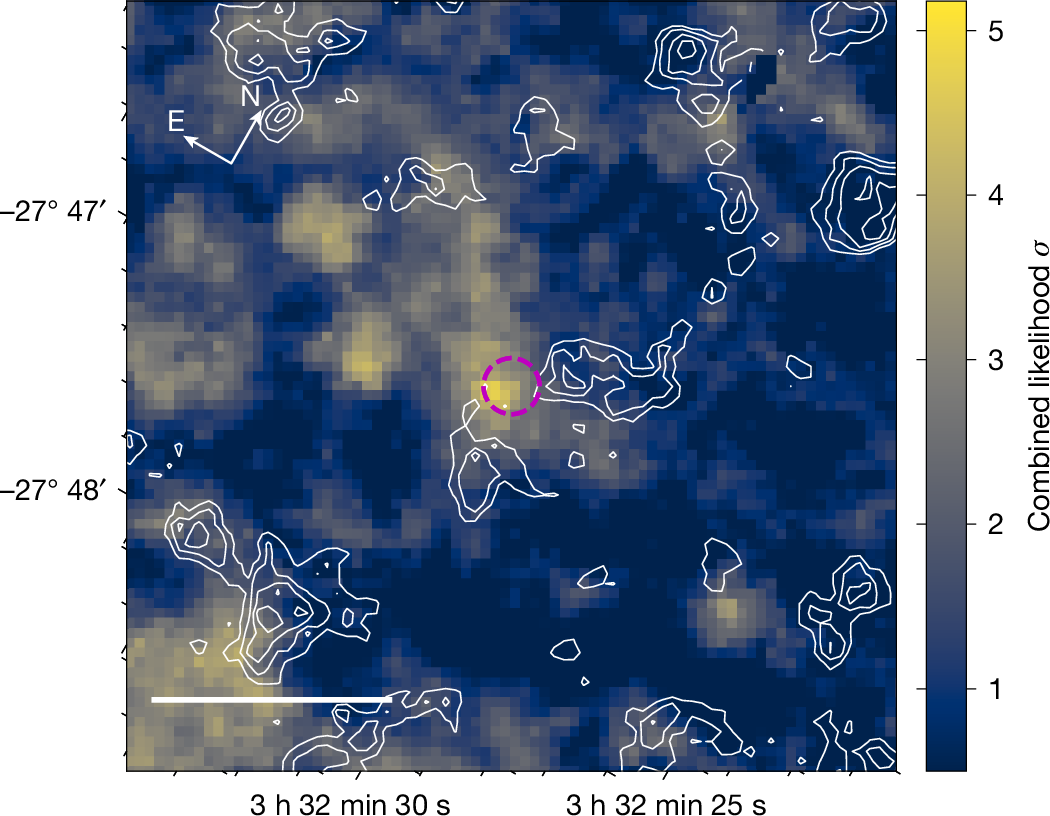
White contours show the 3–7-keV band emission. The map incorporates the probability of having a 0.3–2.0-keV band detection, a 3–7-keV band non-detection and a radially declining surface brightness profile. The position of the protocluster is highlighted with a magenta circle with 7″ radius. Scale bar, 1′ = 354 kpc.
On the basis of the detection of hot ICM associated with JADES-ID1, we derive the X-ray luminosity and total mass of the protocluster. For this, we use the net count rate within a 21″ radius, along with the Chandra exposure maps to calculate the X-ray flux. We assume an optically thin thermal plasma emission model with kT = 2 keV temperature, Z = 0.3 Z⊙ metallicity33,34 and a galactic hydrogen column density of NH = 6.7 × 1019 cm−2 (ref. 35). This yields an absorption-corrected 0.3–2.0-keV band X-ray flux of fX = (4.6 ± 1.5) × 10−16 erg s−1 cm−2. Using the redshift of z = 5.68 and applying a bolometric correction, we obtain a bolometric (0.01–100 keV) luminosity of \({L}_{{\rm{bol}}}=(1.{5}_{-0.6}^{+0.5})\times 1{0}^{44}\,{\rm{erg}}\,{{\rm{s}}}^{-1}\). To estimate the total mass and ICM temperature of the protocluster, we assume self-similar evolution and apply the Lbol–M500 and Lbol–kT scaling relations obtained for ‘all clusters’ in the sample of ref. 36. These result in a gas temperature of \(kT=2.{7}_{-0.7}^{+0.5}\,{\rm{keV}}\), which is consistent with the lower limit from the analysis of the X-ray hardness ratio. Finally, on the basis of the luminosity, we estimate a total cluster mass of \({M}_{500}=(1.{8}_{-0.7}^{+0.6})\times 1{0}^{13}\,{M}_{\odot }\), which corresponds to R500,c ≈ 80 kpc at z = 5.68. We note that the uncertainties include the statistical errors on the flux measurements and the uncertainties on the scaling relation parameters. However, these estimates carry several caveats. First, the assumption of self-similar evolution may not fully capture deviations from the scaling relations at high redshift, in which protoclusters are still assembling and undergoing early-stage accretion. Second, if JADES-ID1 is experiencing mergers or shocks, its ICM temperature and luminosity could be elevated37,38,39,40,41,