Sea level much higher than assumed in most coastal hazard assessments
TL;DR
Most coastal hazard assessments incorrectly assume global geoid models represent actual sea level, leading to significant underestimation of coastal sea-level height, especially in the Global South. This error results in flawed projections of land and population exposure to sea-level rise.
Key Takeaways
- •Over 99% of coastal hazard assessments inadequately handle sea-level and land elevation data, misjudging sea level relative to coastal elevation.
- •Measured coastal sea level is often higher than assumed in assessments, with mean offsets of 0.27 m (EGM96) and 0.24 m (EGM2008), and regional differences exceeding 1 m in areas like Southeast Asia.
- •Using measured sea levels instead of geoid-based assumptions increases estimates of land and people below sea level by 31–37% and 48–68%, respectively, for a hypothetical 1 m sea-level rise.
- •The widespread omission of proper vertical datum conversion and sea-level data integration highlights a critical need for improved research standards and re-evaluation of existing coastal impact assessments.
Tags
Abstract
The impacts of sea-level rise and other hazards on the coasts of the world are determined by coastal sea-level height and land elevation1. Correct integration of both aspects is fundamental for reliable sea-level rise and coastal hazard impact assessments2,3, but is often not carefully considered or properly performed. Here we show that more than 99% of the evaluated impact assessments handled sea-level and land elevation data inadequately, thereby misjudging sea level relative to coastal elevation. Based on our literature evaluation, 90% of the hazard assessments assume coastal sea levels based on geoid models, rather than using actual sea-level measurements. Our meta-analyses on global scale show that measured coastal sea level is higher than assumed in most hazard assessments (mean offsets [standard deviation] of 0.27 m [0.76 m] and 0.24 m [0.52 m] for two commonly-used geoids). Regionally, predominantly in the Global South, measured mean sea level can be more than 1 m above global geoids, with the largest differences in the Indo-Pacific. Compared with geoid-based assumptions of coastal sea level, the measured values suggest that with a hypothetical 1 m of relative sea-level rise, 31–37% more land and 48–68% more people (increasing estimates to 77–132 million) would fall below sea level. Our results highlight the need for re-evaluation of existing coastal impact assessments and improvement of research community standards, with possible implications for policymakers, climate finance and coastal adaptation.
Main
Sea-level rise (SLR) poses a high risk to vast coastal lowlands around the world, including low-elevated and populous river deltas and coastal plains. According to the Intergovernmental Panel on Climate Change (IPCC) assessment report 6 (AR6) (shared socioeconomic pathway (SSP)1-1.9 to SSP5-8.5)4, global mean sea level (MSL) is projected to rise between 0.28 m and 1.01 m by 2100 compared with that in 1995–2014. Including deep uncertainties in the polar ice-sheet dynamics, these projections could increase by several metres4. This rise is amplified by negative vertical land motion, that is, land subsidence, a natural but increasingly human-accelerated phenomenon in coastal lowlands5,6, which drives higher rates of relative sea-level rise (RSLR)7,8. Consequently, the impacts of RSLR and coastal (and compound) flooding are closely related to coastal elevation relative to sea level. Assessing coastal exposure and vulnerability consequently requires the use of elevation information, commonly provided by digital elevation models (DEMs). Constituting the fundamental base of any such impact and exposure assessment, the quality (mainly vertical accuracy and spatial resolution) of the DEMs is fundamental to the accuracy and reliability of the derivatives and widely addressed in scientific literature (see, for example, ref. 9).
Although high-quality elevation information, for example, acquired through airborne lidar, is available in several regions of the Global North (see, for example, ref. 10), the best available elevation data for the vast majority of the coastal areas worldwide is satellite-based. The global availability of satellite-based elevation data enabled unprecedented (global) SLR and coastal hazard studies (see, for example, ref. 11). However, spaceborne DEMs can have vertical errors up to several metres, contain sensing or interpolation artefacts, or are outdated, thereby affecting the quality of coastal hazard assessments, especially in flat, subsiding coastal plains and densely populated river deltas10,12,13. Apart from considering vertical uncertainty of elevation data, using DEMs in coastal hazard assessments requires correctly combining coastal elevation with local sea-level height and the proper conversion to a common vertical reference frame2,3. Through a systematic review evaluating recent SLR impacts and coastal hazard assessment studies, we found that these crucial steps were often not considered or performed incorrectly. Rather than considering actual, local sea-level height, coastal sea level is most often assumed to equal (an often outdated) global geoid (or in some instances even ellipsoid), to which open-access global DEMs are typically referenced when provided.
A geoid is an equipotential surface model that approximates MSL based on gravity and the rotation of Earth. As geoid quality depends on gravity observations, uncertainties in global geoid models can range up to several metres in regions that suffer from gravitational data paucity (see, for instance, refs. 14,15), predominantly located in the Global South. Moreover, actual sea-surface height is not just determined by the gravity and rotation of Earth, but also by, for example, ocean currents and large-scale circulation, winds, tides, seawater temperature and salinity. As a result, time-average sea-surface height can deviate strongly (up to several metres) from a geoid, and its difference is the so-called mean dynamic topography (MDT).
The widespread omission to properly reference coastal elevation to measured local sea level generally leads to an underrepresentation of actual coastal sea-level height in (global) SLR and coastal hazard assessments and can introduce errors with magnitudes as large as a century of projected SLR for affected regions in the world2,3. By means of meta-analyses, we quantify the implications of the most-frequently encountered omissions or errors (that is, incorrect or absent vertical datum conversion) on estimates of exposed people and coastal area at global and regional scales. To evaluate the broader implications of our findings, we quantified the magnitude of potential underestimation or misjudgement in assessment studies included in the most recent IPCC AR6 reports.
To facilitate proper, future (re)assessments of coastal hazard impacts, we converted several state-of-the-art global DEMs to coastal sea-level height and provided them ready for use (see Data availability and Code availability sections). We conclude with concrete recommendations, such as data documentation guidelines and peer-review checklists, to ensure correct vertical datum alignment in future publications and improve community research standards. Herewith, we aim to eliminate future propagation of erroneous methodologies that caused this community-wide blind spot and resulted in widespread underestimations of coastal SLR and hazard impact assessments.
Most coastal hazard studies lack rigour
We evaluated 385 peer-reviewed, scientific publications (systematically selected through a PRISMA-guided literature search, published between 2009 and 2025, with >53% in the past 5 years) on SLR and/or RSLR and coastal flood exposure, vulnerability and risk, presenting both global and regional hazard assessments. We scrutinized each for the correctness of DEM usage, vertical datum conversion and proper integration of sea-level height and coastal elevation and documented the ubiquity of errors and omissions (see the Methods for details; see also Extended Data Fig. 1, Supplementary Figs. 1–3, Supplementary Tables 1 and 2 and Supplementary Data 1). The evaluated coastal hazard assessment literature investigates coastal settings all over the world and across spatial scales. The impact assessments focused on SLR and/or RSLR (14%), storm surge (8%), tsunami (8%), coastal exposure, vulnerability and/or risk more in general (41%), or included combinations of different single-type coastal hazards, exposure, vulnerability and/or risk assessments and technical aspects and methodological advancements (29%). The evaluated literature includes studies from data-sparse coastal lowlands in Africa (14%) and Asia (58%), which are severely affected by RSLR and coastal flooding16, poor data availability and accessibility as well as data inaccuracy due to the comparably poor performance of global Earth gravity models (see, for example, ref. 17). Moreover, the evaluated literature includes high-impact, global hazard assessments (10%), which dictate the contemporary scientific understanding of global coastal hazard impacts.
In the bulk of the evaluated publications (73%), documentation of used sea-level height, coastal elevation and vertical datums is either incomplete (13%) or entirely missing (60%) (Fig. 1). Although 27% of the literature correctly documented the vertical datum(s) used, only 1% correctly described and aligned coastal sea-level height information to the land elevation data. For the vast majority of evaluated assessments, sea level and coastal elevation alignment and datum conversion description were absent, and conversion was probably omitted (90.6%). In the remaining studies, the description was often incomplete (making the study irreproducible) or described an incorrectly performed conversion (8.6%). Correct alignment of elevation data from global DEMs to sea level requires a vertical datum conversion in combination with additional sea-level data, either a local sea-level datum (for example, local tide gauge and/or national sea-level-aligned datum) or global ocean surface topography (for example, satellite altimetry and/or buoys combined product such as MDT). We expect that authors aware of the necessity and with the expertise to successfully perform a vertical datum conversion using additional sea-level data do properly document these crucial (and often time-consuming) methodological steps and additional datasets. Therefore, we presume that the absence of any documentation of sea-level information (25%) and/or methodological conversion steps (65%) means that sea-level height data was not included or datum conversion to a sea-level reference was omitted. Repeated evaluation across multiple studies confirmed the validity of this presumption (see, for example, ref. 2) (Supplementary Tables 3–5).
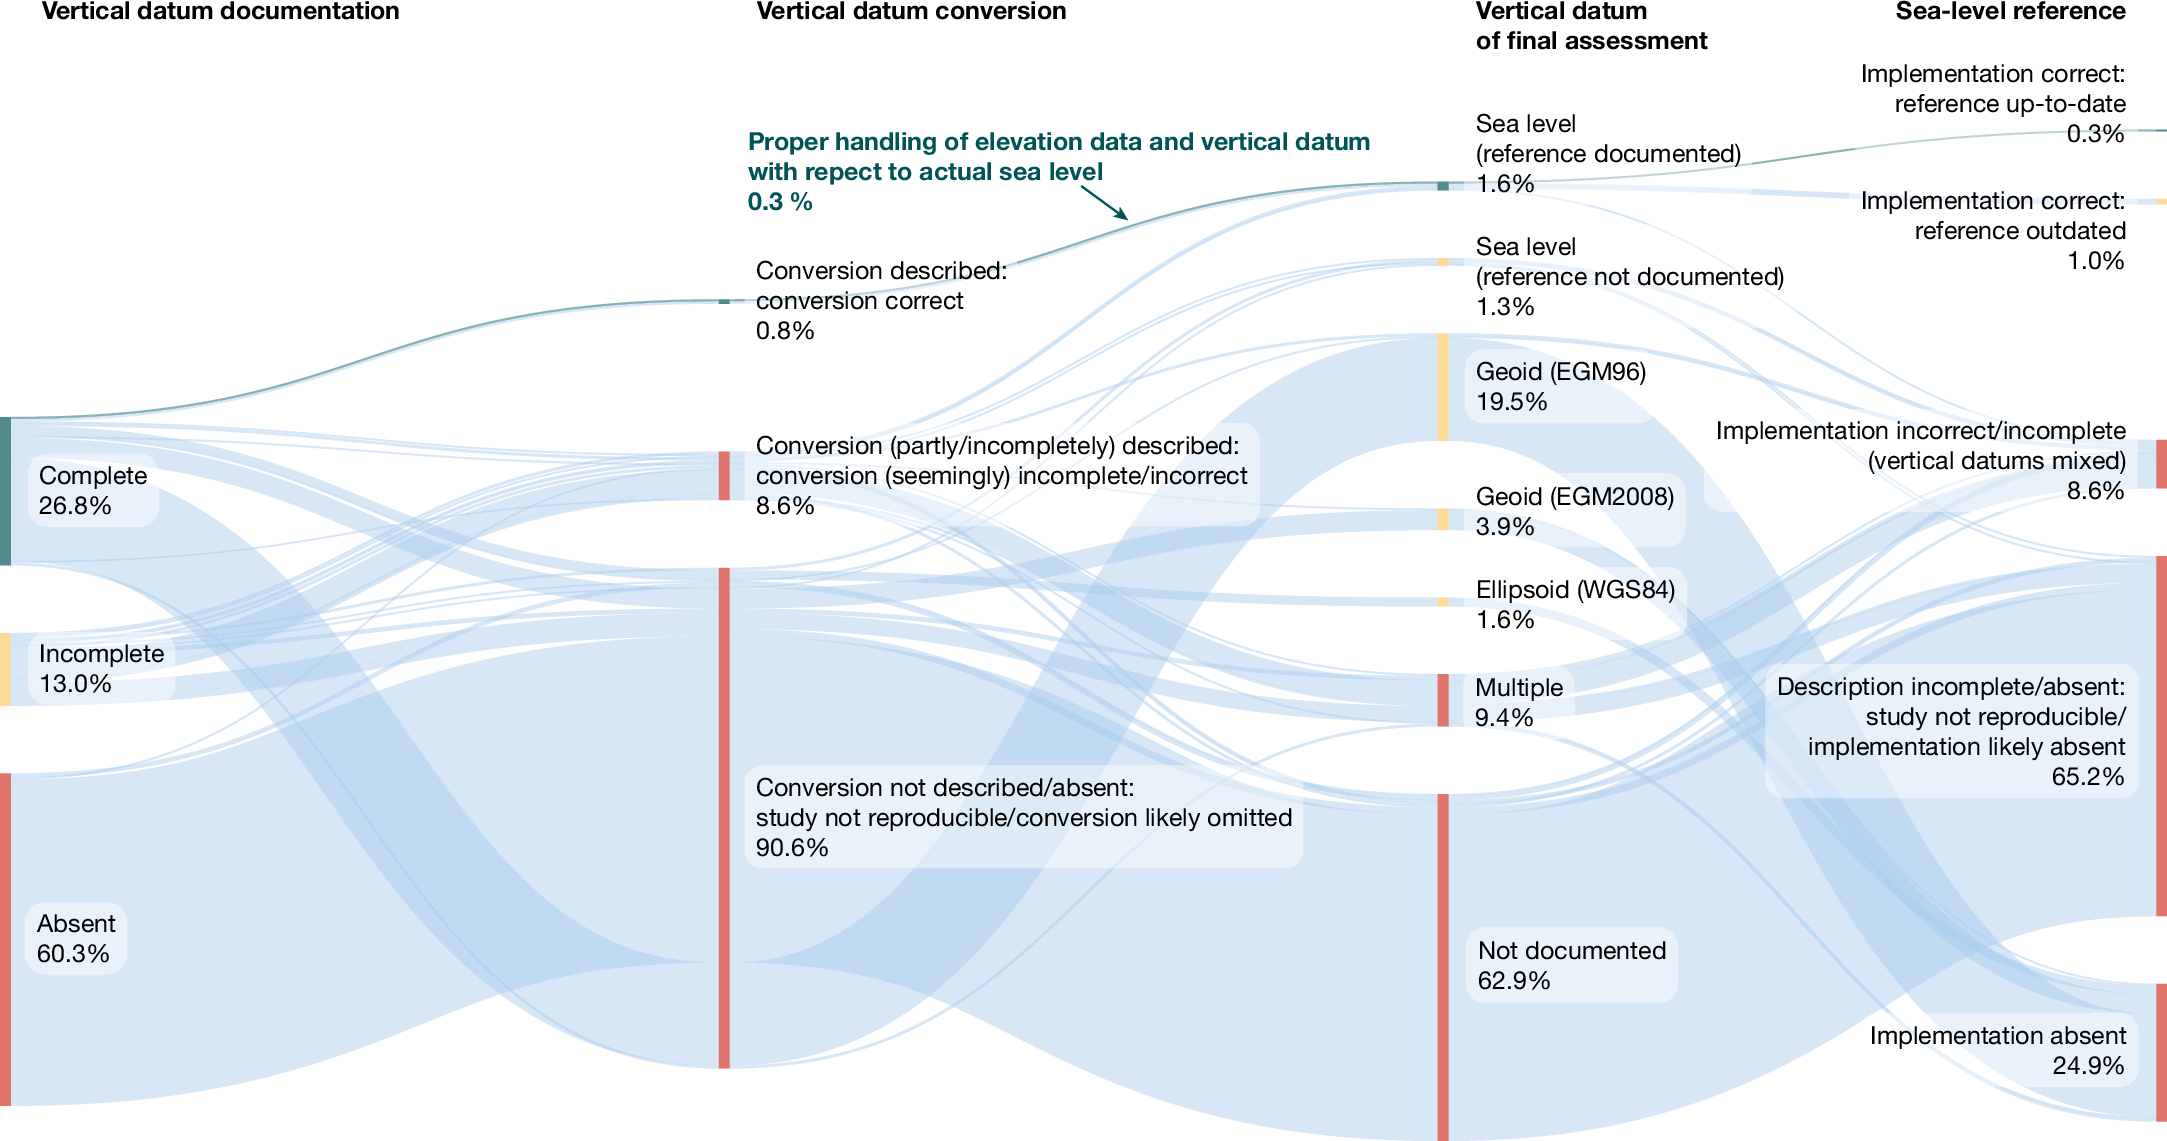
Complete vertical datum documentation means all necessary vertical datum information is provided in the study itself or in the cited references of the data used. Vertical datum conversion is correct if all necessary datum conversion steps required to properly align all data to a common vertical reference are properly described and applied. The correct implementation of a sea-level reference involves the use of sea-level information (for example, MDT or tide gauge data), correctly aligned with all other data used in the assessment in a common vertical reference. A sea-level reference is considered up to date if the latest available sea-level data were used. In 73% of the studies, vertical datum documentation was incomplete or completely absent. In nearly all evaluated assessments, sea-level data and their proper alignment to coastal elevation data were either not documented and datum conversion likely omitted (90.6%; see underlying presumption in main text), or (seemingly) incorrectly performed (8.6%). Only 0.3% of the evaluated studies completely documented, converted and properly adjusted coastal elevation data with sea-level information (shown with green colour). The Sankey diagram for the results of this study was created using SankeyMATIC (https://sankeymatic.com/).
The most prominent issue in the evaluated literature (demonstrably present in 25% and presumingly present in 63% more; Figs. 1 and 2 and Supplementary Fig. 3) was the neglection of datum conversion from geoid (in some cases even ellipsoid) to a sea-level reference, thereby implicitly assuming a geoid height of 0 m to match local sea-level height. Of all literature containing this issue, we encountered only two papers that reflected on the potential discrepancy between geoid and actual sea level8,18. The second most frequent issue (9%) was incomplete, and thereby erroneous, datum conversion and inadequate alignment of vertical datums of datasets involved (for example, land elevation, bathymetry, sea level and heights of coastal infrastructure). This group of literature also contains few studies that pioneered the use of MDT data to create a sea-level reference19,20,21,22, indicating first signs of community awareness on the necessity for correct land–sea-level alignment. Although these studies arguably improved on the bulk of geoid-based studies neglecting sea-level alignment, they suffer from conversion documentation shortcomings and demonstrated20,21,23 incorrect datum conversion (Extended Data Fig. 3). Only one (ref. 13) out of the 385 evaluated studies (0.3%) had complete vertical datum and conversion documentation and contained no conversion and alignment errors.
Apart from evaluating individual studies, our literature evaluation also revealed widespread and persistent propagation of erroneous workflows, for example, omitting sea-level datum conversion24,25 or introducing methodological datum conversion errors19,22,26,27, to consequently affect follow-up studies that apply the same data and processing approach20,21,23,28 (Supplementary Data 1). Similarly, assessments using modelling frameworks that include elevation data in the coastal zone also suffer from the investigated issues such as incomplete or absent vertical datum documentation (see ref. 29, for instance) and datum conversion (for example, ref. 30) and/or lack of a sea-level datum (ref. 31, for instance) (Supplementary Data 1).
Coastal sea level often higher than geoid
We performed several meta-analyses on global and regional scales to quantify the magnitudes of coastal sea-level height misrepresentation stemming from the most-frequently encountered processing omission or errors for the most widely used geoids (Methods and Extended Data Fig. 2). Impact assessments that neglect datum conversion and consequently assume the geoid surface to represent MSL result in a global average underrepresentation of coastal sea-level height as represented by MDT of respectively 0.27 m (median 0.19 m, standard deviation (s.d.) 0.76 m) for the EGM96 and 0.24 m (median 0.16 m, s.d. 0.52 m) for the EGM2008 (Fig. 2, Extended Data Figs. 3 and 4 and Supplementary Figs. 4 and 5), which reflects the values reported in the abstract. In regions in which the respective geoids perform more poorly (for example, higher inaccuracy caused by data paucity), the discrepancies can go up to several metres (5.5–7.6 m for EGM96 and 2.8–3.4 m for EGM 2008) (Fig. 2).
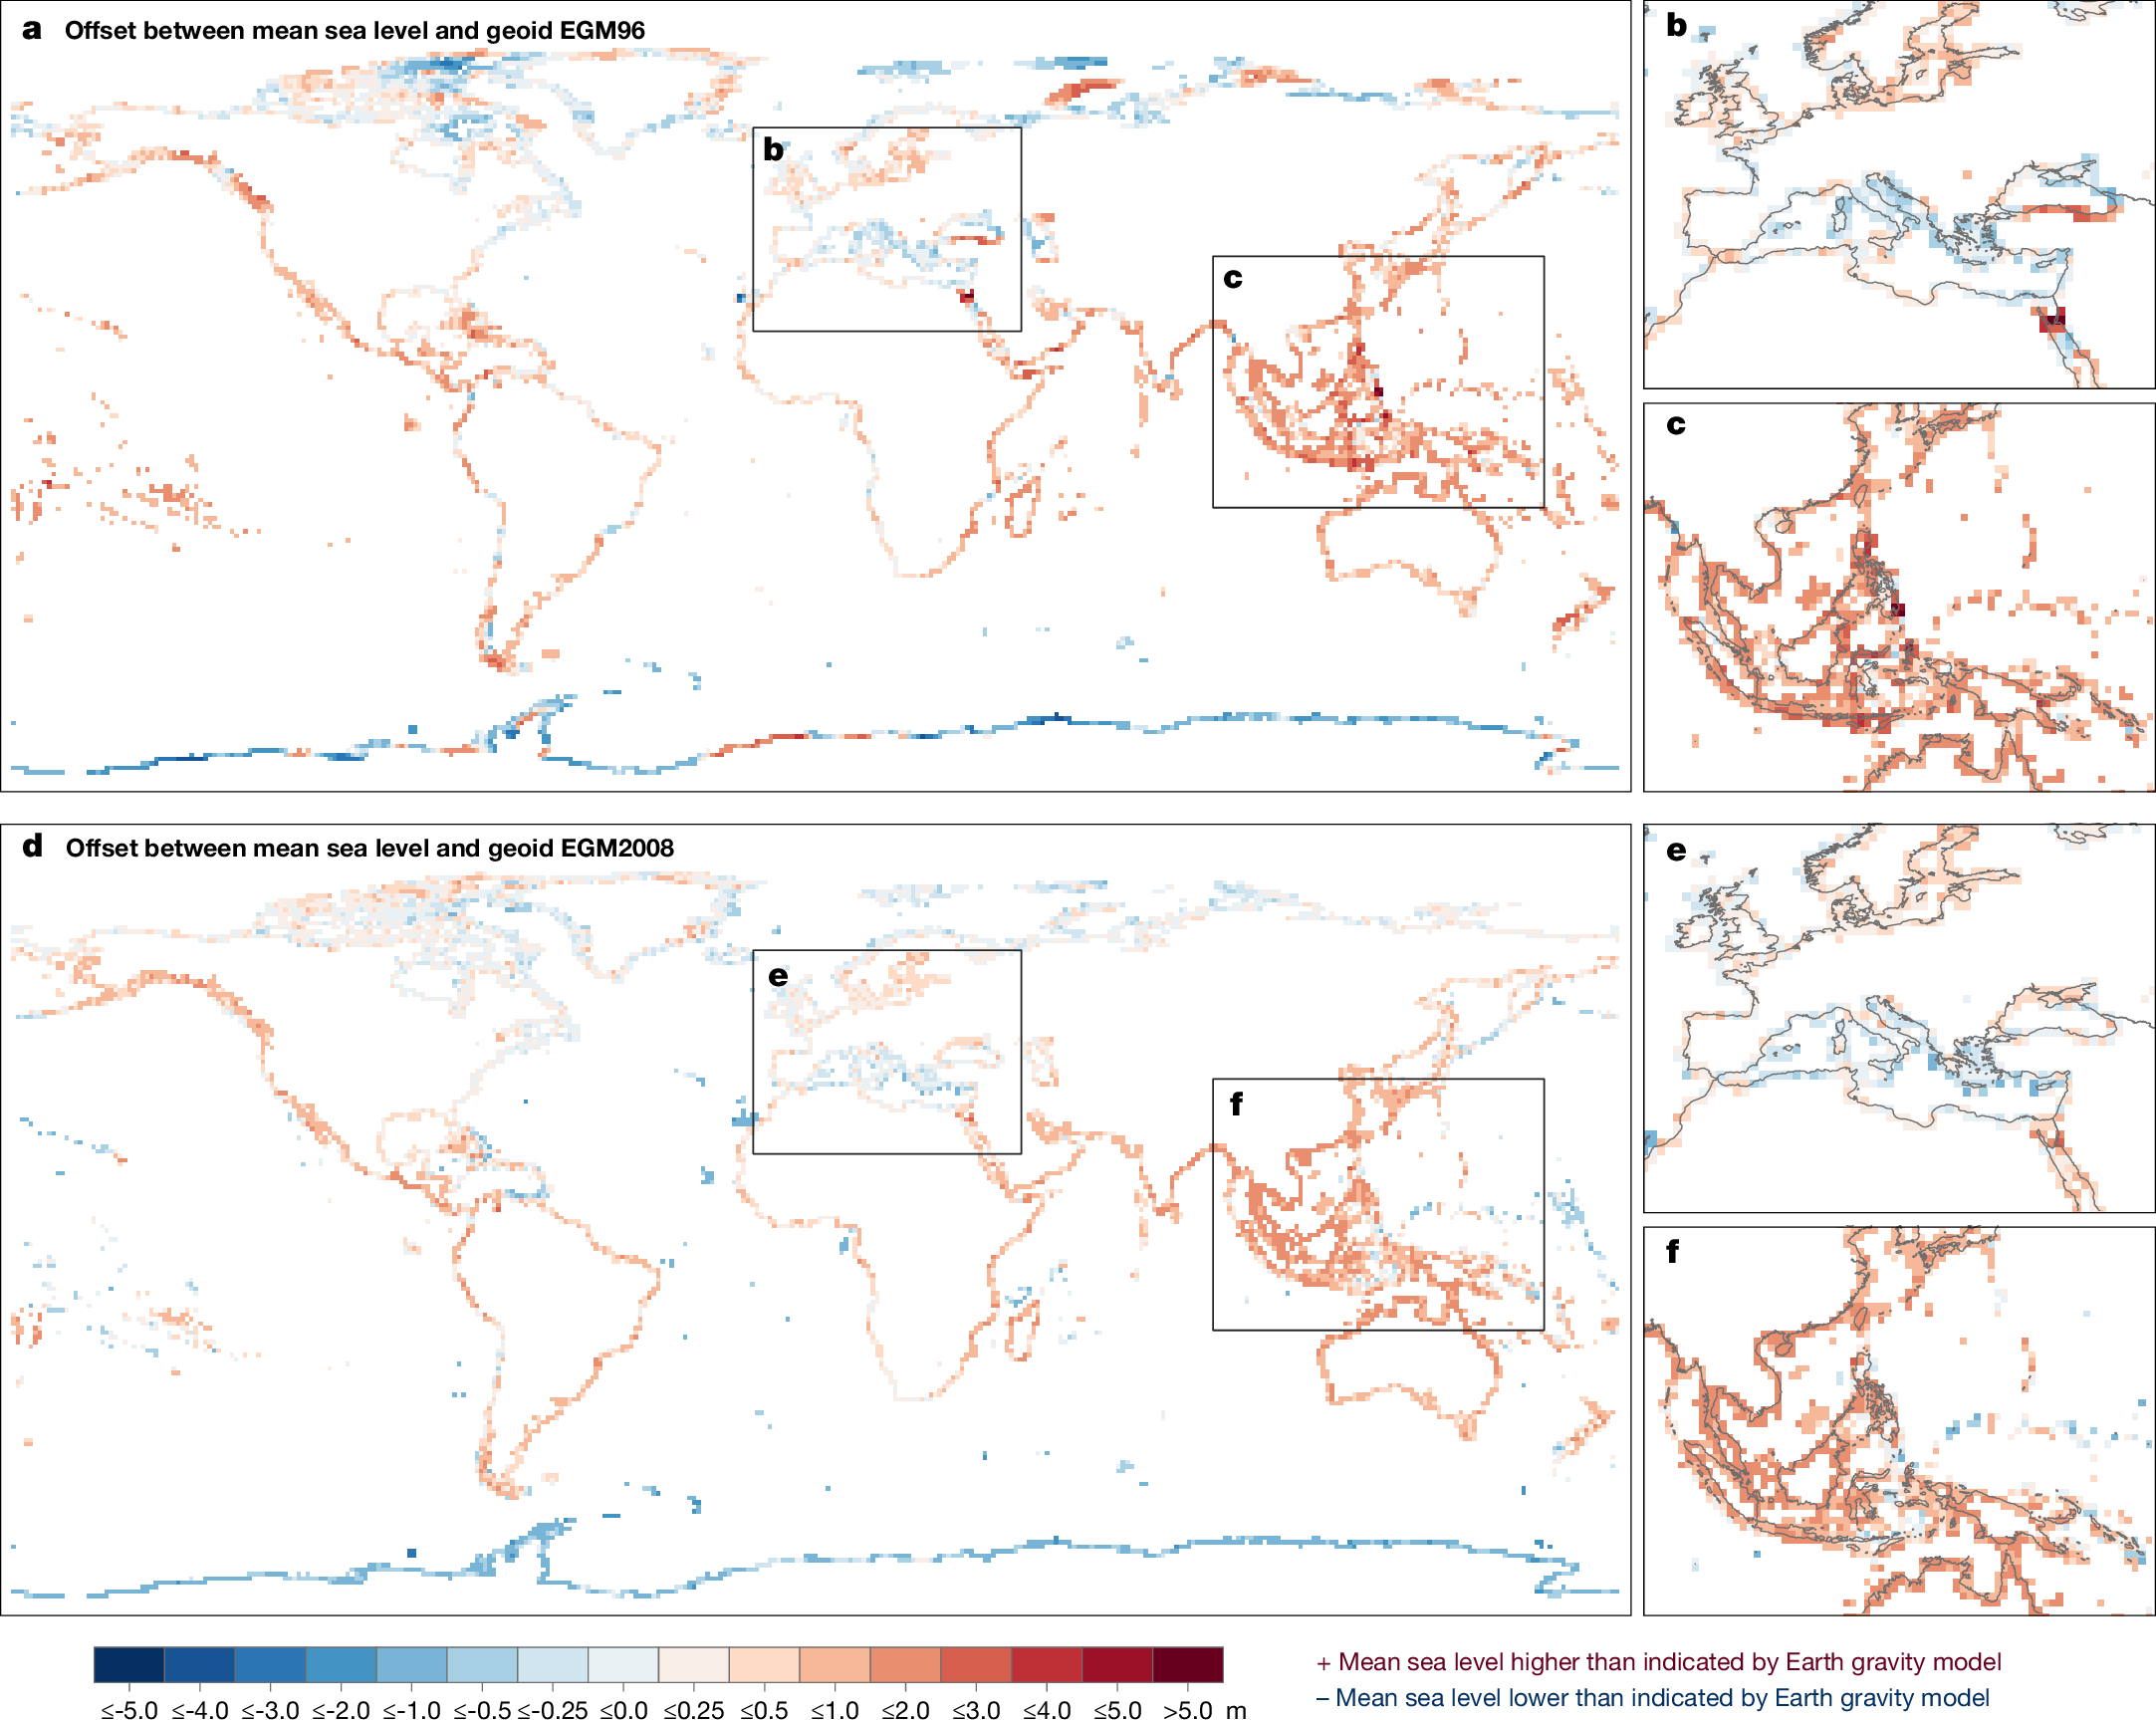
a–c, The still widely used Earth Gravitational Model 1996 (EGM96) shows large deviations from measured coastal sea level, here indicated by the latest available MDT44, especially profound at the regional scale. d–f, The more recent EGM2008 geoid model shows overall improvement over EGM96 and provides globally a slightly better approximation of local coastal sea level. In data-rich countries in the Global North, the global geoids represent coastal sea level relatively well (for example, Eastern United States, Northern Europe and Western Europe), whereas in the more data-sparse Global South, regions such as Latin America, East Africa and the Indo-Pacific, with Southeast Asia and Oceania as global hotspots, the geoids substantially underrepresent actual sea-surface height, ranging from several decimetres up to several metres locally. The vast majority of the evaluated literature assumed the geoid surface (0 m) to represent contemporary local MSL, thereby introducing the above discrepancy as error into their respective coastal hazard and SLR impact assessments. For visualization purposes, the spatial scale of the data shown was resampled to 1° using bilinear resampling, whereas all statistics are given at 90 m spatial resolution. The results were visualized using QGIS v.3.28.6 and shapefiles from ref. 51 (Open Government Licence v.3.0).
Although the global statistics average out the larger regional and sub-regional discrepancies, these seem to be particularly large for several key regions, most located in the Global South. Largest discrepancies are observed in Southeast Asia (hosting large, populous and low-lying river deltas; Extended Data Figs. 6 and 7 and Supplementary Figs. 6 and 7) and the Pacific Region (often lowly-elevated atolls), on average amounting to an underrepresentation of coastal sea level of more than 1 m, as was previously already highlighted in local studies on the Mekong and Ayeyarwady deltas2,3. Other areas with large discrepancies are located in Latin America, the west coast of North America, the Caribbean, Africa, the Middle East and the larger Indo-Pacific. Although, on average, the geoid models underrepresent sea-surface height at global and regional scales, locally the discrepancies can also range in the opposite direction (for example, northern Mediterranean coast, Antarctica and some islands in the Atlantic and the Pacific (EGM2008 only)) (Fig. 2), consequently resulting in an overrepresentation of sea-surface height. The lowest discrepancies between MSL and geoid are prevalent in Eastern North America, as well as Northern and Western Europe (Supplementary Data 2), reflecting the stronger performance of geoid models to approach sea-surface height in data-rich regions in the Global North. Continuous advances in global geoid modelling are reflected by new global geoids (for example, GOCO2025s), but these also contain comparably large discrepancies to MDT-determined MSL (Supplementary Fig. 9), in particular for regions in the Global South. Therefore, omitting to include sea-level information and to properly convert from a geoid to a sea-level datum, especially in data-sparse and remote regions in which geoid and sea level do not align well, immediately transfers these discrepancies (Fig. 3) as errors into hazard and SLR impact assessments24,32,