Plastic landmark anchoring in zebrafish compass neurons
TL;DR
This study reveals that larval zebrafish head direction (HD) neurons in the hindbrain can track visual scene orientation using both landmarks and optic flow, despite lacking an elaborate visual telencephalon. The mapping is experience-dependent and involves a habenula-interpeduncular nucleus pathway, suggesting a Hebbian mechanism similar to fly ring neurons.
Key Takeaways
- •Larval zebrafish HD neurons in the anterior hindbrain can reliably track visual scene orientation, utilizing both visual landmarks and optic flow cues for navigation.
- •The anchoring of HD cells to visual landmarks is idiosyncratic across individuals and experience-dependent, indicating a flexible, non-hardwired mapping.
- •Landmark tracking requires the lateralized projection from the habenula to the interpeduncular nucleus, highlighting a key circuit mechanism in visual cue integration.
- •HD cells can maintain stable head direction representations across multiple visual scenes, demonstrating their capacity for consistent navigation in varied environments.
- •The findings suggest an evolutionarily older, non-telencephalic pathway for visual information routing to HD neurons, shedding light on vertebrate navigation circuitry evolution.
Tags
Abstract
Vision can inform animals as they navigate their environment. Landmarks can be used to maintain heading, while optic flow can be integrated to estimate turning. Although it has been shown that head direction (HD) neurons in various species use these visual cues1,2, the circuit mechanisms underlying this process in vertebrates remain unknown. Here we asked whether and how the recently identified HD cells in the larval zebrafish3, one of the smallest vertebrate models, incorporate visual information. By combining two-photon microscopy with a panoramic virtual reality setup, we demonstrate that the zebrafish HD cells can reliably track the orientation of multiple visual scenes, exploiting both visual landmarks and optic flow cues. The mapping between landmark cues and heading estimates is idiosyncratic across fish and experience dependent. Furthermore, we show that landmark tracking requires the lateralized projection from the habenula to the interpeduncular nucleus4, a structure innervated by HD neuron processes3. The physiological and morphological parallels suggest that a Hebbian mechanism similar to the fly ring neurons5,6 is at work in the habenula axons. Overall, our observation that hindbrain HD cells of larval zebrafish can utilize the visual cues despite the lack of an elaborate visual telencephalon sheds new light on the evolution of navigation circuitry in vertebrates.
Visual motion and landmark position align with heading direction in the zebrafish interpeduncular nucleus
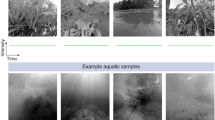
Spatiotemporal visual statistics of aquatic environments in the natural habitats of zebrafish
Two-photon all-optical neurophysiology for the dissection of larval zebrafish brain functional and effective connectivity
Main
Neurons whose activities reflect spatial relationships between animals and their environments have been identified in the brains of diverse animal species7, probably supporting navigation. A simple example of space-tuned cells is HD cells, which persistently fire when animals are facing a particular direction8. Because the head direction of an animal is typically not directly provided to the sensory system, HD cells need to integrate the history of rotational movements that animals make, a process called angular path integration. As a simple, yet biophysically plausible mechanism to implement angular path integration, a class of dynamical models called ring attractors has been proposed9. A ring attractor typically consists of neurons arranged on a topological ring, which excite nearby neurons while inhibiting far away neurons. Such connectivity architecture gives rise to a single, persistent bump of activity on the ring in the absence of external inputs, which can be used to represent the head direction.
More than three decades of research have identified HD cells in various mammalian brain regions10. Yet, it has remained inconclusive where and how the tuning to head directions first emerges. A recent study on the larval zebrafish identified a group of GABAergic (γ-aminobutyric acid-dependent) HD cells in the anterior hindbrain (aHB) rhombomere 1 (ref. 3). This GABAergic nucleus is probably homologous to the mammalian dorsal tegmental nucleus (DTN)11, one of the basal-most brain regions with HD cells in rodents12,13,14. The dendrites and axons of these zebrafish HD cells form topographically organized columns in the dorsal interpeduncular nucleus (dIPN), such that cells tuned to the opposite head directions would inhibit each other, recapitulating a key connectivity motif of ring attractors.
In addition to motor-based angular path integration, animals can also utilize visual cues, such as landmarks and optic flow, to improve their sense of heading1,2. In rodents, cortical visual areas (for example, the retrosplenial cortex) are thought to provide visual information to HD neurons15. However, unlike mammals, the larval zebrafish lacks an elaborate visual telencephalon. This raises the possibility that there exist evolutionarily older, non-telencephalic pathways that route visual information to the HD neurons in the aHB. We therefore set out to ask whether and how the larval zebrafish HD neurons utilize visual cues.
GABAergic aHB cells track visual scene orientation
The aHB rhombomere 1 of the larval zebrafish contains a group of gad1b+ HD neurons3. The preferred headings of these HD cells are topographically arranged, such that when the fish turns rightwards, the bump of neuronal activity moves counterclockwise, as viewed from the top (Fig. 1a). Somewhat surprisingly, the previous study did not detect any effect of visual feedback on the bump movements3. We reasoned that this might be due to the fact that the visual stimuli were presented below the fish. Intuitively, the upper visual field seems to contain more relevant cues for orienting oneself. To achieve a panoramic presentation of visual stimuli covering the upper visual field, we built a compact projection setup composed of a single projector and multiple mirrors16 (Supplementary Video 1). Larvae embedded in agarose observed view-corrected virtual 3D scenes projected onto the planar screens on the three sides, which covered 270° of azimuth and 90° of elevation (Fig. 1b and Methods). The neural activity was optically monitored from above with a two-photon microscope.
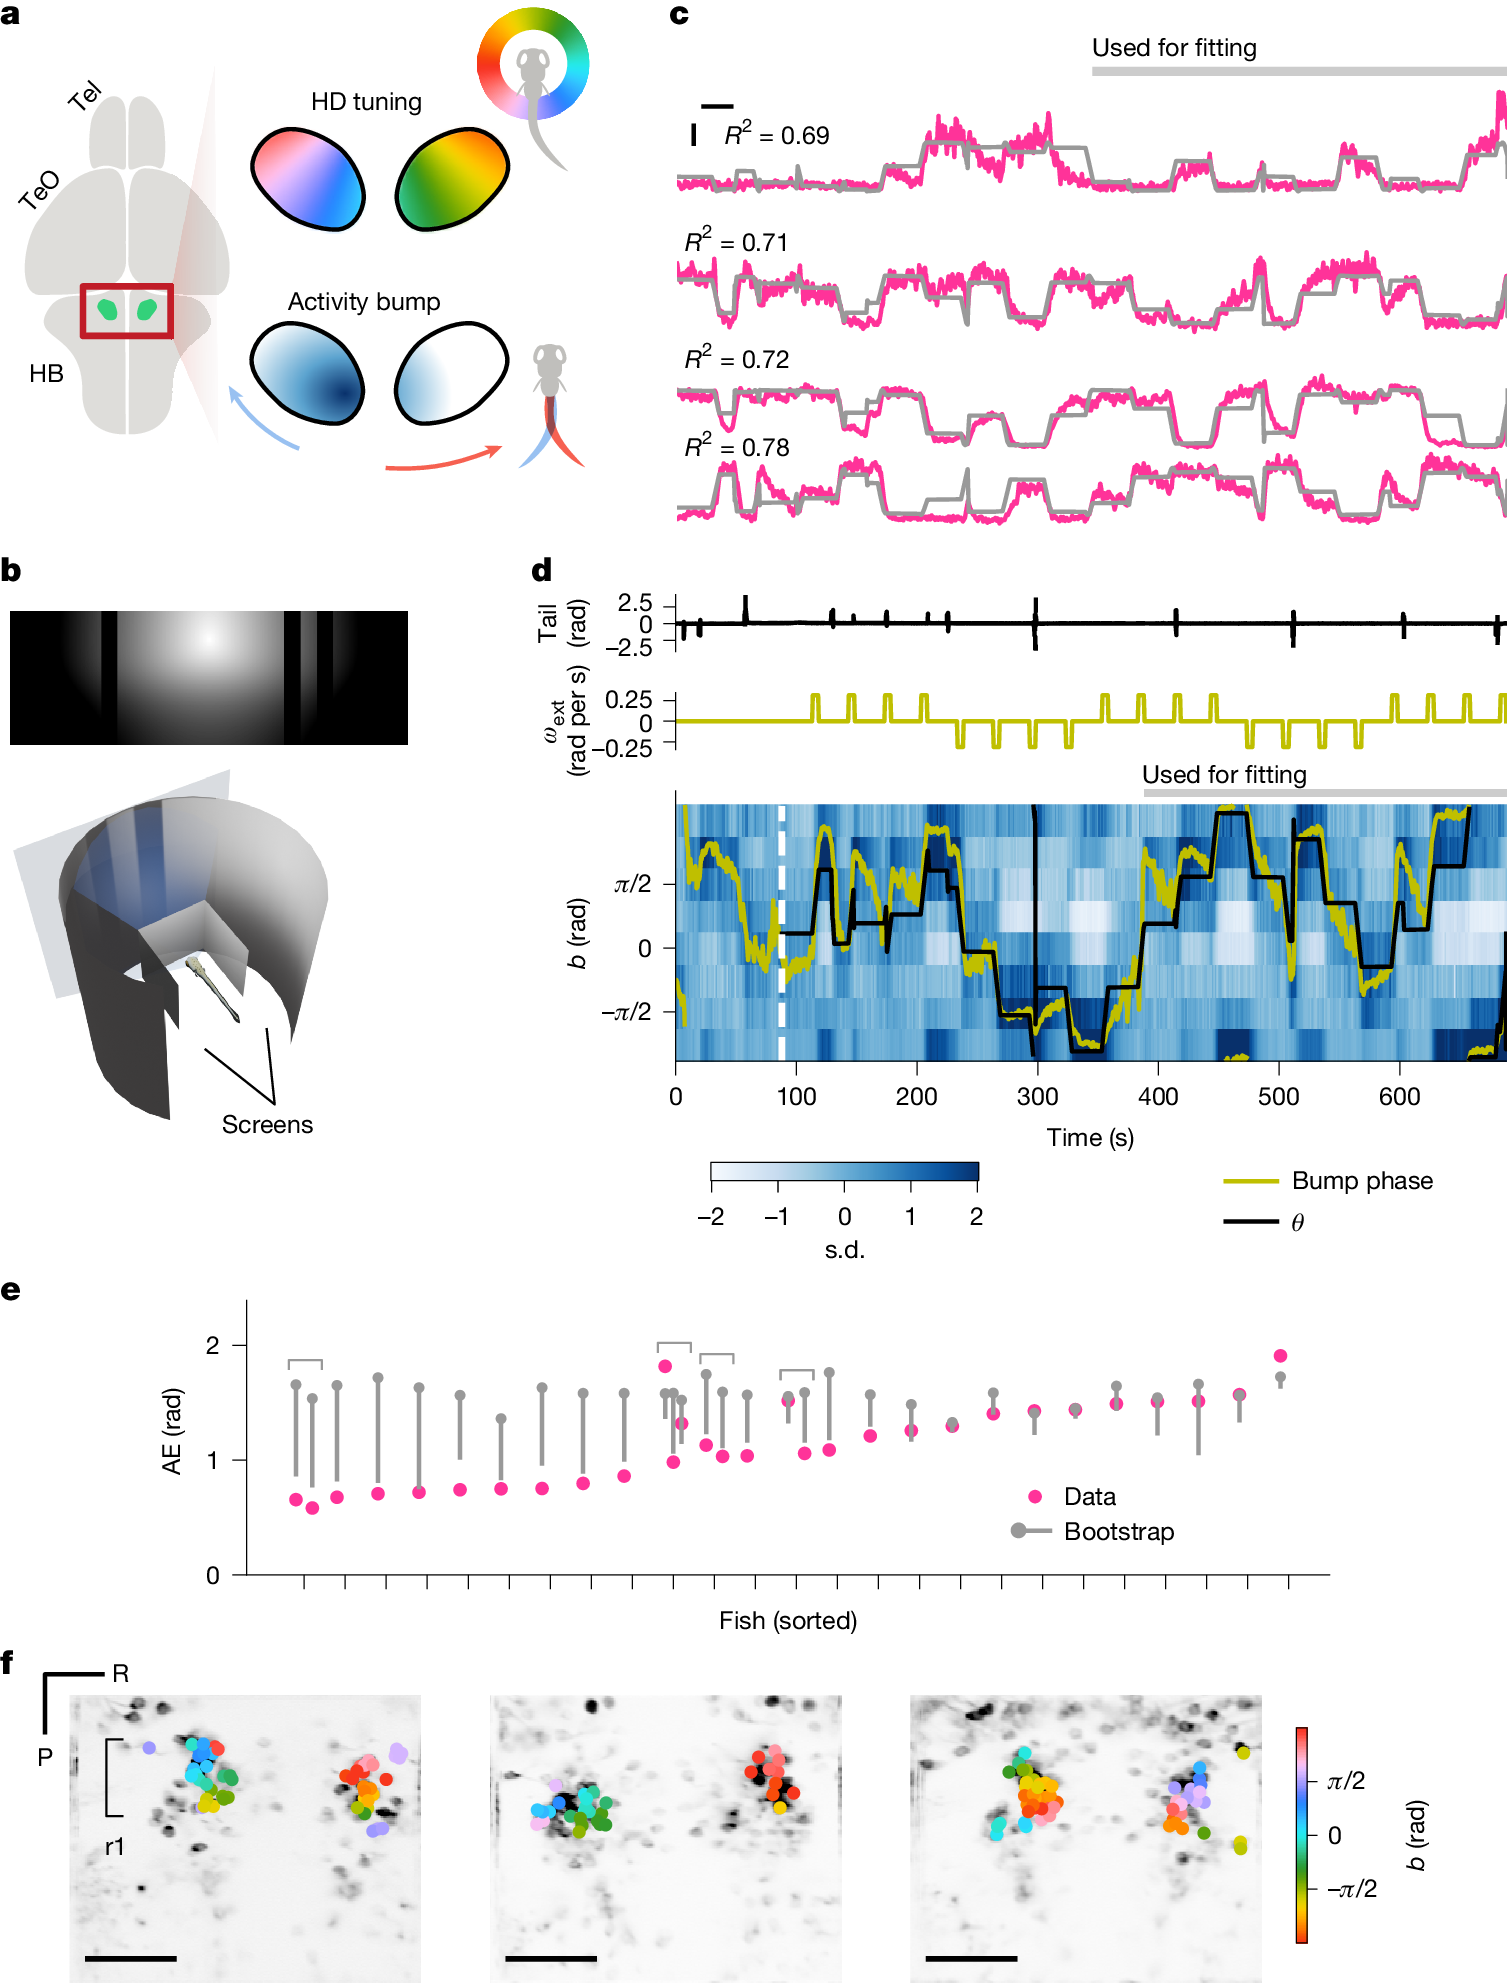
a, HD neurons in the larval zebrafish aHB are topographically organized by their tunings. As a result, the population activity of these cells appears as a single ‘bump’ that moves as the fish turns. Tel, telencephalon; TeO, optic tectum. b, The sun-and-bars visual scene consisting of a radial luminance gradient and dark bars (top) wrapped around the fish, forming a virtual cylinder (bottom). c, Example activity of the cells tuned to different scene orientations (pink) with the sinusoidal fit (grey). Only the second half of the data were used for the fitting procedure. The horizontal and vertical bars indicate 20 s and 1 s.d., respectively. d, Binned activity of the scene-orientation tuned cells, with the scene orientation \(\theta \) (black) and the bump phase (yellow) overlaid, as well as associated traces of the tail angle (top) and the exogenous rotation velocity \({\omega }_{\mathrm{ext}}\) (middle). e, Time-averaged absolute error (AE; that is, |bump phase − \(\theta \)|) for each fish (pink) compared with the shuffle. The grey dots and bars indicate the median and 5th percentile of the shuffle distributions, respectively. Out of 25 fish, 15 showed significantly below chance AE. Note that recordings from multiple planes were made in four fish, as indicated by the brackets. f, Selected ROIs visualized on the anatomy, with their scene orientation tuning colour coded. Scale bars, 50 μm. P, posterior; R, right; r1, rhombomere 1.
In this setup, we imaged the neural activity of aHB neurons expressing GCaMP6s17 under the control of gad1b–Gal4 (ref. 18) in 6–9 days post-fertilization larvae. Each experiment started with an alternating presentation of 8-s-long, bright and dark full-screen flashes. Naively visual neurons that reliably responded to these flashes were removed from further analysis (Methods). In the first experiment, we presented a scene consisting of a circular luminance gradient centred above the horizon and dark vertical bars (henceforth ‘sun-and-bars’) for 10 min (Fig. 1b). The scene wrapped around the fish, forming a virtual cylinder. The orientation of the scene was controlled in a closed-loop manner based on the tail movements. In addition, slow exogenous rotation of the scene was superimposed intermittently (90° rotations over 5 s every 30 s, switching directions every four times), such that the fish would experience various scene orientations even if they did not make many spontaneous turns. In this stimulus configuration, the behaviour of the fish was dominated by low-gain turns counteracting exogenous rotations, and they did not obviously fixate on any part of the scene (Extended Data Fig. 1). We hypothesized that in this configuration, HD cells would indeed exploit visual information, so we would expect their activity to be well fit by a single-peaked periodic function of the scene orientation. Thus, we fit a scaled, shifted sinusoid \(a\times \cos (\theta -b)+c\) to one-half of the normalized fluorescence time trace of each cell. Here θ denotes the orientation of the scene relative to the fish (clockwise positive), and a, b and c represent the response amplitude, preferred orientation and baseline, respectively. We selected cells where the sinusoidal fit resulted in R2 > 0.15 for further analyses. In this notation, the heading of the fish in the virtual world would be −θ.
We found cells surpassing the above criteria in all fish we recorded from. In some cells, R2 was as high as 0.8 (Fig. 1c and Extended Data Fig. 2a–c). At the population level, a single bump of activity was clearly visible, even before the onset of the sun-and-bars scene (that is, during flash presentations) (Fig. 1d, Extended Data Fig. 2d and Supplementary Video 2). We calculated the ‘bump phase’ as the angle of the activity-weighted average of the preferred orientation vectors of the selected cells2 (Methods). We then examined the alignment between the bump phase and the scene orientation by running bootstrap tests on the portion of the data not used for the fitting. The tests revealed significant bump–scene alignment in 15 out of 25 fish (Fig. 1e), a proportion not expected from chance (Extended Data Fig. 2e). We did not find an obvious predictor of individual variability in the alignment (Extended Data Fig. 1h–j). The preferred scene orientations of individual cells exhibited a clockwise topographical organization in rhombomere 1 (Fig. 1f and Extended Data Fig. 2f), consistent with the previous observed topography of HD cells3. The anatomical arrangement of preferred orientations had idiosyncratic offsets across multiple fish: for example, cells with b = 0 can be on the left or right side of the brain. This observation indicated the possibility that anchoring of the HD cells to visual landmarks is not hard-wired, a point we return to later.
The scene tuned cells integrate turns
Although we suspect that these scene-orientation-tuned cells are HD cells, the sinusoidal-fitting procedure could also pick up visual neurons tuned to local features. To ascertain their identity as HD cells, we wanted to make sure that their bump phase moved as fish turned, even without visual feedback. In the first experiment above, we continued recordings for another 10 min in the darkness after turning off the visual scene (Extended Data Fig. 3a). However, the small number of swim bouts that fish made in the darkness made such analysis difficult. To encourage fish to turn frequently without giving them visual cues for rotation, we decided to exploit the optomotor response19 (Extended Data Fig. 3b). The first half of the new experiment was mostly identical to that presented in Fig. 1, with a closed-loop panoramic scene with exogenous rotations. We performed the sinusoidal fitting on this half of the data to identify scene-orientation-tuned cells. During the second half, we intermittently presented an array of white dots translating sideways on a black background (in the virtual 3D space), which encouraged the fish to make turns. Once fish made a swim bout, the dots immediately disappeared without providing any rotational feedback. Here we found that the bump moved clockwise and counterclockwise as fish turned left and right, consistent with the previous observation3 (Extended Data Fig. 3c–e). The negative correlation between the turn amplitude and bump-phase shift was statistically significant across the population (Extended Data Fig. 3f). Overall, these results suggest that the scene-orientation-tuned cells detected with the sinusoidal fits are genuine HD cells.
The same set of HD cells can track multiple scenes
In the next experiment, we asked whether the same set of HD cells can consistently represent heading direction in different visual scenes. Here the same sun-and-bar scene was presented in a closed loop with exogenous rotations. After 8 min, the scene was switched to what we named the ‘Stonehenge’ scene, consisting of multiple irregularly spaced bright vertical bars over a dark background (Extended Data Fig. 4a), while maintaining the same exogenous rotation sequence. As before, HD cells were identified with the sinusoidal fits on the sun-and-bars half of the data (Extended Data Fig. 4b,f). To test whether the bump phase still tracked the new scene, we fit von Mises distributions on the histogram of the offset between the scene orientation and bump phase (Extended Data Fig. 4c) and performed bootstrap tests with time-domain shuffling on the \(\kappa \) parameter, which controls the peakiness of the distribution. Here, 8 out of 20 fish exhibited significantly above chance \(\kappa \) (Extended Data Fig. 4d), a higher proportion than expected by chance (Extended Data Fig. 4g). The mean offset between the scene orientation and the bump offset varied across fish, albeit with a bias probably due to the cross-correlation between the scenes (Extended Data Fig. 4e).
In a separate experiment, we also tested whether fish are capable of tracking scenes with visual landmarks only in the upper or lower visual fields. We found that, even though some individual fish can utilize either upper or lower landmarks, more fish were able to track the upper landmark (Extended Data Fig. 4h–m), confirming the initial intuition behind our decision to build the panoramic setup. Together, these results demonstrate the capacity of the HD cells to maintain stable head direction representations in various visual scenes.
HD cells exploit visual landmarks and optic flow
How these HD neurons track multiple visual scenes remains unknown. An early ring attractor model9 proposed two separate mechanisms: first, the model assumes an array of visual neurons that tile the visual space and detect landmarks, which instruct the activity bump to be at a specific phase (Fig. 2a). Second, the model assumes two additional rings of neurons (‘rotation cells’), which connect neighbouring HD neurons in a clockwise-shifted or counterclockwise-shifted manner, respectively. The activities of these rotation cells are further assumed to be gated by inputs from cells encoding the angular head velocity of animals. As a result, when the animal turns (for example, rightwards), the clockwise rotation cell at the current bump phase is activated, causing the bump to drift counterclockwise (Fig. 2b). Although the original model primarily considered the vestibular system to be the source of the angular head velocity information, rotational optic flow can also inform the animal of their angular head velocity. To test whether the zebrafish HD neurons use either the visual landmark-based or optic flow-based mechanisms (or both), we designed a new experiment with three epochs (Fig. 2c). In the first (‘smooth’) epoch, the sun-and-bars scene was presented in a closed-loop with superimposed slow exogenous rotations as before. HD cells were identified by performing the sinusoidal fitting on this portion of data. In the second (‘jump’) epoch, exogenous rotations were substituted by abrupt jumps of 90° without any intervening smooth rotation, eliminating the optic flow cues. In the final (‘noise’) epoch, the visual scene was swapped with a featureless spatial noise pattern, but with a smooth rotation sequence. If the HD cells exclusively relied on either optic flow-based or landmark-based mechanisms, we would expect them to lose track of the scene orientation in the jump or noise epochs, respectively.
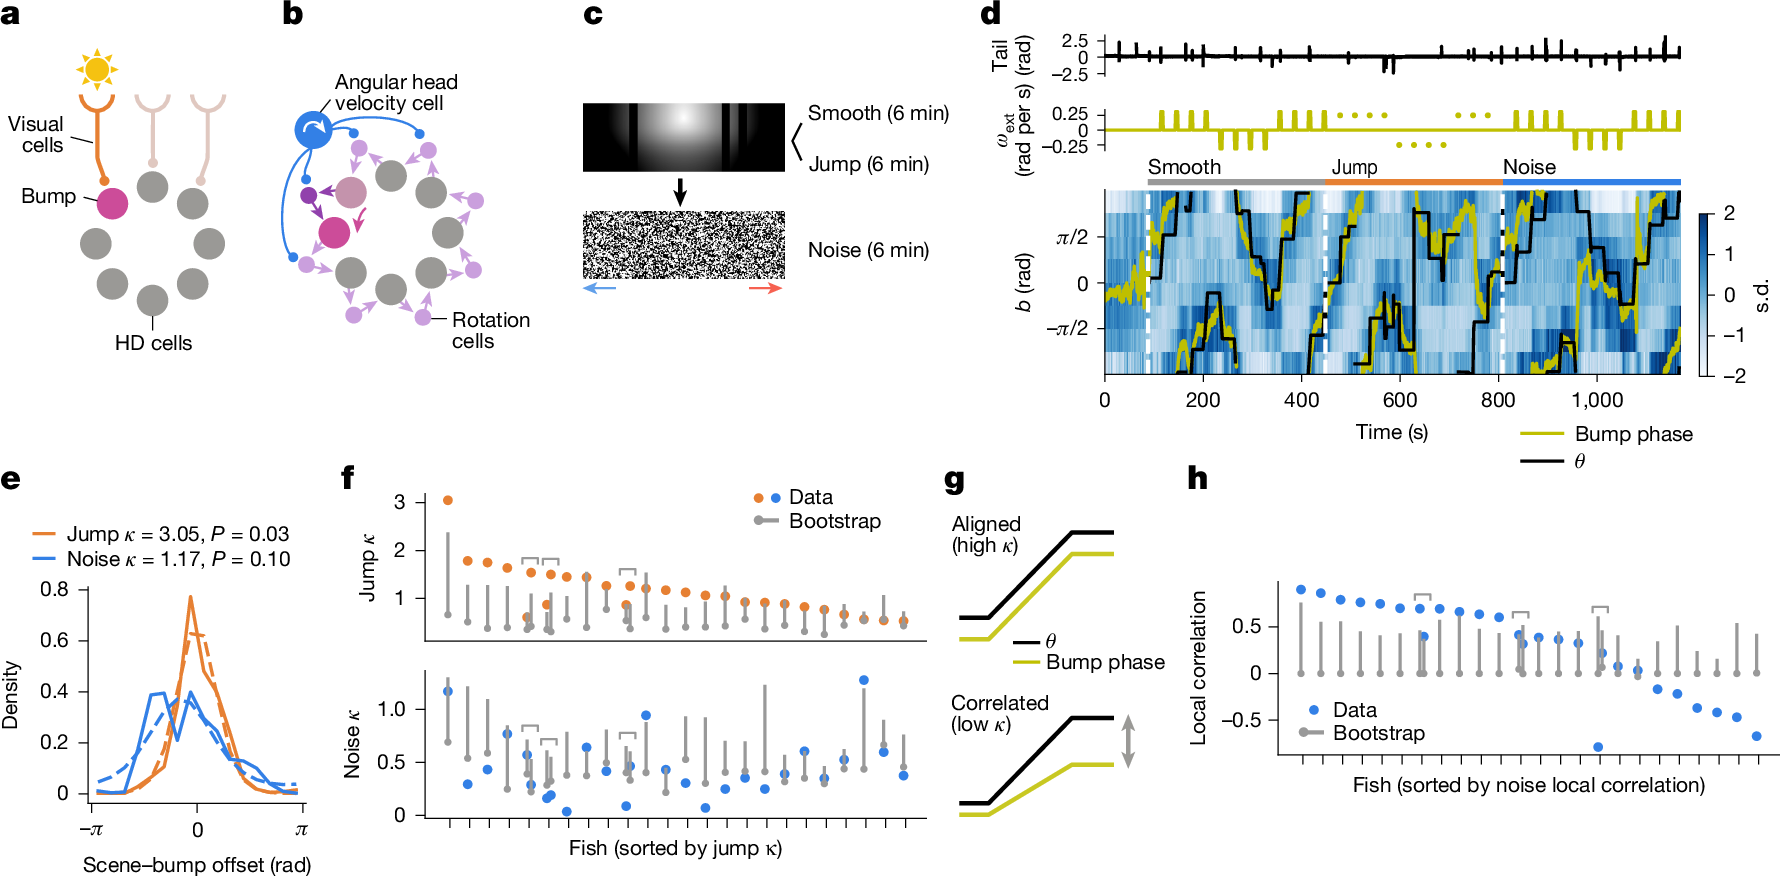
a, Visual neurons detecting landmark cues can instruct the bump phase. b, Rotational optic flow can move the bump by activating the rotation cells through angular head velocity cells. c, Schematic of the experiment. The sun-and-bars scene was presented with smooth motion (6 min) and with jumps (6 min) and was followed by a noise stimulus that rotated consistently leftwards or rightwards around the fish, as indicated by the blue or red arrows, respectively (6 min). d, An example single fish data, showing the tail angle (top), exogenous rotation velocity \({\omega }_{\mathrm{ext}}\) (middle) and the binned HD cell activity with the scene orientation \(\theta \) (black) and the bump phase (yellow; bottom). Abrupt jumps of the scene are indicated by the dots in the middle plot. The white dotted lines indicate the beginning of each experimental epoch (that is, smooth, jump or noise). e, The histograms of the scene–bump offset during the jump (orange solid line) and noise (blue solid line) epochs, with von Mises distributions fit to them (dotted lines). The P values are from bootstrap tests (Methods) and represent the probability that the \(\kappa \) exceeded the shuffle. f, \(\kappa \) from the von Mises distributions fit on the scene–bump offset histogram for each fish for each condition (orange dots for jump and blue dots for noise). The shuffle distributions are indicated in grey (dot for the median and the bar for the 95th percentile). For the jump epoch, 14 out of 24 fish showed significantly above change \(\kappa \), whereas only 3 fish did so for the noise epoch. Note that multiple recordings were made in three fish, as indicated by brackets. g, If rotational optic flow moves the bump in the right direction but by an incorrect amount, the bump phase and the noise scene orientation will no longer be aligned but remain positively correlated. h, Local correlation (that is, median Pearson correlation between \(\theta \) and the bump phase within 15-s-windows around the exogenous rotation episodes) in the noise epoch (blue) compared with the bootstrap distribution (grey dot denotes the median and the grey bar indicates the 95th percentile). Of 24 fish, 12 showed significantly above chance positive correlation.
Figure 2d shows an example fish whose HD cells appeared to track the scene orientation well in both jump and noise epochs (see also Extended Data Fig. 5a). In 14 out of 24 fish, the bump phase remained significantly aligned to the scene orientation in the jump epoch, a higher fraction than expected by chance (Fig. 2e,f and Extended Data Fig. 5c). By contrast, only three fish managed to maintain a constant offset between the bump phase and the scene orientation in the noise epoch (Fig. 2d). Yet, it is still possible that the rotational optic flow moved the bump in the correct direction, but not necessarily for the correct amount, making the bump-scene offsets variable (Fig. 2g). Indeed, in 12 out of 24 fish, the bump phase and the scene orientation were significantly positively correlated within short (15 s) periods of time around the exogenous rotation episodes in the noise epoch (Fig. 2h), a fraction not expected from chance (Extended Data Fig. 5b,c). The gain from the rotational optic flow to the bump-phase movement was on average about 50% (Extended Data Fig. 5d–g). Overall, these results indicate that mechanisms to exploit both visual landmarks and optic flow cues exist in the circuit surrounding the larval zebrafish HD neurons.