An expanded registry of candidate cis-regulatory elements
TL;DR
The ENCODE consortium has expanded its registry of candidate cis-regulatory elements (cCREs) to 2.37 million human and 967,000 mouse entries, leveraging new data and methods. This comprehensive resource includes functional characterization for over 90% of human cCREs, revealing novel silencers and dynamic enhancers, and aids in interpreting genetic variation and disease associations.
Key Takeaways
- •The ENCODE4 registry now includes 2.37 million human and 967,000 mouse cCREs, a threefold increase over previous versions, covering hundreds of cell and tissue types.
- •Functional assays have characterized over 90% of human cCREs, identifying thousands of novel silencers and context-dependent enhancers, such as those bound by MAFF/MAFK under stress.
- •Integration with ENCODE annotations enables systematic interpretation of genetic variation, exemplified by identifying KLF1 as a causal gene for red blood cell traits.
- •New computational methods like CAPRA allow detailed analysis of cCRE activity, revealing cell-type-specific functions and cooperative interactions between elements.
- •The registry provides a valuable framework for studying gene regulation, cellular identity, and disease mechanisms, with ongoing plans to expand coverage to more tissues and conditions.
Tags
Abstract
Mammalian genomes contain millions of regulatory elements that control the complex patterns of gene expression1. Previously, the ENCODE consortium mapped biochemical signals across hundreds of cell types and tissues and integrated these data to develop a registry containing 0.9 million human and 300,000 mouse candidate cis-regulatory elements (cCREs) annotated with potential functions2. Here we have expanded the registry to include 2.37 million human and 967,000 mouse cCREs, leveraging new ENCODE datasets and enhanced computational methods. This expanded registry covers hundreds of unique cell and tissue types, providing a comprehensive understanding of gene regulation. Functional characterization data from assays such as STARR-seq3, massively parallel reporter assay4, CRISPR perturbation5,6 and transgenic mouse assays7 have profiled more than 90% of human cCREs, revealing complex regulatory functions. We identified thousands of novel silencer cCREs and demonstrated their dual enhancer and silencer roles in different cellular contexts. Integrating the registry with other ENCODE annotations facilitates genetic variation interpretation and trait-associated gene identification, exemplified by the identification of KLF1 as a novel causal gene for red blood cell traits. This expanded registry is a valuable resource for studying the regulatory genome and its impact on health and disease.
Massively parallel characterization of transcriptional regulatory elements
Regulatory transposable elements in the encyclopedia of DNA elements
Main
Mammalian genomes are extensive repositories of DNA-encoded instructions that control cellular functions through complex regulatory mechanisms. Central to this regulation are cis-regulatory elements (CREs)—non-coding DNA sequences that control the transcription of nearby genes1. Usually associated with open chromatin and specific histone modifications, CREs contain binding sites for transcription factors and other chromatin-associated proteins that interact with one another and the transcriptional machinery to regulate gene expression. Understanding the biological contexts and functions of CREs is essential for deciphering genome function and its impact on human health and disease8.
The ENCODE project has made major contributions towards our understanding of gene regulation by systematically identifying and annotating functional elements in human and mouse genomes2. Across tens of thousands of high-throughput functional genomics assays, the ENCODE consortium has comprehensively mapped biochemical signatures and used them to annotate CREs, including the ENCODE Phase III (ENCODE3) registry of cCREs9.
Here we have expanded the registry of cCREs to include 2.37 million human and 967,000 mouse elements. This expansion leverages new datasets produced during ENCODE Phase IV (ENCODE4) and improved computational methods, making the registry one of the most extensive repositories of CREs available. The updated registry spans hundreds of unique cell and tissue types, and enhances our understanding of gene regulation across a broad range of biological contexts.
In addition to expanding the number of annotated elements, the updated registry integrates functional characterization data for more than 97% of human cCREs, revealing how sequence features influence regulatory activity and uncover new functional subclasses of cCREs. For example, we identified thousands of silencer cCREs—many of which act as enhancers in alternative cellular contexts—and defined MAFF and MAFK-bound cCREs as dynamic enhancers poised for activation under stress-responsive conditions. Together, these analyses highlight the diversity and context-dependent versatility of CRE function.
Integrating the expanded registry with other ENCODE Encyclopedia annotations further enables the systematic interpretation of genetic variation and the identification of trait-associated genes. As an example, we used the registry to nominate KLF1 as a probable causal gene for red blood cell (RBC) traits. Collectively, this work establishes an expanded and functionally characterized registry that provides a comprehensive framework for studying CREs and their roles in gene regulation, cellular identity and disease.
Expansion of the ENCODE registry
The ENCODE4 registry encompasses 2,373,014 human cCREs and 926,843 mouse cCREs, covering 21% of the human and 9% of the mouse genomes (Fig. 1 and Supplementary Note 1). This is a threefold increase over ENCODE3 and establishes the ENCODE4 registry as one of the most extensive repositories of CREs currently available (Supplementary Note 1 and Supplementary Data 1 and 2).
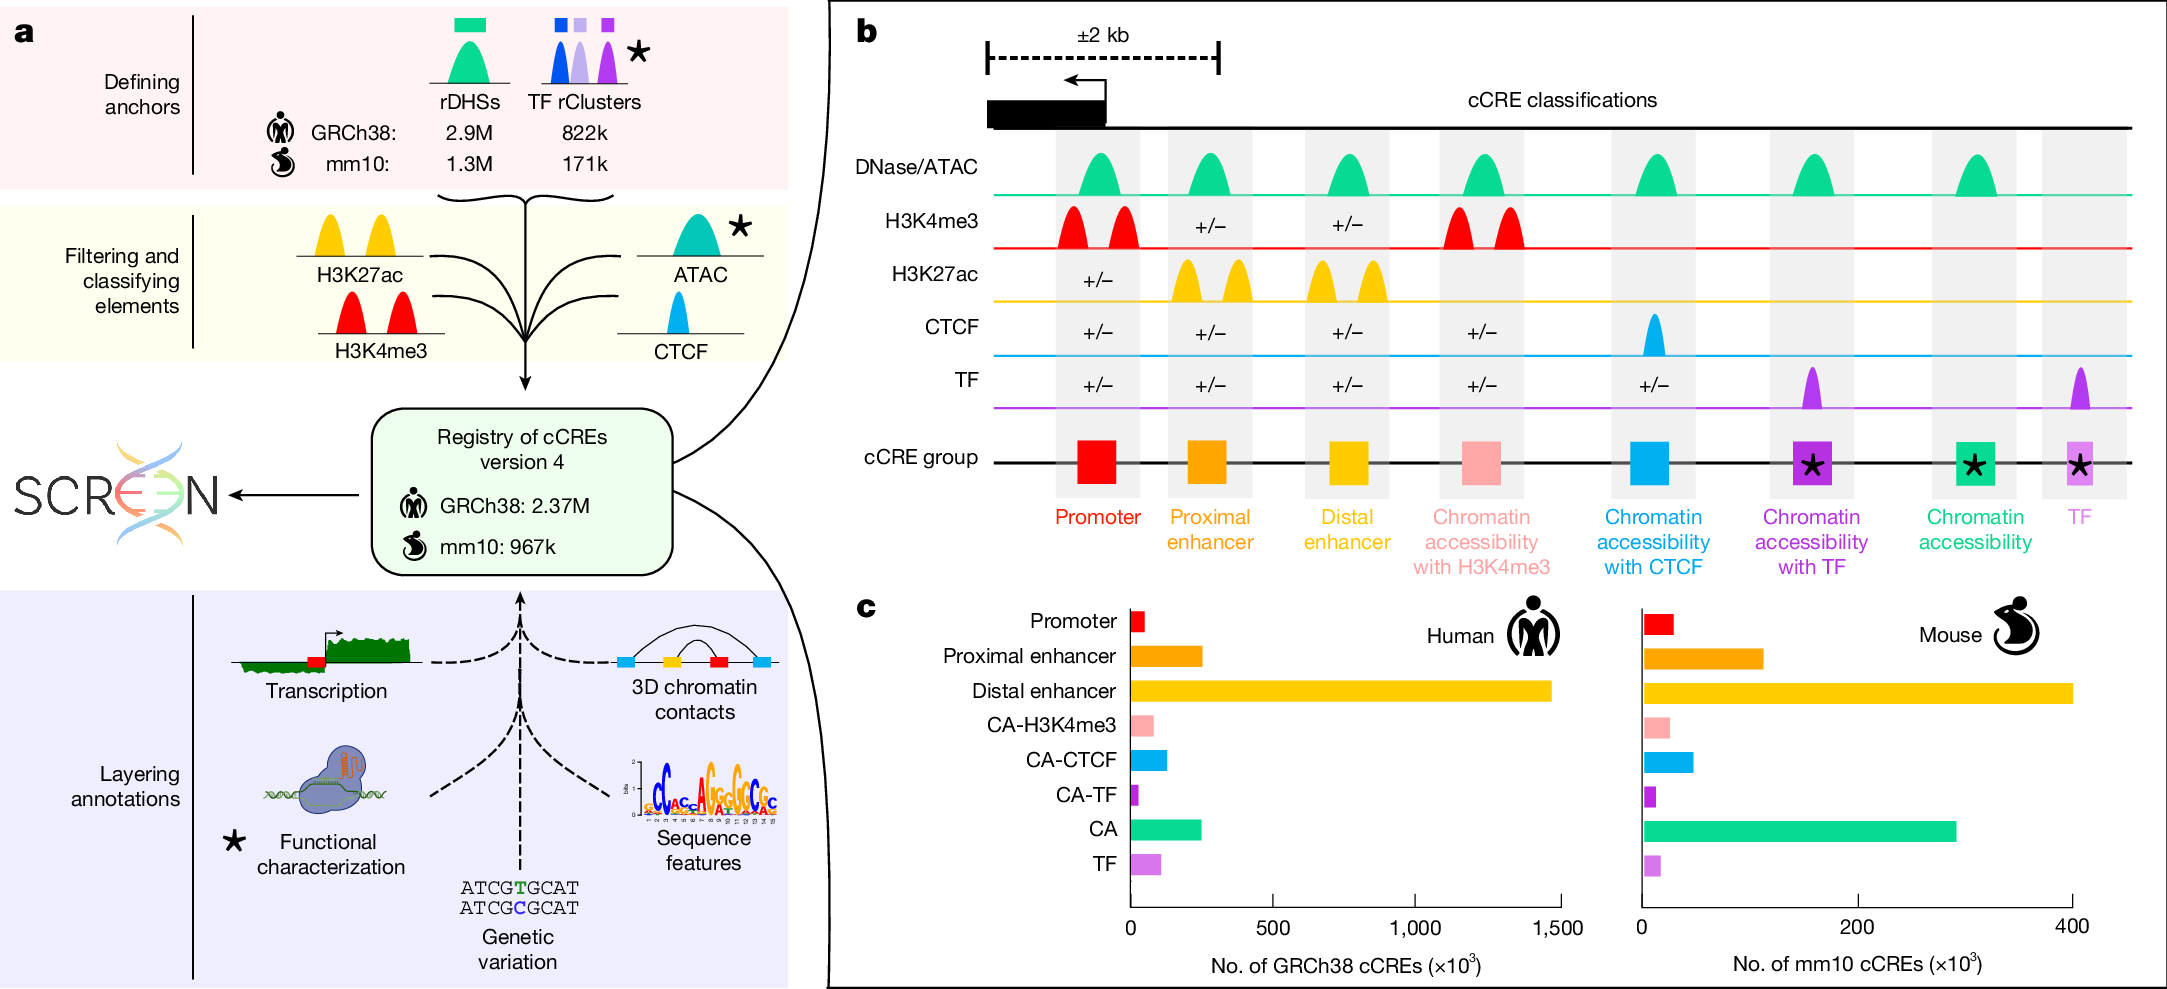
a,b, Schematic of the pipeline used to make version 4 of the registry of cCREs (a). We defined element anchors by generating rDHSs and representative transcription factor clusters (TF rClusters). Element anchors are scored and classified with H3K4me3, H3K27ac and CTCF ChIP–seq and ATAC-seq signals (yellow box) according to the scheme in b. This results in 2.37 million cCREs in the human genome and 967,000 in the mouse genome. We supplement the registry with additional ENCODE Encyclopedia annotations including transcription quantifications, 3D chromatin contacts, functional characterization measurements, sequence features and genetic variation (blue box). The registry of cCREs and all layered annotations are housed in our web portal SCREEN. New components of the pipeline are denoted by stars. b, Overview of our cCRE classification scheme. cCREs are classified on the basis of their patterns of biochemical signals (chromatin accessibility in green, H3K4me3 in red, H3K27ac in yellow, CTCF in blue and transcription factor in purple) and distance from annotated TSSs. High signals are denoted by peaks. ‘+/−’ indicates that the corresponding signal may or may not be present and its presence does not affect classification. New categories of elements are denoted by stars. c, Bar graphs depicting the number of cCREs annotated in each class for human and mouse.
This expansion reflects both incorporation of new ENCODE4 data and technical improvements to the cCRE pipeline (Supplementary Note 1 and Supplementary Table 1). We continued to anchor cCREs on representative DNase hypersensitivity sites (rDHSs) and annotated their functions using H3K4me3, H3K27ac and CTCF chromatin immunoprecipitation with sequencing (ChIP–seq) data. In this expansion, we also incorporated thousands of transcription factor ChIP–seq and assay for transposase-accessible chromatin using sequencing (ATAC-seq) datasets, enabling annotation of elements in low-accessibility regions and biosamples lacking DNase-seq (Supplementary Fig. 1 and Supplementary Tables 2 and 3). Finally, pipeline updates improved recovery of cCREs in previously difficult-to-map regions, including duplicated loci and repetitive elements such as Alu elements (Supplementary Note 1.2 and Supplementary Fig. 2).
The number of human chromatin accessibility and ChIP–seq experiments increased by 2.3-fold between ENCODE3 and ENCODE4. This doubled the number of biosamples—unique tissues, cell types and cellular states—represented in the registry from 839 to 1,679, spanning 42 human organs and tissues (Extended Data Fig. 1a). Most biosamples are primary cells and tissues, but they also include in vitro-differentiated cells, organoids and cell lines (Extended Data Fig. 1b), supporting both mechanistic studies and translational models. Coordinated ENCODE4 data production also expanded the core collection of biosamples—those with all four core assays DNase, H3K4me3, H3K27ac and CTCF—nearly sevenfold, from 25 in ENCODE3 to 170 in ENCODE4 (Extended Data Fig. 1c), enabling thorough annotation across cell types (Supplementary Note 1.3).
Classification of cCREs
We classified cCREs into eight categories based on distance to annotated transcription start sites (TSSs) and combinations of biochemical signals (Fig. 1b,c, Supplementary Note 1.4 and Supplementary Fig. 3). Five of these classes—promoter, proximal enhancer, distal enhancer, CA-H3K4me3 and CA-CTCF—were defined in our previous work9. Here we add three new categories: CA-TF cCREs, which have high accessibility but lack H3K4me3, H3K27ac or CTCF and are bound by a transcription factor; CA cCREs, which are accessible but lack enrichment for H3K4me3, H3K27ac and CTCF; and TF cCREs, which show little accessibility or histone marks yet are bound by a transcription factor. These new categories do not by themselves define discrete functional classes; however, subsequent analyses show that they include silencers and dynamic enhancers, extending the registry to capture a wider spectrum of cis-regulatory activity.
As in previous versions of the registry9, we performed cCRE classification across all biosamples (cell type-agnostic) and in specific biosamples (Supplementary Note 1.4). To facilitate comparisons at the organ and tissue level, we also generated aggregate annotations by combining biosamples from the same organ or tissue (Supplementary Note 1.5 and Supplementary Table 4a).
This expanded classification scheme and inclusion of additional biosamples added 1.4 million human and 587,000 mouse cCREs, which were enriched for evolutionary conservation and regulatory activity (Supplementary Notes 1.6 and 1.7, Supplementary Figs. 4 and 5 and Supplementary Tables 4b and 5a,b). To evaluate the effect of this expansion, we compared the ENCODE4 cCREs to four datasets that recently annotated CREs using independent approaches across diverse tissues (Supplementary Note 1.7). For all four datasets, the fraction of overlapping ENCODE4 cCREs increased relative to ENCODE3 cCREs, driven by improved brain, embryonic tissue and immune coverage (Supplementary Fig. 6 and Supplementary Table 5c–j). These comparisons demonstrate that the ENCODE4 registry achieves both broad coverage and cell-type-specific resolution, enabling more comprehensive representation of regulatory activity across the human genome.
To explore sequence features underlying cCRE classes, we trained cell type-specific variational autoencoders on cCRE sequences (Extended Data Fig. 2a and Supplementary Note 1.8). Promoter and distal enhancer cCREs segregated along the first dimension (Extended Data Fig. 2b and Supplementary Fig. 7), which strongly correlated with the percentage of guanine and cytosine (GC) nucleotides of the sequences (R = 0.92; Extended Data Fig. 2c). GC content also distinguished subsets of transcribed elements (Extended Data Fig. 2d) and correlated with transcription factor motif preferences (Supplementary Note 1.8, Supplementary Fig. 8 and Supplementary Table 6a). These results indicate that GC content is a key feature distinguishing cCRE classes and that our biochemical classification scheme effectively captures these sequence-driven differences.
While the ENCODE4 registry of cCREs provides extensive coverage across diverse tissues, its annotations are inherently influenced by the availability and quality of underlying genomic data (Supplementary Note 1.9, Supplementary Fig. 9 and Supplementary Table 6b,c). For example, the smaller number of mouse cCREs reflects the ENCODE emphasis on human samples and results in differences in class composition. Future work will expand both the human and mouse registries by incorporating publicly available datasets from additional tissues, developmental stages, and perturbation conditions.
Testing cCRE activity with functional assays
Having defined and annotated the putative functions of cCREs using chromatin signatures, we next evaluated their functional activities. ENCODE4 tested the activities of millions of genomic regions using four types of functional assays—genome-wide STARR-seq assays3, massively parallel reporter assays (MPRAs)4, CRISPR perturbation assays5,6 and transgenic mouse enhancer assays7. Nearly all of the human cCREs (97%) were tested by at least one assay in at least one cellular context, with 28% having significant activity in at least one assay (Table 1, Supplementary Note 2.1 and Supplementary Table 7). This overall rate is likely to underestimate the true fraction of functional cCREs, as most assays were performed in a limited number of cell types and are biased toward detecting enhancer activity; for example, in K562, an erythroleukemia cell line—which has the most extensive data available—91% of promoter cCREs and 65% of enhancer cCREs showed significant activity. Functional activity was strongly enriched in cCREs relative to non-cCRE regions, and among the tested cell types, cCREs bearing active chromatin signatures were more likely to show activity (Supplementary Fig. 10). This cell-type specificity was especially pronounced in CRISPR perturbation experiments, which capture activity in the native chromatin context (Supplementary Note 2.1).
Among the four assays, STARR-seq had the highest throughput, testing 2.2 million cCREs; we focused subsequent analyses on this assay. Because STARR fragments could contain multiple cCREs, we developed a novel method CRE-centric analysis and prediction of reporter assays (CAPRA) to calculate cCRE-specific STARR scores from RNA:DNA ratios, resolving enhancer and silencer activities (Supplementary Note 2.2 and Supplementary Fig. 11). CAPRA characterized 75–87% cCREs in each experiment and supported downstream analyses such as identifying sequence features, comparing cCRE activity across cell types and quantifying combinatorial cCRE interactions (Supplementary Notes 2.3–2.5, Supplementary Fig. 12, Supplementary Tables 8 and 9 and Supplementary Data 3 and 4).
We first studied cell-type-specific functional activity of cCREs by comparing their STARR scores in K562 versus HepG2 (a hepatocellular carcinoma cell line). Promoter cCREs were more likely to have consistent STARR scores across cell types than distal enhancer cCREs (Supplementary Fig. 12a), concordant with our previous results9 and the general understanding that enhancers tend to be more cell-type specific than promoters10.
To determine what sequence features were responsible for this cell-type-specific activity, we investigated which transcription factor motifs were enriched in distal enhancer cCREs with differentially high STARR scores in K562 (K562 STARR+) versus HepG2 (HepG2 STARR+) cells (Fig. 2a). Both groups of cCREs were enriched for cell type-relevant transcription factor motifs—haematopoietic factors in K562 and hepatocyte nuclear factors in HepG2—and were more likely to exhibit active biochemical signatures in the respective cell type (Fig. 2b, Supplementary Fig. 13 and Supplementary Table 9a,b). When we analysed STARR scores in two other cell lines, HCT116 (colon carcinoma) and MCF-7 (breast cancer), the STARR+ enhancer cCREs enriched for the respective haematopoietic (GATA1) or hepatocyte (HNF4A) transcription factor motifs did not show STARR activity (Extended Data Fig. 3a), consistent with the cell type-specific expression of these transcription factors across the four lines (Extended Data Fig. 3b).
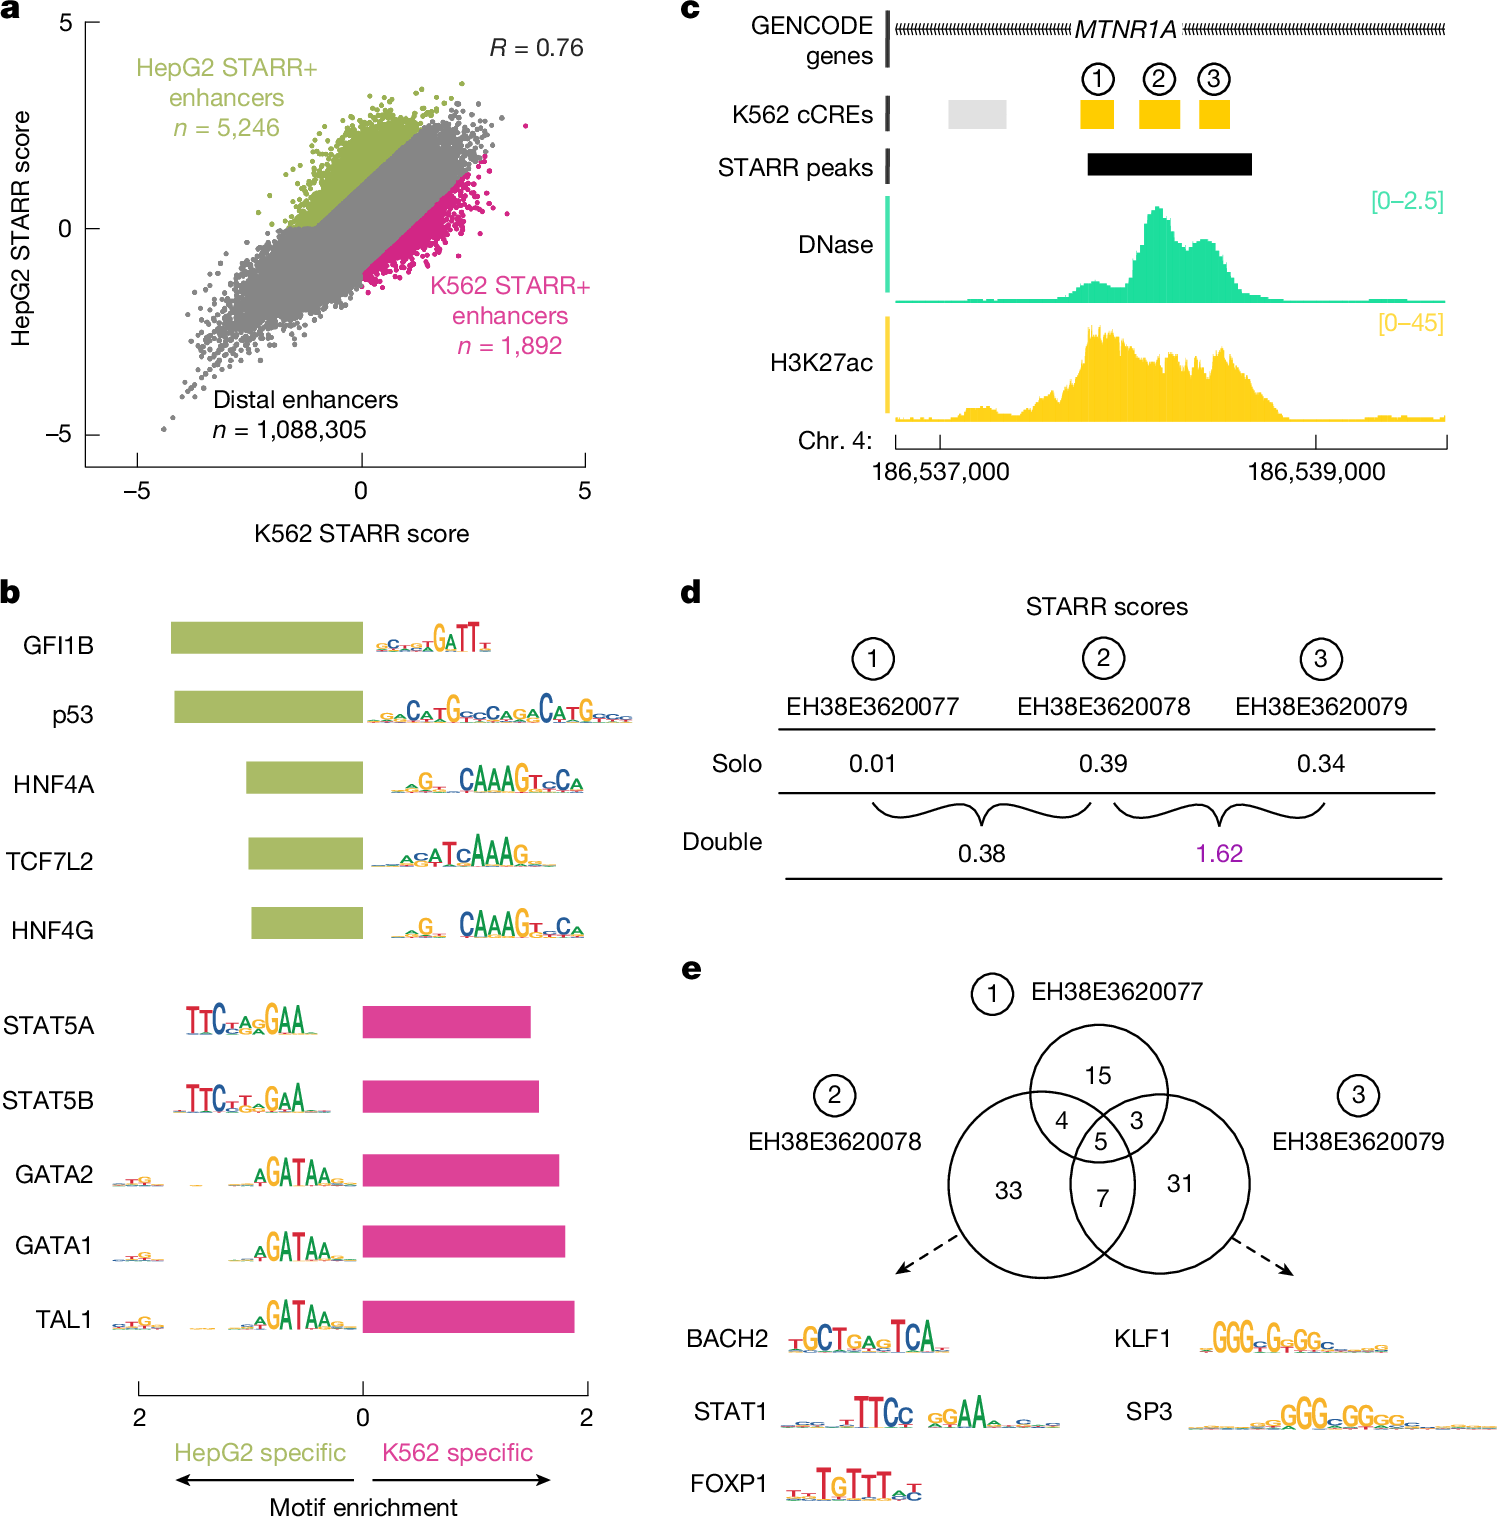
a, CAPRA quantifications for distal enhancer cCREs in HepG2 versus K562 cell lines. The colour of points indicates cCREs with enriched activity (STARR+) in HepG2 (green, n = 5,246) or K562 (pink, n = 1,892) cells. b, Bar plots of motif enrichment for HepG2 (green) or K562 (pink) STARR+ distal enhancers (as defined in a). Top five motifs are shown for each group of cCREs along with their corresponding logo. c, Genome browser view of three distal enhancer cCREs (denoted 1–3) in the MTNR1A intron with DNase (green) and H3K27ac (yellow) signals in K562 cells. A STARR-seq peak is shown in black. d, CAPRA quantifications for the three enhancers shown in c: EH38E3620077 (1), EH38E3620078 (2) and EH38E3620079 (3) using solo fragments (top) and double fragments (bottom). High values are denoted in purple (CAPRA, P = 0.03). e, Top, overlap of common K562 transcription factor motifs at the three enhancers in c,d. Bottom, representative motif logos for EH38E3620078 and EH38E3620079 are shown.
We observed unexpected enrichment for two motifs in HepG2 STARR+ enhancers: p53 and GFI1B. HepG2 STARR+ enhancers with p53 motif sites had high activity in HepG2 cells but low activity in K562 cells; most of these enhancers were also active in HCT116 and MCF-7 (Extended Data Fig. 3a). These results are consistent with the status of p53, a tumour suppressor, in these cell lines: inactive in K562 and active in the other three lines (Supplementary Note 2.6). Our results underscore the importance of biosample selection, as the disruption of regulatory mechanisms in a cancer cell line can affect the interpretation of data obtained using that line. Meanwhile, HepG2 STARR+ enhancers with GFI1B motif sites had moderate-to-high STARR scores in HCT116 and MCF-7 cells but lower-than-baseline activity in K562 cells (Extended Data Fig. 3a). GFI1B is a transcriptional repressor that is expressed in erythrocyte progenitors11 and K562 cells (Extended Data Fig. 3b). These results suggest that GFI1B-containing cCREs repress transcription in K562 cells and that our method can identify elements with repressive or silencing activities.
In addition to characterizing the activity of individual cCREs, the CAPRA method quantified the activity of 335,909 pairs of cCREs (Supplementary Data 4). Combined activity levels were generally correlated with the averaged activity of the individual cCREs, and this correlation increased as more stringent filters were applied to the data (Supplementary Fig. 14a–d). Nevertheless, there were notable exceptions, including cCRE pairs with lower or higher than expected effects, suggesting repressive and cooperative interactions, respectively (Supplementary Note 2.5 and Supplementary Fig. 14e,f). For example, three enhancer cCREs within an intron of MTNR1A showed low-to-moderate activity when tested separately in K562 cells (STARR scores of 0.01, 0.39 and 0.34 for EH38E3620077, EH38E3620078 and EH38E3620079, respectively; Fig. 2c,d). When assayed together, the first two maintained moderate activity (0.38), whereas the last two displayed unexpectedly strong cooperativity (1.62, P = 0.03). EH38E3620078 and EH38E3620079 contained more transcription factor motif sites than the weaker partner EH38E3620077 (46–49 versus 27), consistent with their higher individual activities. In combination, their cooperative effect exceeded expectations, which we hypothesize is due to the diversity of their motif profiles—AT-rich (STAT, FOX and BACH) versus GC-rich (KLF, SP)—a pattern that is also supported by ChIP–seq (Fig. 2e and Supplementary Table 9f,g). Although our pow