CFAP20 salvages arrested RNAPII from the path of co-directional replisomes
TL;DR
CFAP20 salvages arrested RNA polymerase II (RNAPII) near promoters to prevent co-directional collisions with replisomes, maintaining genome stability. Its deficiency leads to R-loop accumulation and replication defects, which are rescued by Mediator complex depletion.
Key Takeaways
- •CFAP20 prevents co-directional collisions between arrested RNAPII and replisomes by salvaging RNAPII in promoter-proximal regions.
- •CFAP20 deficiency causes R-loop accumulation, replication timing defects, and accelerated fork speeds, leading to genome instability.
- •Depletion of the Mediator complex or removal of R-loop-engaged RNAPII restores normal replication in CFAP20-deficient cells.
- •CFAP20's role is distinct from its ciliary function, as mutations like R100C affect R-loop prevention but not ciliary rescue.
- •The study highlights a transcription-centered mechanism for avoiding transcription-replication conflicts, with CFAP20 as a key protective factor.
Tags
Abstract
Fine-tuning DNA replication and transcription is crucial to prevent collisions between their machineries1. This is particularly important near promoters, where RNA polymerase II (RNAPII) initiates transcription and frequently arrests, forming R-loops2,3,4. Arrested RNAPII can obstruct DNA replication, which often initiates near promoters5,6. The mechanisms that rescue arrested RNAPII during elongation to avoid conflicts with co-directional replisomes remain unclear. Here, using genome-wide approaches and genetic screens, we identify CFAP20 as part of a protective pathway that salvages arrested RNAPII in promoter-proximal regions, diverting it from the path of co-directional replisomes. CFAP20-deficient cells accumulate R-loops near promoters, which leads to defects in replication timing and dynamics. These defects stem from accelerated replication-fork speeds that cause a secondary reduction in origin activity. Co-depletion of the Mediator complex or removal of R-loop-engaged RNAPII restores normal replication. Our findings suggest that transcription-dependent fork stalling in cis induces accelerated fork progression in trans, generating single-stranded DNA gaps. We propose that CFAP20 facilitates RNAPII elongation under high levels of Mediator-driven transcription, thereby preventing replisome collisions. This study provides a transcription-centred view of transcription–replication encounters, revealing how locally arrested transcription complexes propagate genome-wide replication phenotypes and defining CFAP20 as a key factor that safeguards genome stability.
Main
The intricate dance between the replication and transcription processes, both of which operate on the same DNA template, must be tightly regulated to maintain genome integrity7. Collisions between these processes occur across nearly all species8,9 and can be either head-on (HO) or co-directional (CD), depending on which DNA strand is transcribed. HO collisions arise when the transcription machinery moves opposite to the replisome, with the transcribed strand serving as the lagging-strand template. In CD collisions, transcription and replication proceed in the same direction, with the transcribed strand acting as the leading-strand template1,10. Protein-coding genes are transcribed by RNAPII, which initiates at promoter sequences11. After promoter escape, RNAPII frequently undergoes transient promoter-proximal pausing12. Multi-protein complexes regulate its release into productive elongation: Integrator terminates and removes paused RNAPII at promoter-proximal sites6,13 whereas the Mediator complex, comprising a core body and a kinase module, coactivates RNAPII-dependent transcription14. After release, RNAPII at first elongates slowly near promoters, accelerating over the first approximately 10 kb of genes until reaching peak speed15. This early acceleration is stimulated by diverse elongation factors that act through distinct mechanisms16,17. Slow elongation or pausing promotes re-annealing of nascent transcripts to the template DNA, forming R-loops—three-stranded structures composed of an RNA–DNA hybrid and displaced single-stranded DNA2,3. RNAPII engaged with R-loops can obstruct replisomes, leading to genome instability10. Most studies of transcription–replication conflicts have focused on HO collisions18,19, which are generally considered more deleterious. However, most human genes are oriented co-directionally6, and active replication origins, particularly those that fire early in S-phase, frequently lie near promoters5. Given that RNAPII often pauses at promoter-proximal sites of highly transcribed genes, CD collisions in this region are likely. How replisomes navigate CD RNAPII during productive elongation remains unknown.
Genome-wide transcription–replication
To investigate spatial connections between transcription, co-transcriptional R-loops and replication genome-wide, we mapped RNAPII occupancy by chromatin immunoprecipitation followed by sequencing (ChIP–seq); nascent transcription by bromouridine (BrU)–seq; and R-loops by DNA–RNA hybrid immunoprecipitation (DRIP)–seq in RPE1 cells (Fig. 1a). Replication origins were mapped using previously published Okazaki fragment (OK)–seq data from unperturbed RPE1 cells5 (Extended Data Fig. 1a), identifying 4,785 origins shared between two replicates. These aligned well with Origin-seq (Ori–seq) origins mapped in hydroxyurea (HU)-treated RPE1 cells20 and were enriched in transcriptionally active, early-to-mid-S-phase regions, as confirmed by single-cell 5-ethynyl-2′-deoxyuridine sequencing (scEdU–seq) in unperturbed cells21 (Extended Data Fig. 1b,c). For these origins, we calculated distances to the nearest transcription start site (TSS) and retained only those without another gene within 5 kb upstream, yielding 2,040 origins. RNAPII, BrU and DRIP profiles were overlaid with these coordinates and sorted by origin–TSS distance. Metaprofiles were generated by aligning all co-directionally (CO) oriented TSSs (n = 1,395) relative to origins and compared with HO TSSs (n = 408) (Fig. 1b and Extended Data Fig. 2a). As previously observed6, RNAPII binding and nascent transcription were higher at CD-oriented TSSs than at HO-oriented TSSs (Fig. 1c and Extended Data Fig. 2b,c). R-loop levels were modestly higher at CD-oriented TSSs, consistent with increased transcription (Fig. 1c). Extending this analysis, we plotted R-loop levels within 25-kb promoter windows adjacent to origins and up to 75 kb away in either orientation (Extended Data Fig. 2d). R-loop levels were markedly increased near origins, particularly in the CD orientation, suggesting that TSSs that are close to origins experience greater transcription stress (Fig. 1d). We propose that cells deploy mechanisms to mitigate transcription stress at these TSSs to minimize clashes with CD replisomes.
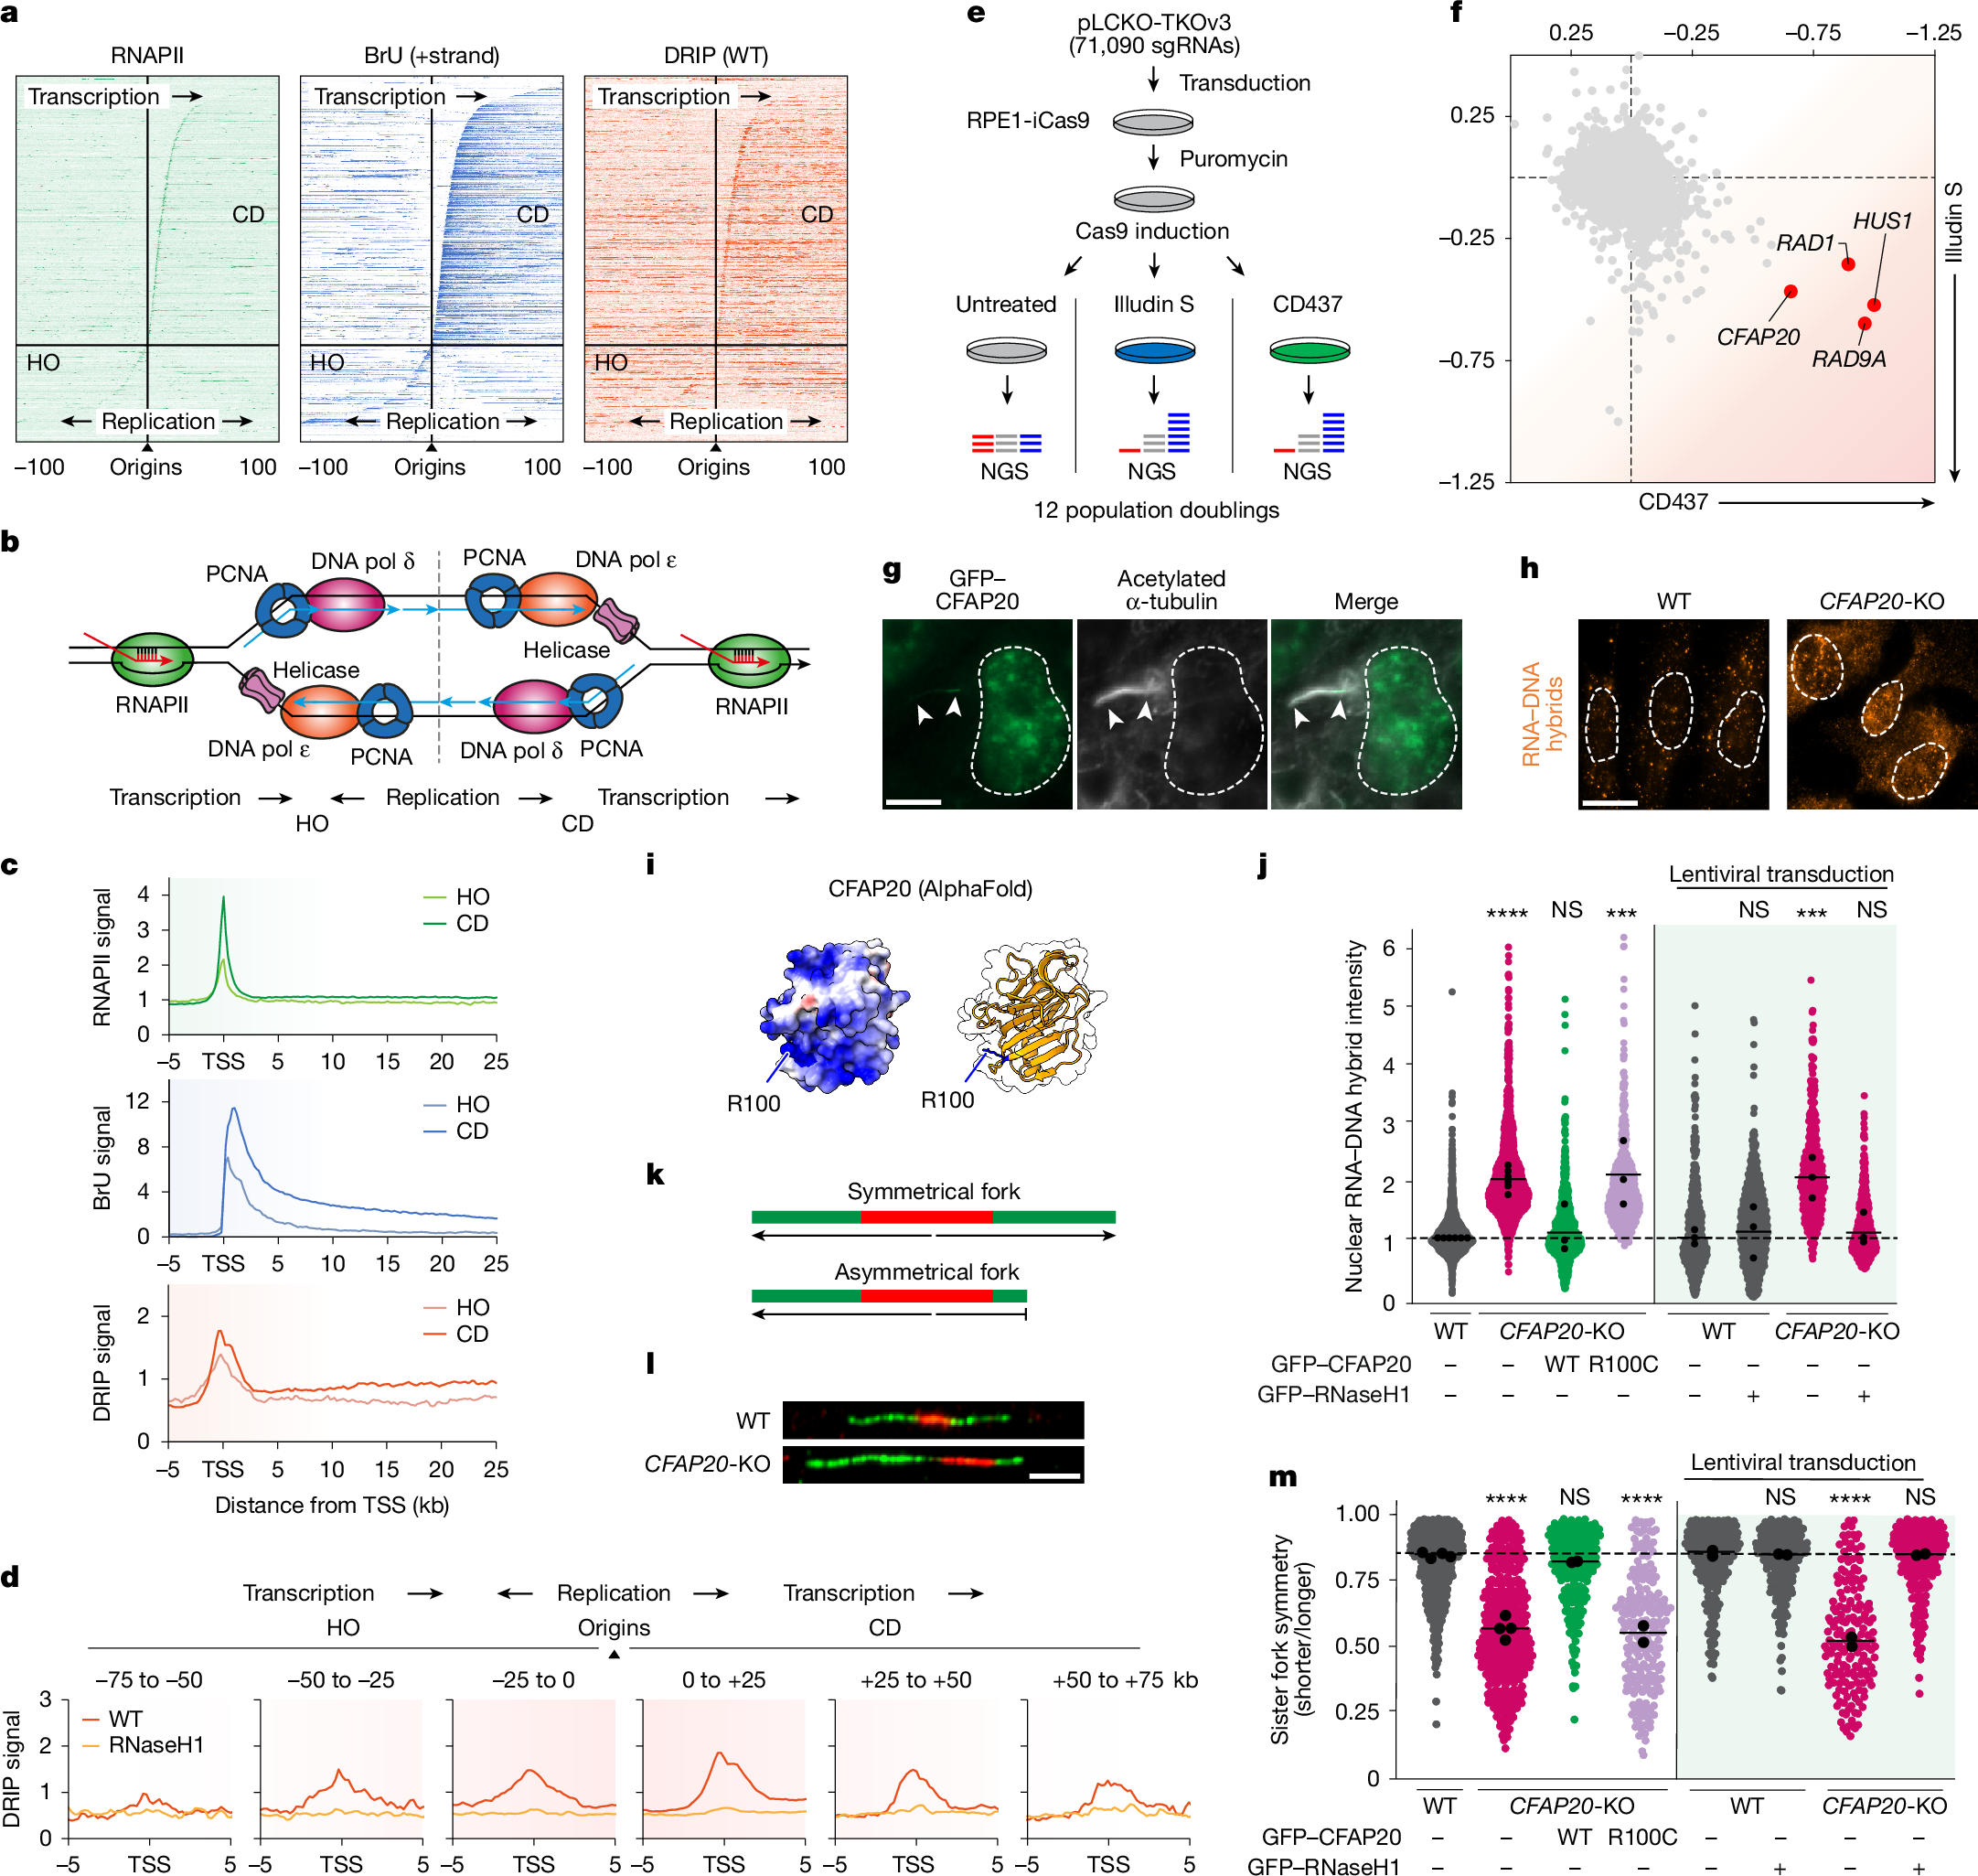
a, Heat maps of RNAPII ChIP–seq, BrU–seq and DRIP–seq in RPE1 cells, aligned around replication origins mapped by OK–seq5. b, Model showing RNAPII transcription on lagging-strand (HO) or leading-strand CD) templates relative to the replication fork. c, Metaprofiles of RNAPII ChIP–seq (green), BrU–seq (blue) and DRIP–seq (red) in RPE1 cells around TSSs oriented HO (n = 408) or CD (n = 1,395) relative to origins5. Data are averages after trimming the top and bottom 5% of data (a trim-mean of 0.1) to remove extreme values. d, Metaprofiles of DRIP–seq signals within a 25-kb window adjacent to origins extending up to 75 kb in HO and CD orientations (Trimmean 0.1). e, Schematic of CRISPR–Cas9 screens. NGS, next-generation sequencing. f, Correlation of normalized z-scores from CD437 and illudin S screens7; lowest and highest z-scores normalized to –1 and +1. g, Representative co-localization of GFP–CFAP20 with the primary cilium (arrowheads) marker acetylated α-tubulin. Scale bar, 20 μm. h, Representative image of immunofluorescent labelling of R-loops using S9.6 antibody. Scale bar, 10 μm. i, AlphaFold model of CFAP20, highlighting residue R100; positively charged residues are in blue. j, Quantification of nuclear R-loop signal from h for the indicated stable cell lines. Each coloured circle is one cell; black circles represent medians of independent experiments (more than 100 cells); black lines are means of all experiments; significance was calculated by one-way ANOVA with Šidák’s correction. P values from left to right: <0.0001, 0.9944, 0.0002, 0.9980, 0.0020 and 0.9980. NS, not significant. k, Schematic of sister fork symmetry principle. l, Representative sister fork symmetry observed by sequential CldU (red) and IdU (green) labelling. Scale bar, 5 μm. m, Quantification of sister fork symmetry from l. Data as in j (more than 100 fibres); significance by one-way ANOVA with Šidák’s correction. P values from left to right: <0.0001, 0.8851, <0.0001, >0.9999, <0.0001 and >0.9999.
CFAP20 in transcription–replication screens
To uncover mechanisms and factors that fine-tune the coexistence of transcription and replication, we performed two genome-wide CRISPR screens. Cells were transduced with 71,090 gRNAs targeting 18,053 protein-coding genes and left untreated, or exposed to illudin S to stall transcription17 or the DNA polymerase α inhibitor CD437 to stall replication22 (Fig. 1e). Genes at the intersection of these genetic screens encode proteins that respond to both transcription arrest and replication arrest. The genes with the highest scores in both screens encode three subunits of the 9-1-1 complex (RAD9–HUS1–RAD1), a known checkpoint complex that is strongly activated by transcription–replication encounters23. The fourth top hit at the intersection of these screens is the CFAP20 gene (Fig. 1f), which encodes a small (23 kDa) understudied protein that is currently known only as a ciliary protein24. In addition to its expected localization at the primary cilium of RPE1 cells, we observed that GFP–CFAP20 localized to the cell nucleus (Fig. 1g). This prompted us to investigate its nuclear function in more detail.
CFAP20 prevents R-loop accumulation
Although CFAP20 was previously suggested to be an essential gene25, we were able to generate a CFAP20 full knockout (KO) cell line in RPE1 TP53-KO cells (Extended Data Fig. 3a). In agreement with our CRISPR screens, clonogenic survival assays confirmed that CFAP20-KO cells are sensitive to illudin S and to CD437 (Extended Data Fig. 3b,c). Although our previous work revealed that many illudin S sensitizer genes are involved in transcription-coupled DNA repair (TCR)17, illudin S sensitization alone is not enough to unequivocally identify TCR genes26. In line with this, functional assays show that CFAP20 is fully dispensable for TCR (Extended Data Fig. 3d). Notably, illudin S treatment has been shown to cause R-loop accumulation independently of TCR27, which prompted us to investigate R-loop levels in CFAP20-deficient cells. Immunofluorescence experiments using the S9.6 antibody (Fig. 1h), recognizing the RNA–DNA hybrid of R-loops28,29, showed a twofold increase in R-loop levels in CFAP20-KO cells, similar to R-loop levels in BRCA1-KO cells30 (Extended Data Fig. 3e). While mining the COSMIC (Catalogue Of Somatic Mutations In Cancer) database, we observed a charge-loss substitution (R100C) in CFAP20, situated within a highly positively charged patch on the protein surface (Fig. 1i). This mutation is recurrent in a small number of tumour types, yet it has not been classified as a tumour driver (Extended Data Fig. 3f and Supplementary Table 1). Owing to its potential effect on CFAP20 function, we chose to characterize this mutant. Although the R-loop phenotype in CFAP20-KO cells was fully reversed by stable re-expression of GFP-tagged wild-type (WT) CFAP20, expression of the GFP–CFAP20(R100C) mutant did not rescue the R-loop phenotype (Fig. 1j). To demonstrate specificity, we lentivirally transduced CFAP20-KO cells with GFP–RNaseH1, which abolished the S9.6 signal (Fig. 1j). Moreover, imaging R-loops using catalytically inactive recombinant GFP-tagged RNaseH1(D210N) confirmed the accumulation of R-loops in CFAP20-KO cells31,32, which was fully reversed by re-expression of CFAP20 (Extended Data Fig. 3g). A consequence of R-loop accumulation is the asymmetry of sister forks progressing from single origins33 (Fig. 1k). Accordingly, we could detect a marked fork asymmetry in CFAP20-KO cells (Fig. 1l) which could be reversed by expression of WT CFAP20 and by lentiviral transduction of GFP–RNaseH1, but not by CFAP20(R100C) (Fig. 1m), indicating that this is an R-loop-driven phenotype.
CFAP20 limits R-loops beyond cilia
We next investigated whether the accumulation of R-loops is connected to the ciliary function of CFAP20. To test this, we exploited the observation that homozygous cfap20−/− zebrafish larvae develop anterior–posterior ventral axis curvature, which has been attributed to the loss of motile ciliary function24. Micro-injecting human CFAP20 mRNA into cfap20-deficient zebrafish embryos fully rescued the body-axis-curvature defect. A similar rescue was observed when micro-injecting the CFAP20R100C variant (Fig. 2a,b). Consistent with these findings, GFP–CFAP20(R100C) localized to the primary cilium of RPE1 cells (Extended Data Fig. 4a). These findings suggest that the R-loop phenotype in CFAP20-KO cells is unrelated to its ciliary function.
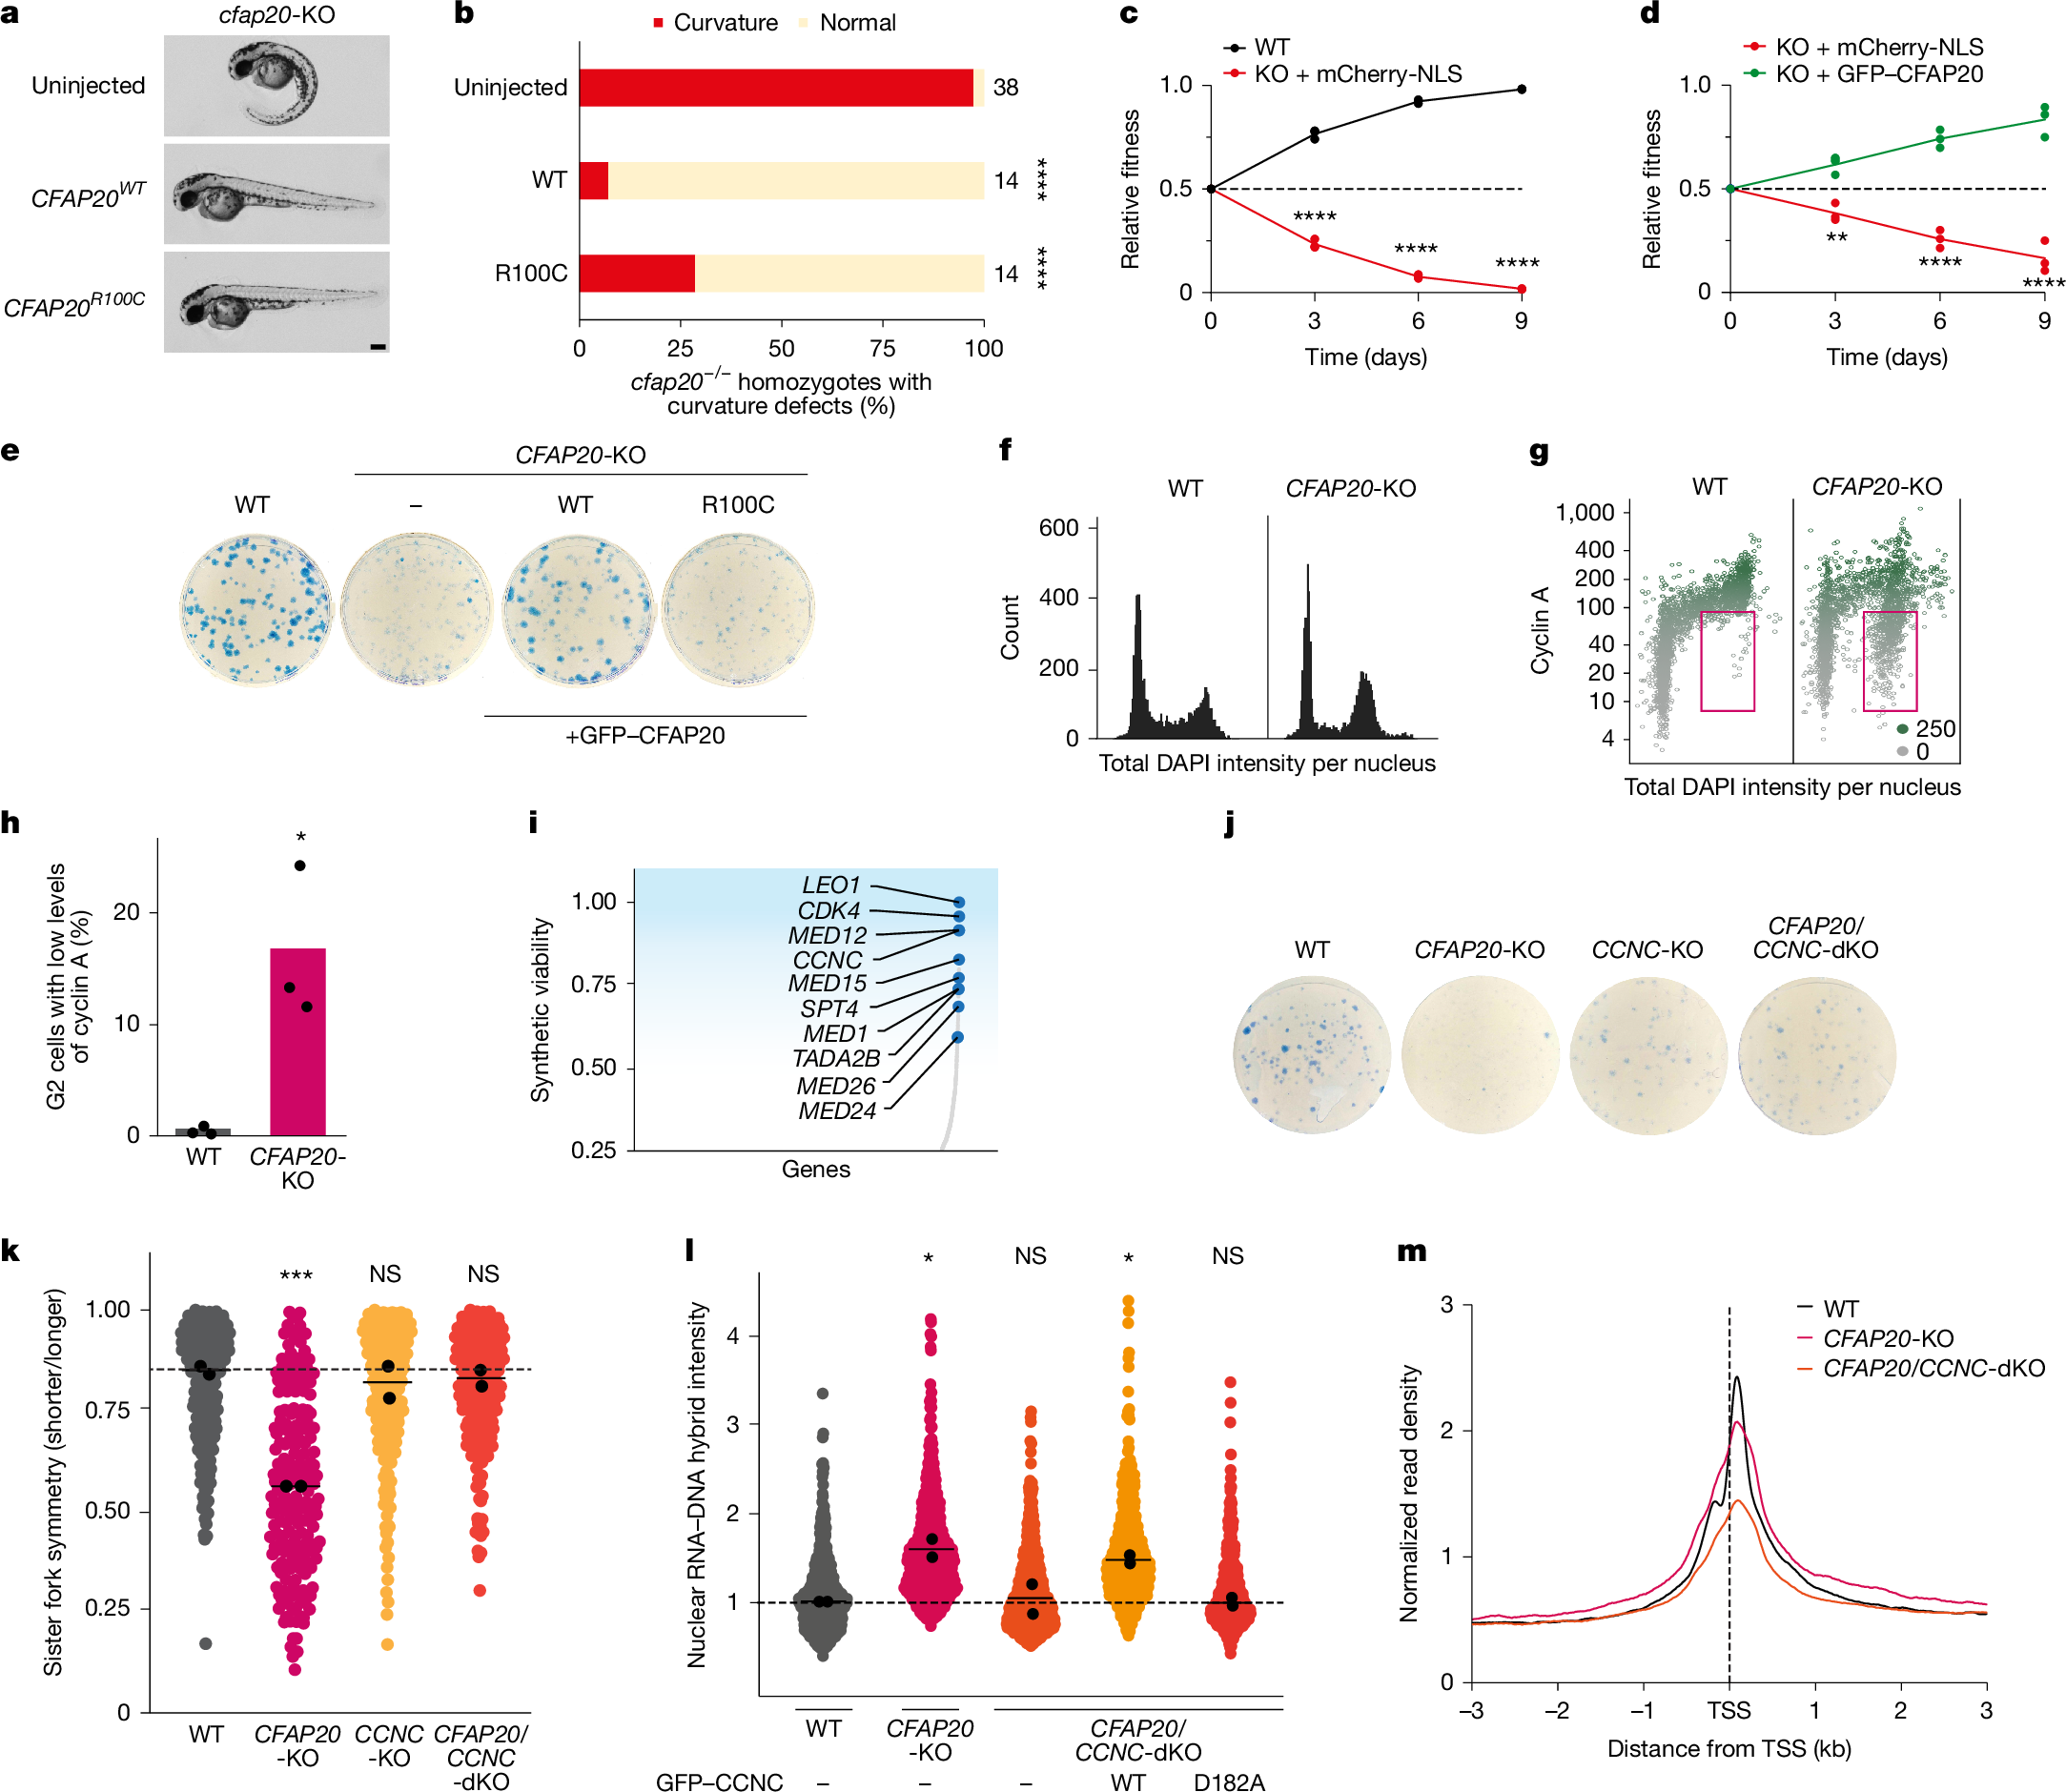
a, Representative micrographs of cfap20−/− zebrafish embryos two days after fertilization, with severe ventral anterior–posterior curvature rescued by microinjection of 25 pg human CFAP20 mRNA (WT or R100C). Scale bar, 0.2 mm. n = 2 biological replicates. b, Percentage of cfap20−/− homozygotes with curvature defects, either uninjected or rescued by 25 pg human CFAP20 mRNA (WT or R100C). Sample sizes are indicated next to the bars. Significance by two-tailed Fisher’s exact test. ****P < 0.0001. c, Quantification of competition assays between the indicated conditions. NLS, nuclear localization signal. Each coloured circle represents the mean of an independent experiment (more than 30,000 cells). The coloured line represents the mean of n = 3 biological independent experiments. Significance by one-way ANOVA with Šidák’s correction. ****P < 0.0001. d, Additional competition assay quantification as in c. P values from left to right: 0.0064, <0.0001 and <0.0001. e, Colony formation assay for the indicated cell lines. f, Cell-cycle profiles analysed by quantitative image-based cytometry in the indicated RPE1 lines. g, Quantitative image-based cytometry after cyclin A staining; red box highlights G2-phase cells with low levels of cyclin A. Green indicates the mean intensity of cyclin A per nucleus (0–250). h, Quantification of G2 cells with low levels of cyclin A from g. Data are mean (three technical replicates from three independent experiments). Significance by unpaired two-tailed t-test. P = 0.0131. i, Genome-wide CRISPR screen in CFAP20-KO cells. Genes are ranked by z-score, showing synthetic-viable (blue) interactions with CFAP20. j, Colony formation assay for the indicated cell lines. k, Quantification of sister fork symmetry for the indicated stable cell lines. Data are as in Fig. 1j; significance by one-way ANOVA with Dunnett’s correction. P values from left to right: 0.0006, 0.8623 and 0.7491. l, Quantification of nuclear R-loop signal from the indicated stable cell lines. Data are as in Fig. 1j; significance as in k. P values from left to right: 0.0185, 0.9987, 0.0486 and >0.9999. m, Averaged spike-in normalized metaplots around TSS of RNAPII ChIP–seq for the same 3,000 BrU–seq-positive genes >3 kb in the indicated RPE1 cells.
CFAP20 and Mediator are synthetic viable
We noticed that CFAP20-KO cells grow more slowly than parental cells. Flow-cytometry-based competitive cell-growth assays confirmed that CFAP20-KO cells are rapidly outcompeted by WT cells (Fig. 2c and Extended Data Fig. 4b) and GFP–CFAP20 rescue –cells (Fig. 2d). This led to markedly decreased colony formation in CFAP20-KO cells, which was reversed by re-expression of WT CFAP20 but not by CFAP20(R100C) (Fig. 2e). Quantitative image-based cytometry revealed no obvious differences in cell-cycle profiles between WT and CFAP20-KO cells (Fig. 2f), but showed an increase in the percentage of cyclin A-negative G2 cells in the CFAP20-KO cell population (Fig. 2g,h), suggestive of cell-cycle exit34. To gain genetic insight into the cause of the poor-growth phenotype, we performed a genome-wide CRISPR screen to identify genes whose knockout would improve the fitness of CFAP20-KO cells (Extended Data Fig. 4c). sgRNAs targeting multiple subunits of the Mediator coactivator complex (Fig. 2i) were strongly enriched in our screen, which suggests that Mediator is a driver of the poor fitness in CFAP20-KO cells. To validate these results, we knocked out CCNC (encoding cyclin C, a subunit of the Mediator kinase module) in CFAP20-KO cells (Extended Data Fig. 4d,e). We observed a marked increase in colony formation in CFAP20/CCNC-double-knockout (dKO) cells, compared with single CFAP20-KO cells (Fig. 2j). Knockout of CCNC in a CFAP20-KO background also reversed the increase in cyclin A-negative G2 cells (Extended Data Fig. 4f,g). Thus, inactivation of the Mediator kinase function greatly improves the fitness of human CFAP20-KO cells. Notably, transient knockdown of ccnc in zebrafish larvae did not rescue the anterior–posterior body-axis curvature of the cfap20−/− mutant, and resulted in the development of additional microphthalmia and pericardial oedema (Extended Data Fig. 4h,i). These findings indicate that loss of CCNC does not rescue the ciliary dysfunction caused by the loss of CFAP20 function, but rather that CCNC loss rescues a function of CFAP20 that is unrelated to cilia.