Universal transcriptomic hallmarks of mammalian ageing and mortality
Abstract
Ageing and interventions modulate health and mortality1, yet the underlying molecular mechanisms of this modulation remain unclear. Here we integrate more than 11,000 transcriptomes from more than 25 tissues across 4 mammals (mouse, rat, macaque and human) to develop accurate, interpretable rodent and multi-species biomarkers of chronological age and expected mortality, predicting lifespan-modulating interventions, time to death, chronic diseases and rejuvenation. Ageing-related changes were conserved across species and cell types, revealing universal transcriptomic signatures of mammalian ageing and mortality, including CDKN1A and LGALS3, whose protein levels were also associated with mortality and multimorbidity in UK Biobank. Mortality-associated features were recapitulated across in vivo and in vitro damage-accumulation models, including inflammation, replicative senescence, metabolic inhibition and γ-irradiation, and were attenuated or reversed by cell immortalization, reprogramming, heterochronic parabiosis and early embryogenesis. Network analysis uncovered a modular architecture of ageing- and mortality-associated hallmarks, encompassing inflammation, interferon signalling, mitochondrial function, chromatin modification and extracellular matrix organization. To quantify ageing of individual cellular components, we developed module-specific clocks, which revealed pathway-specific effects of interventions: chronic diseases primarily accelerated inflammatory-module ageing, whereas caloric restriction and Klotho (also known as Kl) deficiency targeted mitochondrial and metabolic modules. Transcriptomic and DNA methylation clocks showed correlated age acceleration in human blood, which was strongest for the chromatin-associated module clock, highlighting mechanistic links between molecular ageing modalities. This study reveals conserved signatures and a modular architecture of mortality regulation, providing a framework for quantifying and targeting ageing of cellular subsystems across species and tissues.
Universal DNA methylation age across mammalian tissues
Targeting the “hallmarks of aging” to slow aging and treat age-related disease: fact or fiction?
Main
Ageing is characterized by systemic damage accumulation, functional decline, and often an exponentially increasing mortality rate1. These manifestations can be modulated by genetic, dietary, and pharmacological interventions, ranging from Hutchinson–Gilford progeria syndrome2 and Klotho-knockout (Klotho-KO)3 to caloric restriction4, rapamycin5 and dwarf models6. Since 2004, the Interventions Testing Program (ITP) has evaluated more than 50 compounds in genetically heterogeneous UM-HET3 mice and identified more than 10 lifespan-extending treatments, including rapamycin5, acarbose7, 17-α-oestradiol7, canagliflozin8 and others9. Although mammalian molecular signatures of ageing10,11,12,13,14 and lifespan-regulating models15,16,17,18 have been described, a unified analysis of mortality-associated mechanisms shared across ageing, lifespan-shortening models and longevity interventions has been lacking.
High-throughput profiling has enabled epigenetic19,20,21,22,23, transcriptomic24,25,26 and proteomic27 clocks that estimate chronological age from molecular profiles of tissues or cell types28,29. Recently, a pan-mammalian DNA methylation clock revealed conserved age-related epigenetic changes across organs and species30. However, biomarkers of mortality and clinical outcomes better reflect cumulative damage burden (molecular age) and improve health prediction31,32,33. Existing DNA methylation mortality clocks are largely restricted to human blood, single-cell applications remain limited, and CpG-based models are often difficult to interpret mechanistically.
By contrast, transcriptomic models are more interpretable because genes are functionally annotated, and expression profiling is widely accessible across tissues and species. Single-cell RNA-sequencing (scRNA-seq) and single-nucleus RNA-sequencing (snRNA-seq) approaches further enable quantification of molecular age across cell types and identification of populations that are most responsive to specific interventions. These features make transcriptomic clocks attractive for characterizing universal mortality signatures at both composite and module-level resolution.
Here we generated RNA-sequencing (RNA-seq) data from UM-HET3 mice subjected to 20 ITP interventions and integrated them with published transcriptomes and survival data, encompassing 4,539 rodent samples across 26 tissues. We developed rodent multi-tissue clocks of chronological age and expected mortality and decomposed them into co-regulated modules representing core cellular components. We further incorporated 6,626 primate samples to develop multi-species, multi-tissue transcriptomic clocks. These tools revealed conserved and model-specific mortality hallmarks across tissues, cell types, chronic diseases and damage or rejuvenation interventions. Finally, we provide the Transcriptomic Age Calculator Online (TACO; https://app.gladyshevlab.org/TACO/) web app and the R package tAge to facilitate application of these biomarkers.
Rodent biomarkers of ageing and lifespan
To identify gene expression signatures of lifespan and mortality, we profiled livers from 170 old (22-month-old) genetically heterogeneous UM-HET3 male and female mice exposed to 20 pharmacological ITP interventions or control diets together with 12 young (4- to 6-month-old) controls (Fig. 1a and Supplementary Table 1a). The intervention panel included survival-neutral, detrimental and beneficial compounds, including interventions that robustly extend lifespan in males and/or females (rapamycin, canagliflozin, captopril, 17-α-oestradiol and rapamycin plus acarbose). This design enabled joint analysis of ageing- and lifespan-regulating molecular changes within a unified mortality framework.
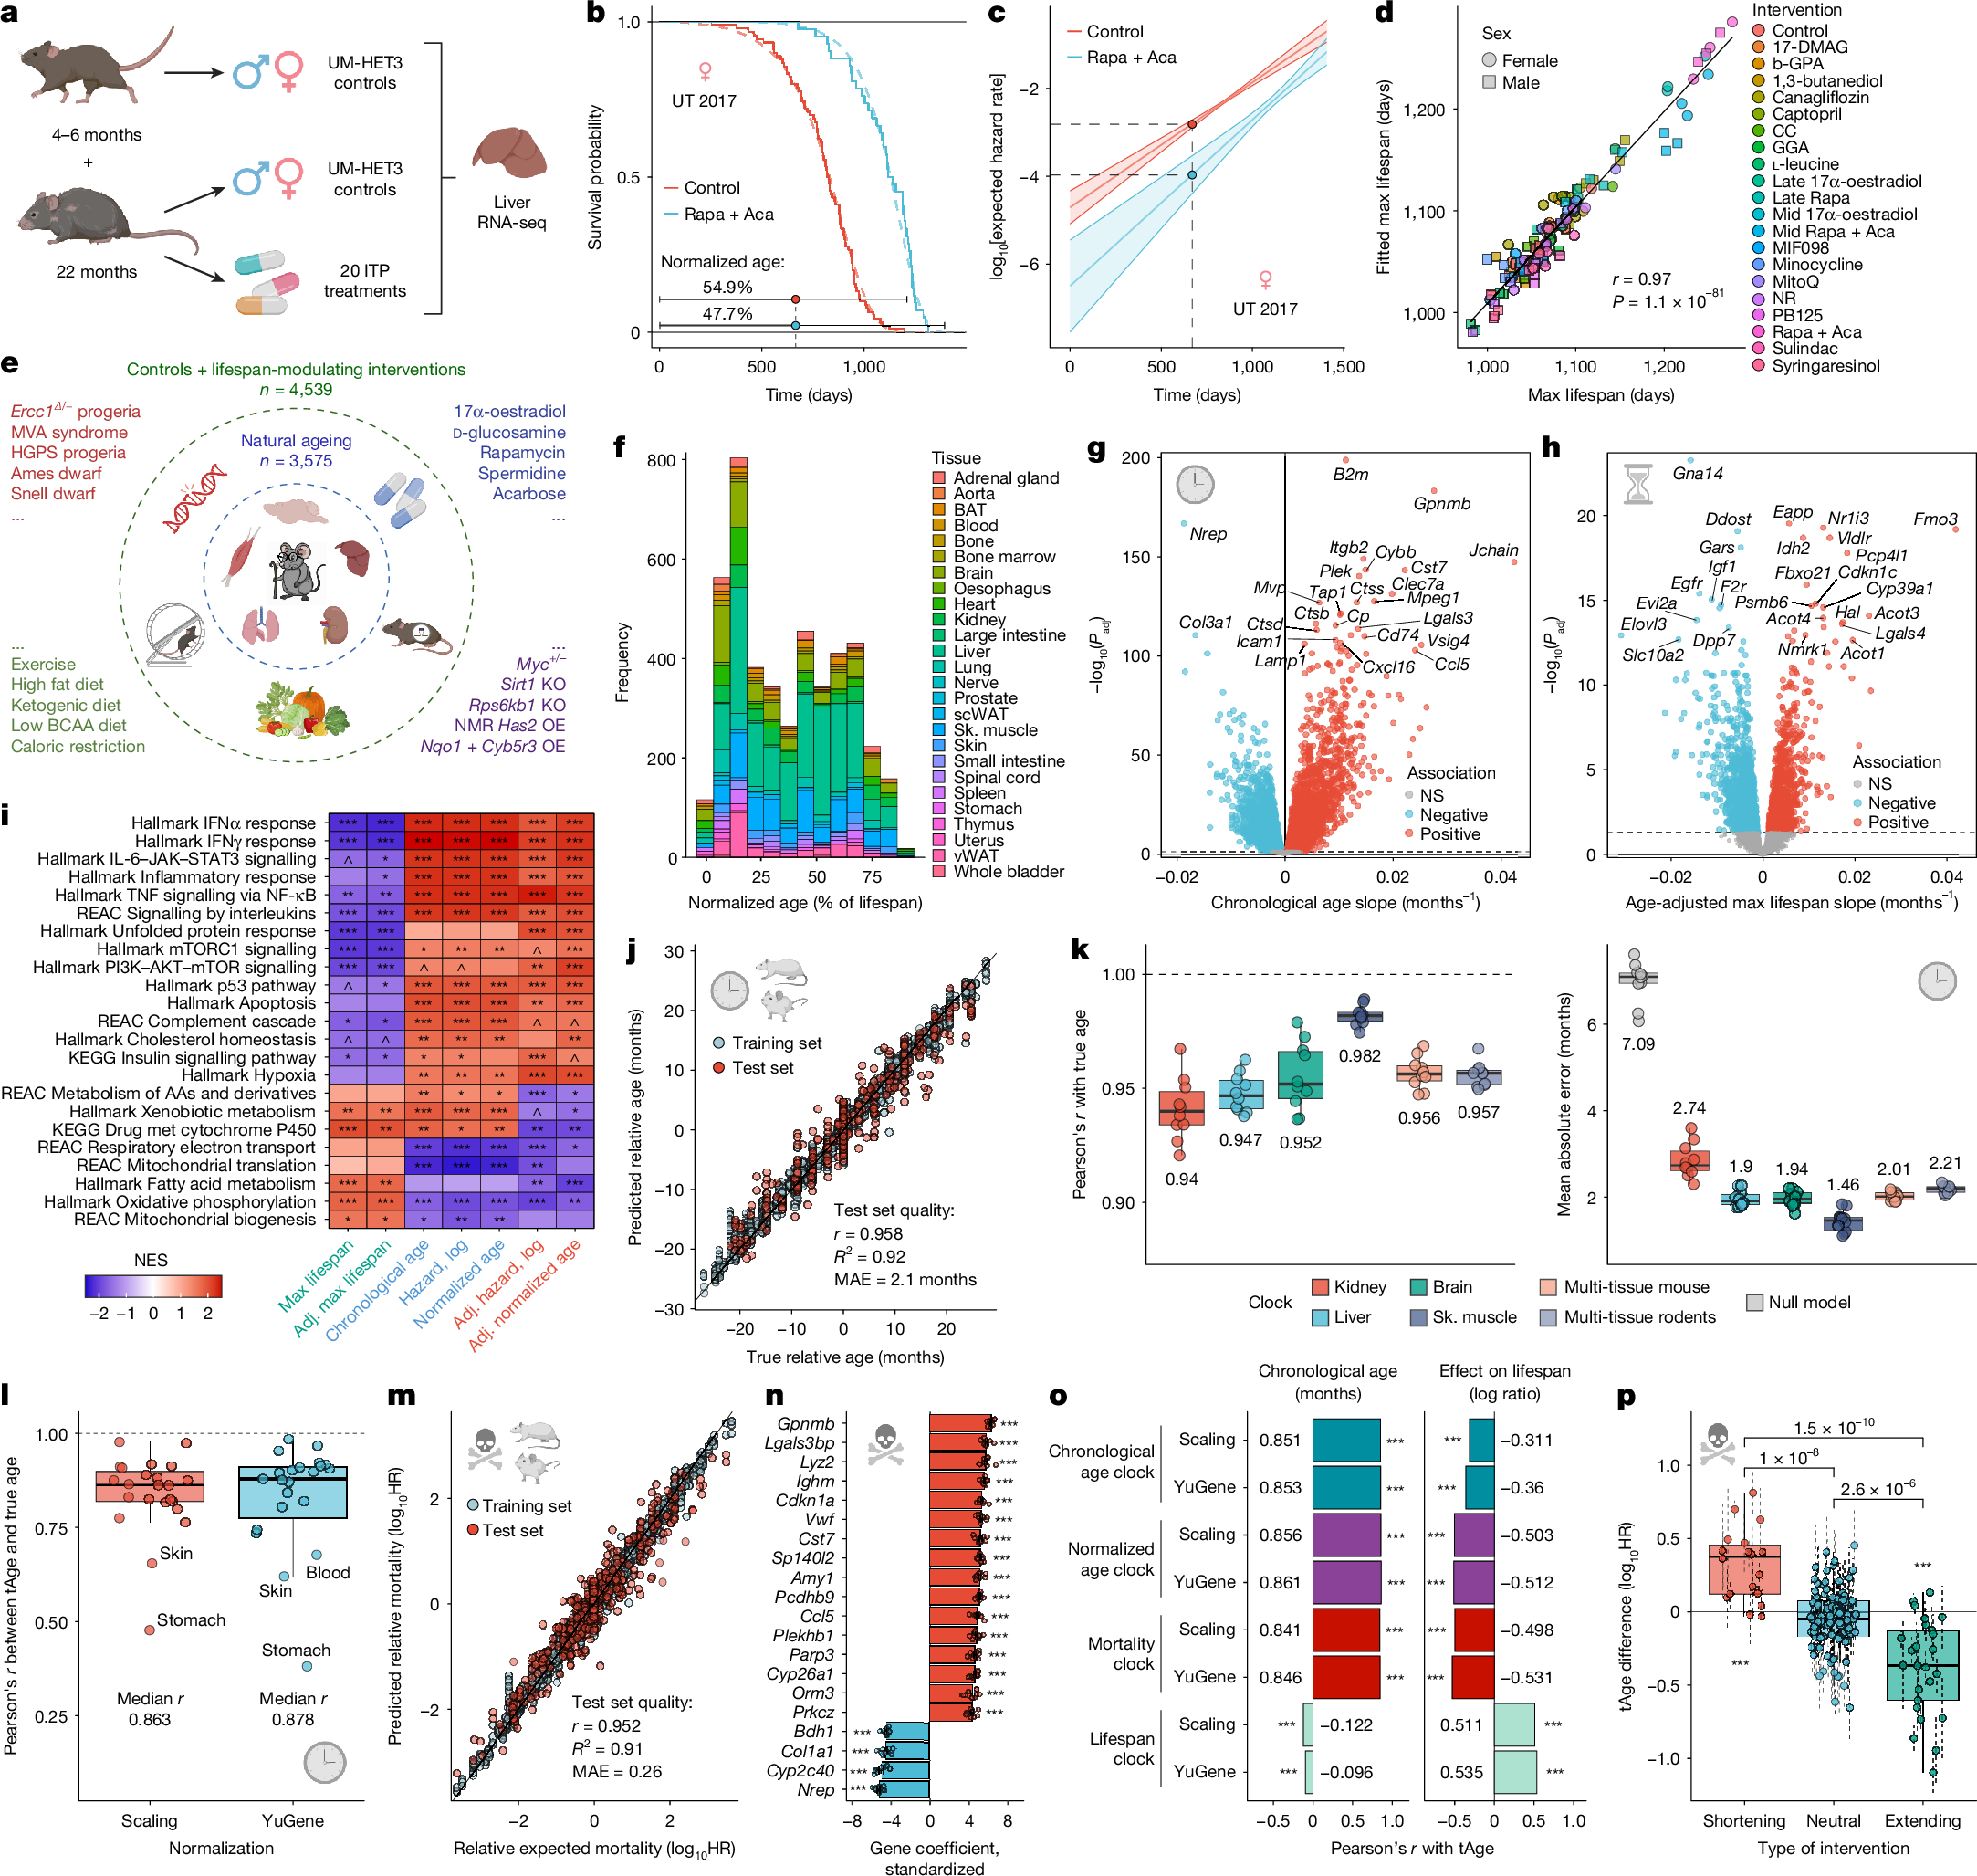
a, Overview of sequenced ITP samples. Schematic created in BioRender; Tyshkovskiy, A. https://BioRender.com/on7cpyb (2026). b, Survival of control ITP mice and animals treated with rapamycin (Rapa) and acarbose (Aca), with labelled normalized ages at a given chronological age. UT 2017, University of Texas 2017 cohort. c, Gompertz fits of expected all-cause mortality from b. Solid lines show model-based point estimates; shaded bands show 95% confidence interval; dots indicate estimated log hazard rate at the specified age. d, Maximum lifespan (90th percentile) from raw survival data (x axis) or Gompertz fit (y axis) across ITP cohorts. Pearson’s r and P value are labelled. 17-DMAG, 17-dimethylaminoethylamino-17-demethoxygeldanamycin hydrochloride; b-GPA, b-guanidinopropionic acid; CC, candesartan cilexetil; GGA, geranylgeranyl acetone; late, late-life; max, maximum; mid, mid-life; MIF098, 3-(3-hydroxybenzyl)-5-methylbenzo[d]oxazol-2(3H)-one; NR, nicotinamide riboside. e, Schematic of mouse and rat tissue gene expression samples aggregated for meta-analysis. NMR, naked mole rat; OE, overexpression; BCAA, branched-chain amino acid; HGPS, Hutchinson–Gilford progeria syndrome; KO, knockout; MVA, mosaic variegated aneuploidy. Schematic created in BioRender; Tyshkovskiy, A. https://BioRender.com/l2uq7vs (2026). f, Normalized ages and tissues for rodent samples (n = 4,539). Normalized age is the fraction of expected maximum lifespan (99.9th percentile) for a given age, strain, sex and intervention. BAT, brown adipose tissue; scWAT, subcutaneous white adipose tissue; Sk., skeletal; vWAT, visceral white adipose tissue. g, Chronological age gene expression signature from control animals (n = 3,575); slopes and Benjamini–Hochberg-adjusted P values were computed with mixed-effects models. NS, not significant. h, Transcriptomic signature of expected maximum lifespan (99.9th percentile) adjusted for age (n = 4,539); slopes and Benjamini–Hochberg-adjusted P values were computed with mixed-effects models. i, GSEA of signatures of ageing, maximum lifespan, normalized age and expected mortality, unadjusted and adjusted for age. Benjamini–Hochberg-adjusted P values were computed using GSEA permutation tests. Full results are in Supplementary Table 3b. AAs, amino acids; Adj., adjusted; KEGG, Kyoto Encyclopedia of Genes and Genomes; met, metabolism; NES, normalized enrichment score; REAC, Reactome. j, Performance of elastic net rodent multi-tissue transcriptomic clock of relative chronological age (scaling normalization) on training (n = 3,217) and test (n = 358) sets. Pearson’s r, R2 and MAE on test set are provided. k, Accuracy of organ-specific and multi-tissue relative chronological age clocks across ten randomly selected test sets. Median metrics are labelled; null-model MAE in grey. l, Leave-one-tissue-out performance of the elastic net multi-tissue chronological age clock (n = 23 tissues). Median Pearson’s r across tissues is labelled. m, Performance of elastic net rodent multi-tissue transcriptomic clock of relative expected mortality (YuGene-based) on training (n = 4,038) and test (n = 449) sets. HR, hazard ratio. n, Top 20 genes with largest absolute coefficients in the elastic net mortality clock (YuGene-based). Data are mean standardized coefficients ± s.e.m. n = 10 randomly selected training sets; significance was tested with one-sample t-test. o, Accuracy of elastic net clocks in predicting chronological age (left) and intervention lifespan effects (right) in independent datasets (Pearson’s r). Lifespan effect was computed for each dataset, sex and intervention as the log-ratio of maximum lifespan for treated versus control animals. Median r is labelled. ^P < 0.1, *P < 0.05, **P < 0.01, ***P < 0.001. p, Mean mortality tAge differences between treated and control samples across lifespan-shortening (n = 18), neutral (n = 91) and lifespan-extending (n = 25) interventions, evaluated separately for each dataset and sex using elastic net rodent multi-tissue mortality clock. Deviation from zero and between-group differences were tested with mixed-effects models; Benjamini–Hochberg-adjusted P values are labelled. Data are ANOVA coefficients ± standard error (s.e.). In box plots, the centre line is the median, box edges delineate interquartile range (IQR) and whiskers extend to ±1.5× IQR. All tests were two-sided where applicable. P values were Benjamini–Hochberg-adjusted unless noted; asterisks denote Benjamini–Hochberg-adjusted P values: ^Padj < 0.1; *Padj < 0.05; **Padj < 0.01; ***Padj < 0.001. Icons in g,h,j–n,p created in BioRender; Tyshkovskiy, A. https://BioRender.com/hqvg5ka (2026).
To estimate expected all-cause mortality for each animal, we fitted Gompertz models to ITP survival data for each cohort, sex, site and intervention (Fig. 1b), and aggregated cohort-level fits by sex and intervention into Gompertz meta-models (Extended Data Fig. 1a,b). For each sequenced mouse, we then calculated expected log hazard rate (Fig. 1c) as the mean prediction from the cohort-specific fit and its corresponding meta-model given age and experimental group (Methods). Model-simulated 90th percentile lifespans closely matched empirical estimates from survival curves (Fig. 1d), supporting the use of Gompertz fits to capture intervention effects on longevity. We also computed normalized age as chronological age divided by expected maximum (99.9th percentile) lifespan (Extended Data Table 1), yielding two composite metrics—expected mortality and normalized age—that integrate chronological ageing with intervention-induced lifespan modulation.
Principal component analysis (PCA) of liver transcriptomes separated samples primarily by sex (Extended Data Fig. 1c). Regression across cohorts identified 700–1,457 genes (adjusted P value (Padj) < 0.05) associated with chronological age, normalized age, expected mortality and maximum lifespan after adjustment for sex and site (Supplementary Table 2a–g). Comparison of regression slopes across traits revealed positive correlation of chronological ageing signature with age-adjusted signatures of normalized age and expected mortality and its negative correlation with the lifespan signature (Extended Data Fig. 1d), suggesting that age-associated expression changes largely track health deterioration rather than neutral drift. These signatures were highly concordant between sexes (Extended Data Fig. 1e) despite the sex-specific lifespan-extending effects of certain interventions, such as 17-α-oestradiol and canagliflozin7,8,9.
Among the top genes that were positively associated with maximum lifespan and negatively associated with chronological age and expected mortality, we identified Gpx1 (Extended Data Fig. 1f,g), encoding glutathione peroxidase 1, whose overexpression ameliorates murine age-related renal pathology34. Other oxidative stress and metabolic genes, including several cytochrome P450 and fatty acid metabolism enzymes, showed similar trends.
Gene set enrichment analysis (GSEA) identified pathways that were positively associated with lifespan and negatively associated with ageing and mortality (Supplementary Table 3a), including oxidative phosphorylation, mitochondrial biogenesis, xenobiotic metabolism and fatty acid metabolism, whereas interferon signalling and haemostasis showed the opposite pattern (Extended Data Fig. 1h). Pathway-level enrichment scores mirrored gene-level relationships across traits (Extended Data Fig. 1i).
To generalize beyond ITP, we assembled a rodent gene expression meta-dataset comprising 3,575 mouse and rat samples across 26 tissues, spanning a broad age range (4–943 days) and multiple strains (Extended Data Fig. 1j), together with 964 additional samples from animals subjected to diverse pharmacological, genetic, dietary, and environmental interventions with extending, shortening, or neutral effects on lifespan (Fig. 1e). In total, this yielded 4,539 rodent transcriptomes across 96 data sources and 79 interventions (Supplementary Table 1b).
Using published survival data, we again fitted cohort-specific and aggregated Gompertz models by strain, sex and intervention to compute expected log hazard rate, normalized age and maximum lifespan for each sample (Fig. 1f and Extended Data Fig. 1k). Consistently, model-simulated 90th percentile lifespans closely tracked empirical estimates (Extended Data Fig. 1l). Expected mortality increased with age and was modulated by genetic background, progeroid models, high-fat diets and lifespan-extending treatments (Extended Data Fig. 1m).
For cross-study multi-tissue signatures, we computed relative expression by centring each sample to the median profile of a randomly selected matched control group within the same dataset, tissue and sex (Methods). Linear mixed-effects models revealed 9,059–9,167 genes associated with chronological age, normalized age and expected mortality (Padj < 0.05), and 3,098–4,439 genes associated with maximum lifespan and mortality-related traits after age adjustment (Fig. 1g,h, Extended Data Fig. 1n and Supplementary Table 2h–n), indicating systemic regulation of longevity and mortality at the molecular level.
Notable genes negatively associated with lifespan included Igf1, a canonical longevity regulator within and across species13,35, and Ddost, which is involved in advanced glycation end product processing and linked to poorer cancer survival36, whereas pro-longevity genes included Fmo3, an mTOR and inflammation inhibitor, and Nmrk1, which is involved in NAD+ biosynthesis. Igf1 expression tended to decline with age, whereas Fmo3 expression increased (Extended Data Fig. 1o), indicating that ageing-related changes include both detrimental and compensatory components.
Consistent with results from ITP, signatures of chronological age overlapped with age-adjusted mortality signatures and opposed lifespan signatures at gene and pathway levels (Extended Data Fig. 1p–r). Interferon, interleukin and p53 signalling, complement and coagulation, and other inflammatory and stress-response programmes were negatively associated with lifespan and positively associated with ageing and mortality, whereas oxidative phosphorylation and mitochondrial translation showed the opposite pattern (Fig. 1i and Supplementary Table 3b). Fatty acid and xenobiotic metabolism were also negatively associated with mortality, supporting roles in longevity regulation15,17,37 and accumulated damage clearance