Passive heart-rate monitoring during smartphone use in everyday life
Abstract
Resting heart rate (RHR) is a key biomarker of cardiovascular health and mortality1,2,3, but passively tracking it longitudinally generally requires a wearable device, limiting its availability. Here we present passive heart-rate monitoring (PHRM), a deep-learning system that uses facial video-based photoplethysmography for passive measurements of heart rate (HR) and RHR during everyday smartphone interactions. Our system was developed using 192,353 videos from 485 participants and validated on 162,546 videos from 211 participants in laboratory and free-living conditions, representing, to our knowledge, the largest validation study of its kind. PHRM outperformed state-of-the-art methods on our benchmarks. Compared with reference electrocardiograms, PHRM achieved a mean absolute percentage error (MAPE) lower than 10% for HR measurements across three skin-tone groups of light, medium and dark pigmentation, meeting industry accuracy standards; MAPE for each skin-tone group was non-inferior versus the others. Daily RHR measured by PHRM had a mean absolute error of less than five beats per minute, compared with a wearable HR tracker, and was associated with known risk factors for cardiovascular disease. These results highlight the potential of smartphones for enabling passive and equitable monitoring of heart health. To facilitate further research, we publicly release a large, annotated smartphone video dataset along with a pre-trained HR model.
Prospective validation of smartphone-based heart rate and respiratory rate measurement algorithms
Monitoring long-term cardiac activity with contactless radio frequency signals
Adaptive physiology-informed correction for reliable remote photoplethysmography heart-rate monitoring
Main
Heart rate (HR) is an important and dynamic vital sign that is influenced by numerous inputs4, and resting heart rate (RHR) is recognized as a biomarker and prognostic factor for overall mortality1,2,3. Longitudinal increases in RHR are associated with higher mortality and adverse cardiovascular events5,6,7. Measurement of RHR conventionally requires a sustained period of rest, which limits the practicality of evaluating long-term trajectories. However, the sensitivity of HR to various factors suggests that the cardiovascular system is better assessed through multiple daily measurements than through brief, standardized clinic-based measurements8,9,10. Daily average HR has been shown to be a strong independent predictor of all-cause mortality11, even more so than clinic-measured RHR, and consumer wearable devices typically derive a daily RHR by passively aggregating HR measurements during periods of rest throughout the day12. Daily RHR monitoring can provide insights into cardiovascular health and detect physiological changes linked to fitness levels or illness13,14,15. Nonetheless, the adoption of consumer wearables, while growing, remains limited, especially among those who are most likely to benefit from these health-monitoring technologies16. Given that smartphones are already ubiquitous—owned by 90% of US adults and 69% of people globally17, and used 144 times daily, on average18—they offer an attractive alternative for opportunistic HR measurements across the day during normal phone use. The blood volume pulse can be measured from a distance using a technique called video-based remote photoplethysmography (rPPG)19,20, which can measure HR21,22,23,24 and screen for irregular rhythms, such as atrial fibrillation25, through smartphone cameras. However, existing rPPG studies have small sample sizes, are limited to controlled environments and face generalizability issues in real-world conditions. Crucially, the accuracy of current rPPG methods is known to drop significantly for darker skin tones, owing to an increased concentration of melanin26. Similar concerns apply to other PPG-based devices, such as pulse oximeters, which has led to scrutiny and calls for diversity in validation studies from health governing bodies like the US Food and Drug Administration (FDA) and the UK National Health Service (NHS)27,28. Furthermore, as previous rPPG studies have mainly involved active HR measurements in situated conditions, there remains a need to address passive HR measurements during everyday phone use under unconstrained, free-living conditions.
In this study, we present a smartphone-based deep-learning system that enables passive measurements of both HR and daily RHR in the background during normal phone use (collectively referred to as passive heart-rate monitoring; PHRM). Compared with previous work, our system provides several advances. First, we validate its performance in a prospective study on a large and diverse set of videos (more than 162,000), collected in laboratory conditions as well as in free-living, real-world conditions using participants’ personal phones. Second, our system meets industry accuracy standards and achieves prespecified non-inferiority targets for people of all skin tones, demonstrating its potential for equitable HR monitoring. PHRM outperformed state-of-the-art methods on our benchmarks. Third, we show that PHRM-derived daily RHR also achieves prespecified levels of accuracy and is associated with well-established cardiovascular health metrics and risk factors. Finally, we publicly release both a pre-trained HR model and a large and diverse smartphone video dataset comprising all skin pigmentation groups with reference HR labels to facilitate further research.
Overview of the system
We designed and developed the PHRM system with two major components (Fig. 1). First, we constructed an end-to-end HR estimation module that takes as input a short (eight-second) video clip of the user’s face, performs video stabilization and preprocessing (by face cropping, resizing, interpolating and computing frame differences) and predicts HR along with a measure of confidence using an ensemble29 of computationally efficient temporal shift convolutional neural networks (TSCNNs)24. We introduced a deep-learning architecture that reframes HR estimation as a multi-class classification problem over a discretized range of biologically plausible HRs (40–180 beats per minute; bpm). This distributional output allows the model to express uncertainty. If there is a high degree of uncertainty in the model’s estimation of HR (for example, owing to extreme motion), the probability distribution flattens, whereas a regression model would be forced to output a single—probably erroneous—point estimate. Next, we designed an algorithm to derive daily RHR by aggregating the HR predictions throughout the day using the confidence of predictions and a Kalman filter. PHRM was designed to run passively in the background and automatically initiate video capture via the front-facing camera on a screen-unlock event.
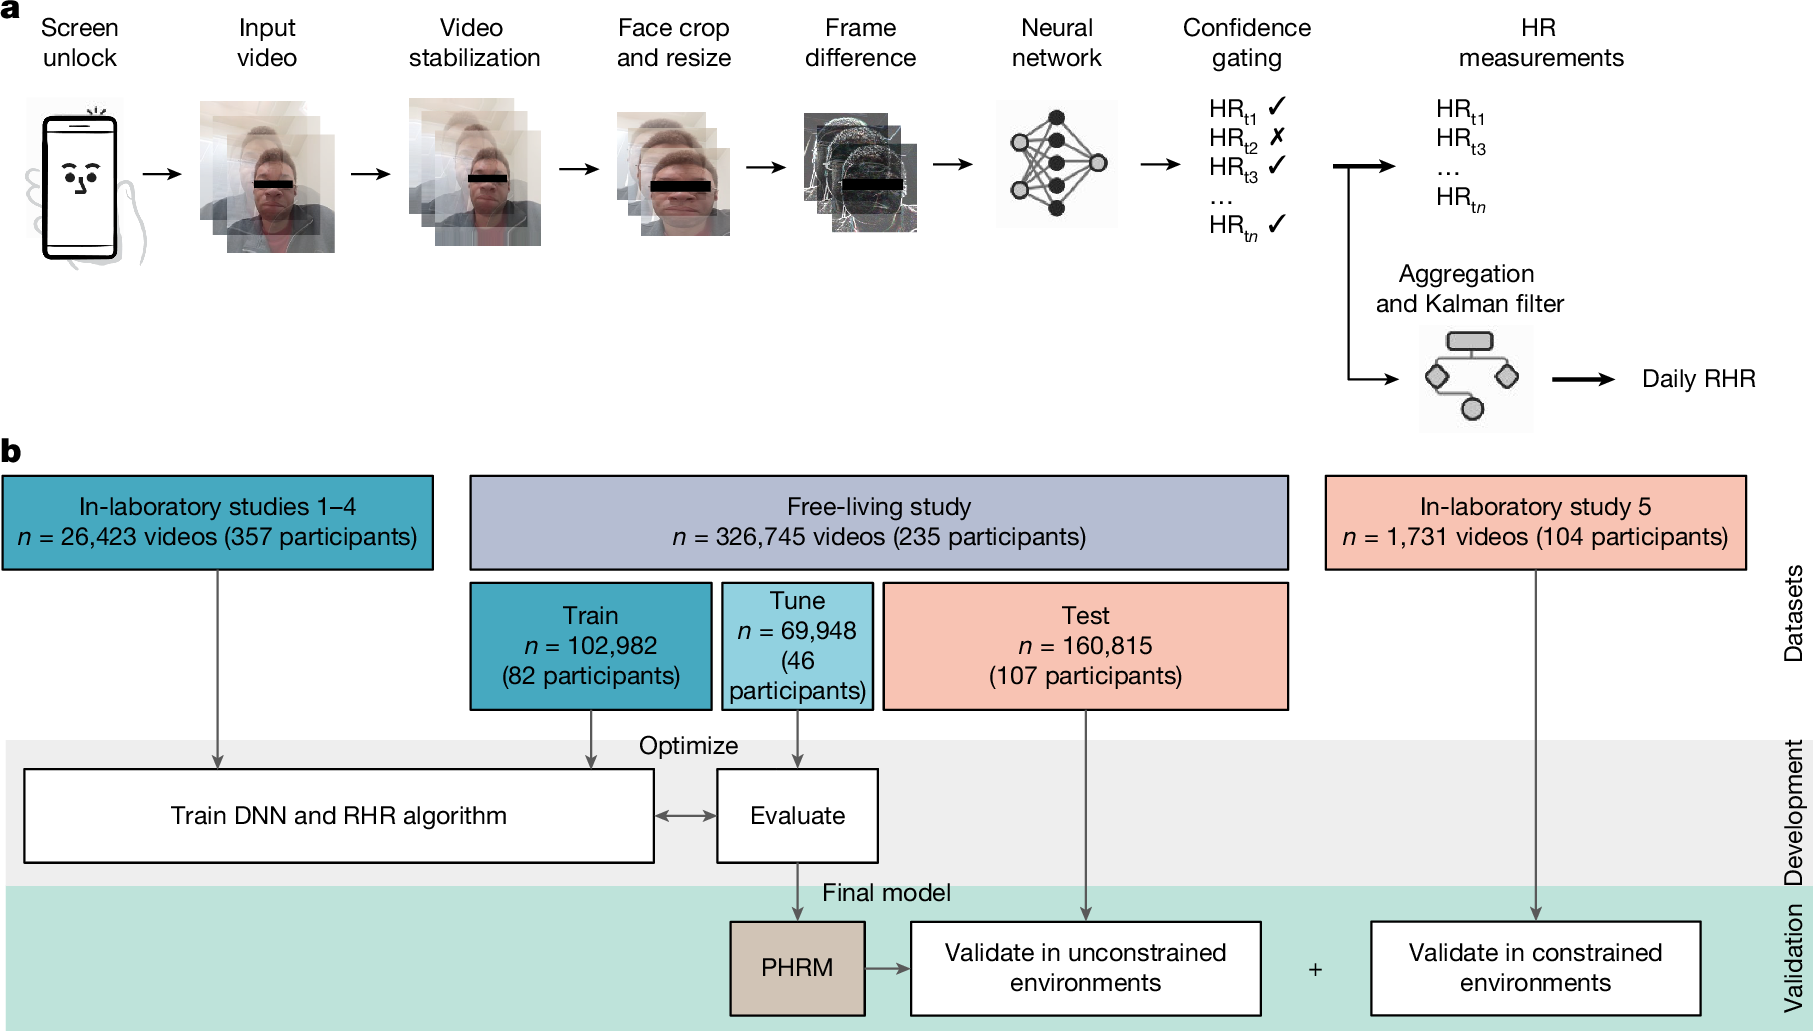
a, In our research study with consented participants, after a screen-unlock event, PHRM passively captures, processes and analyses 8-s facial video clips using a deep neural network (DNN) to estimate HR and associated prediction confidence to determine whether the measurement is valid. To compute daily RHR, PHRM aggregates valid HR measurements from intermittent 8-s video clips throughout a single day and applies a Kalman filter to improve estimates. b, Workflow diagram of the studies used to develop and validate the PHRM system. We used data from five independent, prospective laboratory studies and a prospective free-living study.
Study populations
To develop and validate PHRM, we conducted a series of studies to acquire datasets comprising face videos and HR ground truth (Table 1). In all of our studies, we recruited for diversity across age, sex and skin-tone groups. We used the electrocardiogram (ECG) as the reference HR ground truth for both the laboratory-based and the free-living validation studies. In total, we collected 192,353 videos from 485 participants for PHRM development, and 162,546 videos from 211 participants for PHRM validation.
First, we obtained data to train and tune PHRM from four separate studies performed in controlled laboratory settings (n = 26,423 videos from 357 participants). This data comprises a variety of lighting conditions and physiological states, including at rest, during various exercises and after exercise (Extended Data Table 1). To provide an external test set for model validation, we conducted a fifth, prospective laboratory study that enrolled 104 participants (n = 1,731 videos) and captured videos under 5 different lighting conditions and in both at-rest and post-exercise physiological states. The mean age in this external test set was 51.3 ± 14.8 years; 71 (68.3%) participants were female. We divided participants into three groups of skin pigmentation (Fitzpatrick I–III, Fitzpatrick IV–V and Fitzpatrick VI) by converting their objective individual topology angle (ITA)—as measured by a spectrocolorimeter at the cheeks and forehead—into Fitzpatrick skin types30. We specified these skin-tone groups to intentionally overrepresent participants of the darkest skin tones and ensure that models were developed that perform accurately for this group, a decision that aligned with the three skin pigmentation cohorts subsequently proposed by the FDA27. ITA values ranged from −73.48° to 88.81°, with 44 (42.3%), 25 (24.0%) and 35 (33.7%) participants in skin pigmentation group 1 (lightest), 2 (medium) and 3 (darkest), respectively.
Next, we conducted a prospective free-living study designed to passively record face videos during normal personal phone use in everyday life during an eight-day period. The detailed video recording protocol is provided in the Supplementary Information. We applied stratified sampling on the basis of age, sex, body mass index (BMI) and the Monk Skin Tone (MST) scale to split the free-living data at the participant level: data from 50% of the participants (n = 165,930 videos from 128 participants) were set aside for model development (30% for training and 20% for tuning), and data from the remaining 50% of participants (n = 160,815 videos from 107 participants) were set aside as the test split for validation. We switched to using the MST in the prospective free-living study because it was designed to be more inclusive of the spectrum of skin tones that we see in our society (the laboratory studies took place before the introduction of MST and used the Fitzpatrick scale, the de facto industry standard at that time). The mean age in the test split of the free-living study was 37.9 ± 11.4 years; 57 (53.3%) participants were female. Following the FDA’s proposal, the entire range of skin pigmentation based on the self-reported MST was represented with at least one participant for each MST value of 1–10. We divided participants into three MST cohorts, yielding 39 (36.4%), 29 (27.1%) and 39 (36.4%) participants in the MST 1–4, MST 5–7 and MST 8–10 cohorts, respectively. This distribution also fulfilled the FDA recommendations to have at least 40% of each sex, and at least 25% of participants in each of the three MST cohorts. Six individuals in the test split did not meet the minimum adherence criteria (that is, at least 3 days with more than 40 video clips per day; Supplementary Fig. 2), yielding 101 participants (n = 158,471 videos) for our final analysis of free-living performance.
Participants uploaded 230.7 ± 172.2 face videos per day. The distribution of the video upload rate per participant was strongly left-skewed (Extended Data Fig. 2); most participants uploaded a high proportion of their videos (mode = 95%, median = 84.4% and interquartile range (IQR) = 22.9%). These videos were recorded passively throughout the day during normal personal phone use after a screen-unlock event. As expected, the unconstrained nature of free-living use and passive recordings yielded videos with a diversity of environments, lighting conditions, camera angles and face coverings (Fig. 2a). These videos spanned all hours of the day, and a wide range of lux and smartphone motion levels, as measured by the smartphone ambient light sensor and accelerometer, respectively (Fig. 2c). Illuminance measurements captured by the ambient light sensor spanned the full dynamic range of daily life (Supplementary Table 7). Although most of the recordings occurred under typical indoor lighting categorized as dim (45.6%) or bright (32.4%), substantial subsets captured challenging extremes, including dark conditions (14.2%) and outdoor environments (7.8%). We randomly sampled skin patches from video-frame crops of participant’s cheeks to visualize the range of skin pigmentation under various lighting conditions across the MST range (Fig. 2b). Concurrently, smartphone sensors characterized a broad spectrum of user behaviour (Supplementary Table 8). Android activity recognition classified the majority of videos as being recorded while users were still (79.7%), followed by walking (16.0%), being in a vehicle (4.1%) and running (0.3%). To assess ecological representativeness, we benchmarked these distributions against a large (n = 10,155) independent dataset of US adults showing typical patterns of smartphone use31. Although the requirement for active screen engagement naturally shifted specific proportions, yielding lower in-vehicular usage (4.1% versus 10.5%) and higher ambulatory activity (16.0% versus 7.3%), the persistence of diverse locomotive states similar to that in the independent dataset confirms that our dataset captures a realistic cross-section of daily life filtered through natural phone usage patterns. Accelerometer-based step counters revealed finer-grained motion dynamics during these states (Supplementary Table 9); users were rarely completely stationary (non-movement: 5.0%), with most videos capturing incidental steps (52.7%) and sporadic movement (15.1%). Distinct locomotive patterns were also well-represented, ranging from purposeful stepping (9.6%) to walking at varying paces (17.1%).
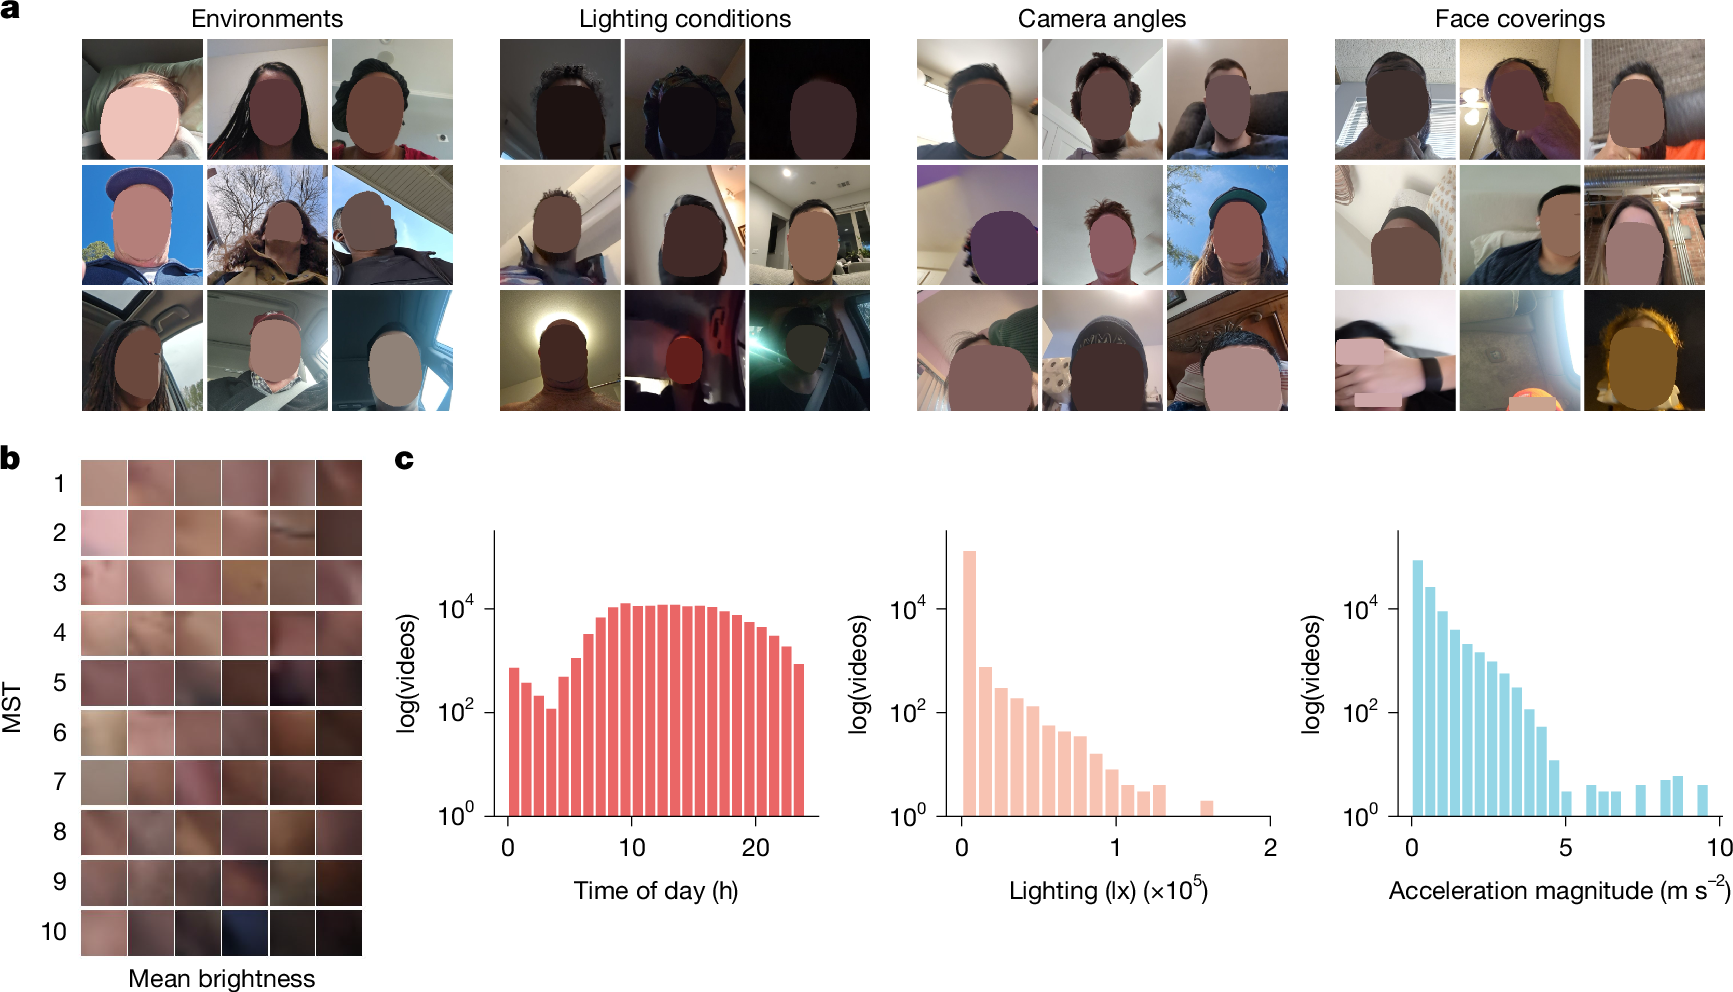
a, Illustrative examples of the variety of environments, lighting conditions, front-facing camera angles and face obstructions for videos captured in the free-living conditions. b, Examples of facial skin patches randomly sampled from video frames of the cheeks of participants across the full range of MST values. Videos are sorted by mean brightness across columns and MST across rows. c, From left to right: histograms of the number of 8-s video clips by time of day; illuminance measured by the smartphone ambient light sensor; and the average magnitude of linear acceleration of the smartphone during the videos.
In-laboratory HR test performance
We first investigated how well smartphones measure HR in controlled conditions by comparing PHRM predictions with HR measured by the reference ECG. In the prospective laboratory study, comprising 104 participants, we successfully obtained a valid HR measurement (by gating on the confidence scores associated with the PHRM predictions; see details in Methods) in 1,360 out of 1,750 face videos (77.7%). The one participant from whom we did not obtain any valid HR measurements was seated far from the camera, resulting in a high failure rate (62.5%) of detecting the facial landmarks that are needed to perform video stabilization. Compared with the reference ECG HR, PHRM achieved a mean absolute error (MAE) of 4.09 (95% confidence interval (CI): 3.03, 5.33) and a mean absolute percentage error (MAPE) of 5.65% (95% CI: 4.25, 7.29) at the participant level in the overall study population (Extended Data Table 1). The MAPE values for all five lighting conditions and for both the at-rest and the post-exercise conditions were significantly lower than the prespecified study target of 10% (P < 0.001), according to the American National Standards Institute (ANSI) and Consumer Technology Association (CTA) ANSI/CTA-2065 standard32, indicating robustness across lighting and physiological conditions. The MAPE for the post-exercise condition (2.74%) was lower than that for the at-rest condition (6.01%), which seems counterintuitive, because the post-exercise state is expected to be more challenging, owing to motion, heavy breathing and rapid changes in HR; this result might be due to the effectiveness of the use of measurement gating to remove erroneous estimates under such noisy conditions. Indeed, the PHRM measurement success rate while participants were at rest was 78.4% (95% CI: 76.3, 82.5), which was higher than the 62.1% (95% CI: 56.6, 67.6) success rate after exercise (Extended Data Table 2).
The Bland–Altman plot showed minimal bias (−0.7) and 95% limits of agreement, adjusted for multiple measurements per participant, between −12.9 and 11.5 bpm (Extended Data Fig. 1). The participant-level MAPE by skin-tone group was 3.81% (95% CI: 2.43, 5.94) for group 1, 4.43% (95% CI: 3.12, 6.06) for group 2 and 8.93% (95% CI: 5.60, 12.60) for group 3; all were significantly lower than 10% (P < 0.025). The MAPE was highest for group 3 under incandescent lighting.
For comparison, we evaluated 15 rPPG models from 2019 to 2025, representing the current state of the art in rPPG, on this external test set. These models comprise a hue-channel-based signal processing algorithm (Savur33) and deep-learning-based architectures including PhysNet34, TS-CAN24, EfficientPhys