Dominant contribution of Asgard archaea to eukaryogenesis
TL;DR
A comprehensive phylogenetic analysis reveals that Asgard archaea contributed dominantly to the origin of most core eukaryotic functional systems, with a limited role for Alphaproteobacteria and sporadic bacterial gene acquisitions, supporting a eukaryogenesis model where key cellular features evolved in the Asgard lineage before mitochondrial endosymbiosis.
Key Takeaways
- •Asgard archaea are the primary source of most conserved eukaryotic genes, indicating their crucial role in eukaryogenesis.
- •Alphaproteobacteria contributed mainly to energy transformation and Fe–S cluster biogenesis, with other bacterial inputs being scattered and inconsistent.
- •The findings support a model where eukaryotic cellular complexity evolved in the Asgard lineage, followed by mitochondrial capture and sporadic horizontal gene transfers.
Tags
Abstract
The origin of eukaryotes is one of the key problems in evolutionary biology1,2. The demonstration that the last eukaryotic common ancestor (LECA) already contained the mitochondrion—an endosymbiotic organelle derived from an alphaproteobacterium—and the discovery of Asgard archaea—the closest archaeal relatives of eukaryotes3,4,5,6,7—inform and constrain evolutionary scenarios of eukaryogenesis8. We conducted a comprehensive analysis of the origins of core eukaryotic genes tracing to the LECA within a rigorous statistical framework centred around evolutionary hypothesis testing using constrained phylogenetic trees. The results show dominant contributions of Asgard archaea to the origin of most of the conserved eukaryotic functional systems and pathways. A limited contribution from Alphaproteobacteria was identified, relating primarily to energy transformation systems and Fe–S cluster biogenesis, whereas ancestry from other bacterial phyla was scattered across the eukaryotic functional landscape, without clear, consistent trends. These findings imply a model of eukaryogenesis in which key features of eukaryotic cell organization evolved in the Asgard lineage leading to the LECA, followed by the capture of the alphaproteobacterial endosymbiont and augmented by numerous but sporadic horizontal acquisitions of genes from other bacteria both before and after endosymbiosis.
Main
Eukaryotes drastically differ from archaea and bacteria (collectively, prokaryotes) by the complex organization of eukaryotic cells. The signature features of this organizational complexity include the eponymous nucleus, the endomembrane system, the elaborate cytoskeleton and the energy-converting mitochondrion, which evolved from an alphaproteobacterial endosymbiont9. Early eukaryogenesis models featured an amitochondrial protoeukaryote that captured and domesticated an alphaproteobacterium at a relatively late stage of evolution10,11. However, subsequent research revealed no primary amitochondrial eukaryotes although many have secondarily lost mitochondria12. Thus, the last eukaryotic common ancestor (LECA) probably already possessed mitochondria along with the other signatures of the eukaryotic cellular organization1,2,8. These findings lend credence to scenarios of eukaryogenesis in which mitochondrial endosymbiosis triggered cellular reorganization, giving rise to eukaryotic cellular complexity1,2,8,13,14,15.
Phylogenomic analyses show that the core genes of eukaryotes that can be traced to the LECA are a mix originating from archaea and various bacteria and, in early studies, the bacterial contributions quantitatively exceeded the archaeal ones1. The archaea-derived genes were found primarily in information-processing systems (replication, transcription and translation), whereas genes of apparent bacterial origin comprised the operational component of the eukaryotic gene complement, in particular encoding metabolic enzymes16,17,18,19.
The study of eukaryogenesis was transformed by the discovery and exploration of Asgard archaea (currently, phylum Promethearchaeota within kingdom Promethearchaeati20,21, hereafter Asgard) which includes the closest known archaeal relatives of eukaryotes3,4,5,6,7. Phylogenetic analyses of conserved genes have been pushing the eukaryotic branch progressively deeper within the Asgard tree. The latest such analysis identified the order Hodarchaeales, within the Asgard class Heimdallarchaeia, as the likely sister group of eukaryotes4. However, with the continued influx of Asgard sequence data, the exact affinity of eukaryotes within Asgard remains a moving target22,23. Notably, Asgard archaea encode, express and use homologues of a broad variety of eukaryote signature proteins beyond the core information-processing componentry, in particular, cytoskeletal proteins and proteins involved in membrane remodelling4,5,7,24,25. Furthermore, these genes of Asgard archaea have undergone extensive duplication and subfunctionalization pre-LECA, suggesting their prominent role in eukaryogenesis26.
Many models of eukaryogenesis have been proposed, differing with respect to the timing, topology and origin of the eukaryotic cellular organization and genetic repertoire1,2,8. The endosymbiotic origin of the mitochondria from an alphaproteobacterium is indisputable, but the nature of the host of the proto-mitochondrial endosymbiont remains a matter of debate. The most straightforward models posit an Asgard host2,8,27. However, a principal conundrum for such scenarios of eukaryogenesis is the chemistry of membrane lipids and the enzymology of their biosynthesis, which are unrelated in archaea and bacteria, with eukaryotes using the bacterial type28. Accordingly, any model of eukaryogenesis that includes an archaeal host would require a change in membrane composition. More complex, alternative eukaryogenesis models, underpinned by metabolic symbiosis, postulate two endosymbiotic events whereby an Asgard archaeon was first engulfed by a bacterium, the archaeal membrane being lost in the process, followed by a second endosymbiosis that gave rise to the mitochondria15,29,30. Although less parsimonious than binary scenarios, such models of eukaryogenesis account for the continuity of bacterial membranes while requiring retargeting at least part of the archaeal membrane proteome. These evolutionary scenarios appear compatible with the syntrophic lifestyle of at least some Asgard archaea, found in consortia with bacteria, particularly Myxococcota (formerly Deltaproteobacteria)31,32. A pivotal study by Pittis and Gabaldon33, in which the relative timing of events in eukaryogenesis was inferred by comparing stem length from different ancestors in phylogenetic trees of conserved eukaryotic genes, suggested late mitochondrial acquisition, which was apparently preceded by the acquisition of many genes from different bacteria, possibly through one or several earlier endosymbioses33,34,35.
We took advantage of the rapidly growing collection of archaeal, bacterial and eukaryotic genome sequences to assess the origins of core eukaryotic genes within a rigorous statistical framework based on evolutionary hypothesis testing using constrained phylogenetic trees. The results reveal a consistent, principal link between Asgard archaea and the origin of most functional classes of eukaryotic genes, demonstrating a dominant Asgard contribution to eukaryogenesis. These findings are compatible with a scenario of eukaryogenesis where many signature, complex features of eukaryotic cells evolved in the Asgard ancestor of eukaryotes.
Origins of eukaryotic proteins
To represent prokaryotes, a database of 75 million prokaryotic protein sequences was curated from 47,545 complete prokaryotic genomes obtained from the National Center for Biotechnology Information (NCBI) GenBank in November 2023 (prok2311) and supplemented with proteins extracted from 63 Asgard genome assemblies4,5. The initial eukaryotic database consisted of 30 million sequences from 993 species present in EukProt v.3 (ref. 36), cleaned using mmseqs2 (ref. 37) to remove prokaryotic contaminants (Fig. 1a). To accurately infer the origins of genes in the LECA, it is essential to exclude genes present only within narrow subsets of species. These possibly result from post-LECA horizontal gene transfer (HGT) between eukaryotes and prokaryotes, a principal phenomenon given the pervasive cohabitation of eukaryotes with prokaryotes38,39,40,41. To prevent such genes from affecting our analysis, we reconstructed the ‘soft-core’ pangenome for each of our assigned prokaryotic and eukaryotic taxonomic classes (Methods). These pangenomes included only those genes that are present in at least 50% of the species within each class of bacteria and archaea in prok2311 (20.7 million), and at least 20% of the species in eukaryotes (12.7 million), ensuring that our inferences were based only on widespread protein families and would not reflect lineage-specific HGT (Extended Data Fig. 1d).
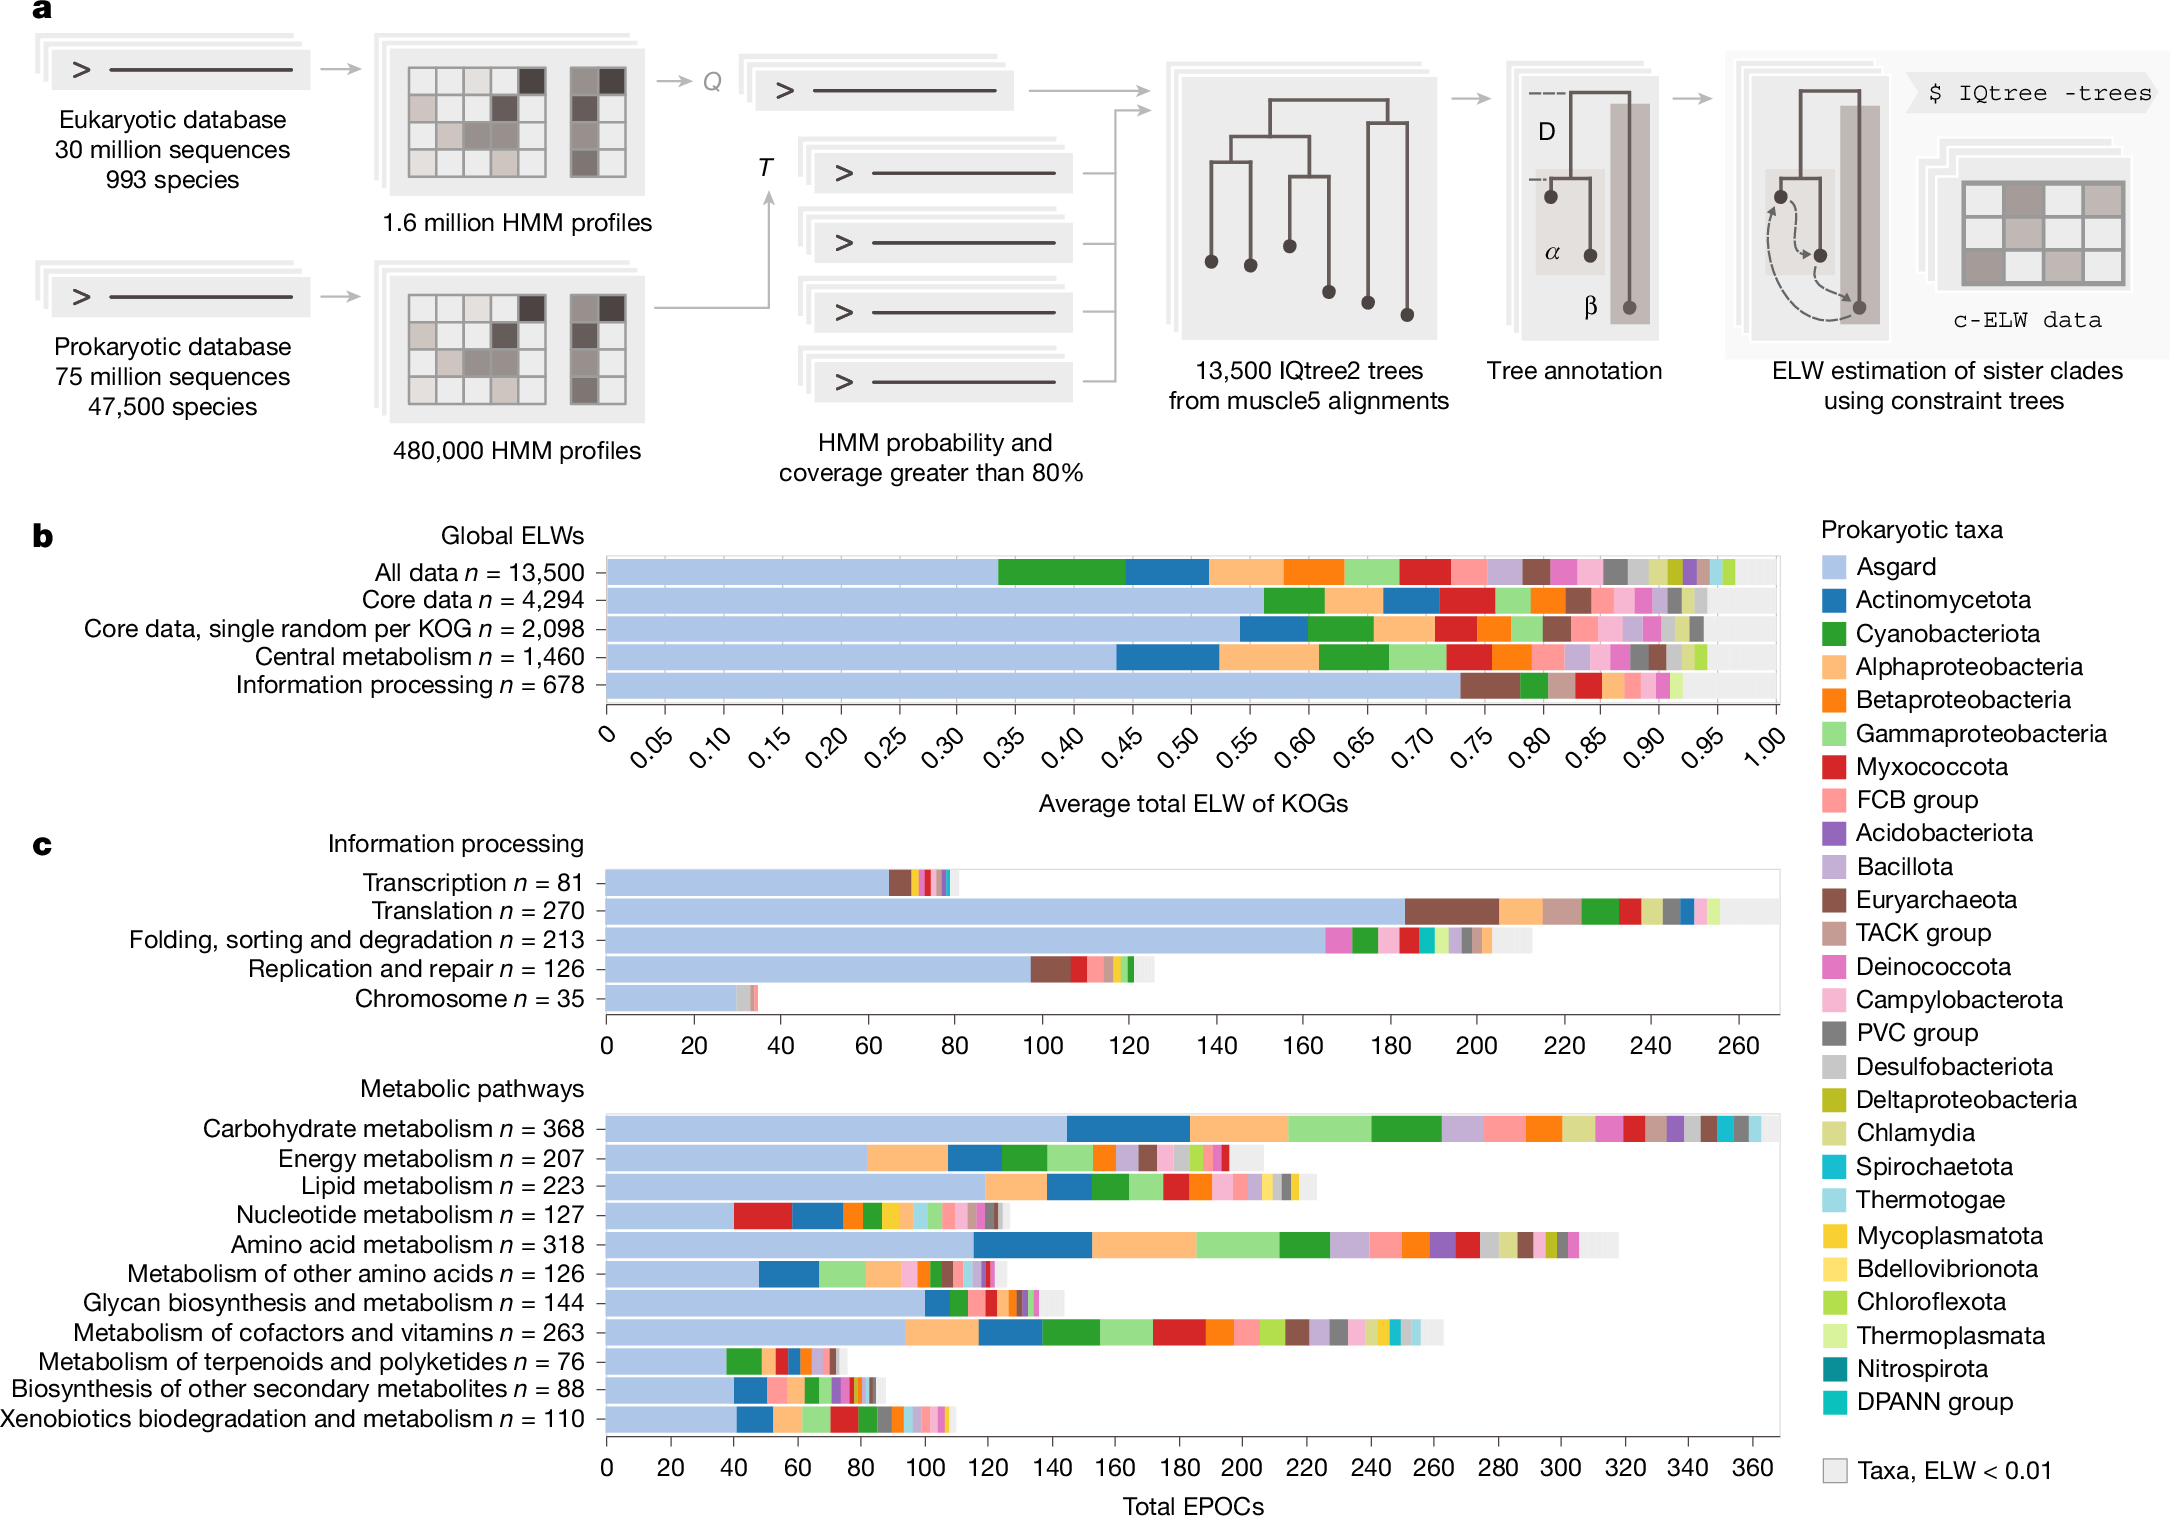
a, Simplified EPOC generation and processing pipeline. From left to right, one eukaryotic and one prokaryotic sequence database transformed into HMMs. The query of eukaryotic against prokaryotic HMMs generated 13,500 annotated EPOCs. The detected prokaryotic clades were assessed for their probability to be the closest eukaryotic sister phyla by permutation testing using IQTree2 (Extended Data Fig. 2). b, Global aELW for all EPOCs within unfiltered, core and non-paralogous subsets and top-level breakdowns for metabolic enzymes and proteins of core information-processing pathways as defined by the KEGG ontology BRITE at the coarsest A level (KO:09100, KO:09120). Grey markers group prokaryotic taxa with an aELW < 0.01. c, Further subdivision of aELW values across more specific functional categories of genes BRITE level B, counting the total number of EPOCs and coloured by relative aELW of taxa per category.
To identify close connections between prokaryotic and eukaryotic protein families, separate hidden Markov model (HMM) databases for prokaryotes and eukaryotes were constructed using a custom, cascaded, sequence-to-profile clustering pipeline, implemented based on mmseqs2 clustering, followed by a multistep data reduction and multiple sequence alignment (MSA) procedure to generate HMM profiles using diversified muscle5 alignments42 and HH-suite43 (Methods). The resulting eukaryotic HMMs were queried against the prokaryotic dataset using HHblits43 to identify sets of homologous protein sequences. Each eukaryotic cluster sequence and all its significant prokaryotic hits constituted an individual set, hereinafter referred to as a eukaryotic–prokaryotic orthologous cluster (EPOC). Each EPOC contains a unique set of eukaryotic proteins. These EPOCs were used for phylogenetic tree construction, annotation and evolutionary hypothesis testing (Fig. 1a). The final EPOCs include 10.9 million prokaryotic and 1.74 million eukaryotic sequences, mapping to 52% and 14% of the respective non-redundant pangenome datasets.
To infer the most likely prokaryotic ancestry of the eukaryotic proteins given the data in each EPOC, rather than relying on tree topology directly, we used a probabilistic approach for evolutionary hypothesis testing using constraint trees (Fig. 1a). Following the construction of an initial master tree, we carried out further constrained tree calculations, exhaustively sampling all arrangements of the prokaryotic sister clades nearest to the eukaryotic clade(s) and obtaining expected likelihood weights (ELW) for the set of possible sister clade models44 (Extended Data Fig. 2). Given that the ELW metric is analogous to model selection confidence, here we take it to be proportional to the probability of a sampled prokaryotic clade being the best estimate of the closest sister clade of a eukaryotic clade. For each EPOC, our analysis dynamically accounts for long branch outliers and is capable of resolving eukaryotic paraphyly, treating each resolved eukaryotic clade within an EPOC individually for downstream analysis (Methods). The resulting data included 13,500 EPOCs annotated using profiles generated from KEGG Orthology Groups (KOGs)45, each with an MSA generated using muscle5 (ref. 42), a maximum likelihood tree inferred using IQtree2 (ref. 46) and associated ELW values for all candidate prokaryotic sister clades. The analysis of prokaryotic ancestry was performed only for those eukaryotic clades that included more than five distinct taxonomic labels, with at least one coming from Amorphea and one from Diaphoretickes—the two expansive eukaryotic clades considered to emit from either the first or the second bifurcation in the evolution of eukaryotes47,48. Thus, although we did not attempt to explicitly reconstruct the LECA gene set, these clades represent genes that, given their broad taxonomic distribution of our data, were likely to have had an ancestor in the LECA.
Considering the global distribution of ELW values across all 13,500 EPOCs covering 3,950 unique KOGs, the single greatest average ELW (aELW), here referred to as ‘association’, was with Asgard archaea (Fig. 1b). Further associations with Cyanobacteria, Actinomycetota, Betaproteobacteria and Alphaproteobacteria, as well as trace associations with many additional bacterial groups, were detected at lower levels. Due to the scope of the analysis, MSA quality and topological diversity of the trees varied across the EPOCs such that some EPOCs showed low ELW values for all clades, indicating that the data in these cases was insufficient to discern their eukaryotic ancestries. Excluding such low-quality EPOCs with a maximum ELW < 0.4 yielded a robust core set of 4,290 EPOCs covering 2,100 KOGs, improving the reliability of the results. This core set covers a wide range of information-processing systems, ubiquitous metabolic pathways and transporters, as well as regulatory and housekeeping proteins. Limiting the analysis to this core subset of well-assigned eukaryotic families with wide taxonomic coverage increased the global Asgard association, which now accounted for 50% of all likelihood weight across more than 4,000 unique data points, covering more than 2,000 unique KOGs (Fig. 1b).
To ensure these results were based on robust sequence clusters, we performed an additional cluster annealing step (Extended Data Fig. 3a; Methods). In brief, starting with initial profiles derived from mmseqs2 clusters we clustered the HMM–HMM search results with a greedy set cover approach. We then further partitioned these superclusters by constructing trees for each cluster and identifying sets of leaves sharing short pairwise distances, indicating the existence of separate clades. These annealed clades were then used for EPOC construction. Furthermore, we reconstructed our full dataset using the Genome Taxonomy Database (GTDB) taxonomy to verify that the detected eukaryote–prokaryote associations were not affected substantially by our use of the NCBI taxonomy49. We note that, although relative contributions from specific taxa varied because of remapping of taxonomic labels (for example, merging of Betaproteobacteria into Gammaproteobacteria), or the stricter annealed EPOC definition limiting the scope of the data, our key observation of a dominant Asgard association for eukaryotes held independent of clustering, taxonomy and eukaryotic scope (Extended Data Figs. 1e, 3b and 10a). As the strong Asgard association was clear in both representations of our data, all subsequent analysis was based on the core EPOC set described above. Finally, although our results suggest the presence of diverse paralogs of apparent Asgard origin in the LECA5,26,