Bidirectional CRISPR screens decode a GLIS3-dependent fibrotic cell circuit
TL;DR
This study identifies a critical immune-stromal cell circuit in inflammatory bowel disease (IBD), where proinflammatory macrophages activate inflammation-associated fibroblasts (IAFs) that produce profibrotic IL-11. Using CRISPR screens, the transcription factor GLIS3 is revealed as a key regulator of this fibrotic network, with its expression correlating with disease severity and its deletion in mice alleviating colitis pathology.
Key Takeaways
- •Inflammation-associated fibroblasts (IAFs) are activated by proinflammatory macrophages and produce IL-11, driving fibrosis in IBD.
- •CRISPR screens identified GLIS3 as a central transcription factor regulating inflammatory and fibrotic gene networks in IAFs.
- •GLIS3 expression levels in intestinal biopsies can stratify ulcerative colitis patients by disease severity.
- •Fibroblast-specific deletion of Glis3 in mice reduces pathological features of chronic colitis, highlighting its therapeutic potential.
- •IAFs localize to specific cellular niches enriched in active disease regions, integrating microenvironmental signals to promote fibroinflammation.
Tags
Abstract
The stromal cell compartment plays a central part in the maintenance of tissue homeostasis by coordinating with the immune system throughout inception, amplification and resolution of inflammation1. Chronic inflammation can impede the phased regulation of tissue restitution, resulting in the scarring complication of fibrosis. In inflammatory bowel disease, stromal fibroblasts have been implicated in treatment-refractory disease and fibrosis2,3; however, their mechanisms of activation have remained undefined. Through integrative single-cell and spatial profiling of intestinal tissues from patients with inflammatory bowel disease, we uncovered a pathological cell nexus centred on inflammation-associated fibroblasts. These fibroblasts were induced by proinflammatory macrophages (FCN1+IL1B+) and, in turn, produced profibrotic cytokine IL-11. We investigated the inflammation-associated fibroblast activation program at a mechanistic level using genome-wide CRISPR knockout and activation screens and identified the transcription factor GLIS3 as a key regulator of a gene regulatory network governing expression of inflammatory and fibrotic genes. We further demonstrated that the magnitude of the GLIS3 gene expression program in intestinal biopsies could be used to stratify patients with ulcerative colitis by disease severity, and that fibroblast-specific deletion of Glis3 in mice alleviated pathological features of chronic colitis. Taken together, our findings identify a critical immune–stromal cell circuit that functions as a central node in the inflammation–fibrosis cycle.
Eosinophils mitigate intestinal fibrosis while promoting inflammation in a chronic DSS colitis model and co-culture model with fibroblasts
Revisiting fibrosis in inflammatory bowel disease: the gut thickens
Main
Chronic inflammation overstimulates fibrogenesis, culminating in fibrosis, a condition that accounts for 45% of disease-related deaths and has limited treatment options1. Single-cell profiling has identified functionally distinct and location-specific fibroblasts as central drivers of fibrosis4. In addition to pan-tissue PI16+ or COL15A1+ fibroblasts, inflammation-associated signals instigate fibroblast states that impair the resolution of injury-induced inflammation, deposit excessive fibrotic collagen and alter tissue mechanics5,6,7. In several human inflammatory diseases, CXCL10+CCL19+ and SPARC+COL3A1+ fibroblasts expand in immune- or vasculature-associated tissue niches, respectively, in which they promote pathology8. Targeting these processes is challenging owing to our limited understanding of the molecular basis of disease-associated fibroblasts and the fact that existing immunosuppressives block proinflammatory mediators, which are not fibroblast-specific.
We previously reported that inflammation-associated fibroblasts (IAFs) were expanded in inflammatory bowel disease (IBD) and expressed an inflammatory and fibrogenic gene signature associated with resistance to anti-tumour necrosis factor (TNF) therapy2,3. This signature was enriched before treatment resistance, implying that IAFs promote disease progression despite medical intervention9. RNA sequencing (RNA-seq) has also implicated oncostatin M (OSM) signalling and neutrophil recruitment in therapy resistance; however, the IAF-specific determinants and their relation to other resistance markers are not fully understood10,11. Identifying the underlying cellular and molecular wiring of fibroinflammatory processes will be critical to the development of new treatments, as general immunosuppressives do not improve long-term fibrotic outcomes, and biologics can have adverse effects or lose efficacy12. As fibroblasts have emerged as central drivers of tissue remodelling after inflammation, we aimed to decipher the inter- and intracellular wiring of IAFs in a disease marked by fibrosis development.
A single-cell and spatial atlas of IBD
To systematically decipher the shared and distinct cellular and molecular drivers of Crohn’s disease (CD) and ulcerative colitis (UC), the principal clinical subtypes of IBD, we integrated single-cell RNA-seq (scRNA-seq) data from the small and large intestine with publicly available IBD datasets2,9,11,13 to construct a single-cell IBD atlas comprising 29 non-IBD control samples, 29 samples from patients with UC and 57 samples from patients with CD (Fig. 1a and Extended Data Fig. 1a). To contextualize cellular spatial relationships and their associations with distinct histopathological features, we applied Xenium-based single-cell spatial profiling and mapped these cells in the intestinal tissue. We included pathologist-annotated tissue resections from the small or large intestine of four non-IBD control samples (normal cuff of colon adjacent to diverticulitis), three ileal and three colonic samples from patients with CD, and six colonic samples from patients with UC (Supplementary Data 1). These atlases profile more than four million intestinal cells across epithelial, immune, stromal and fibroblast compartments and provide a comprehensive framework for study of the aetiology of IBD (Fig. 1a and Extended Data Fig. 1b).
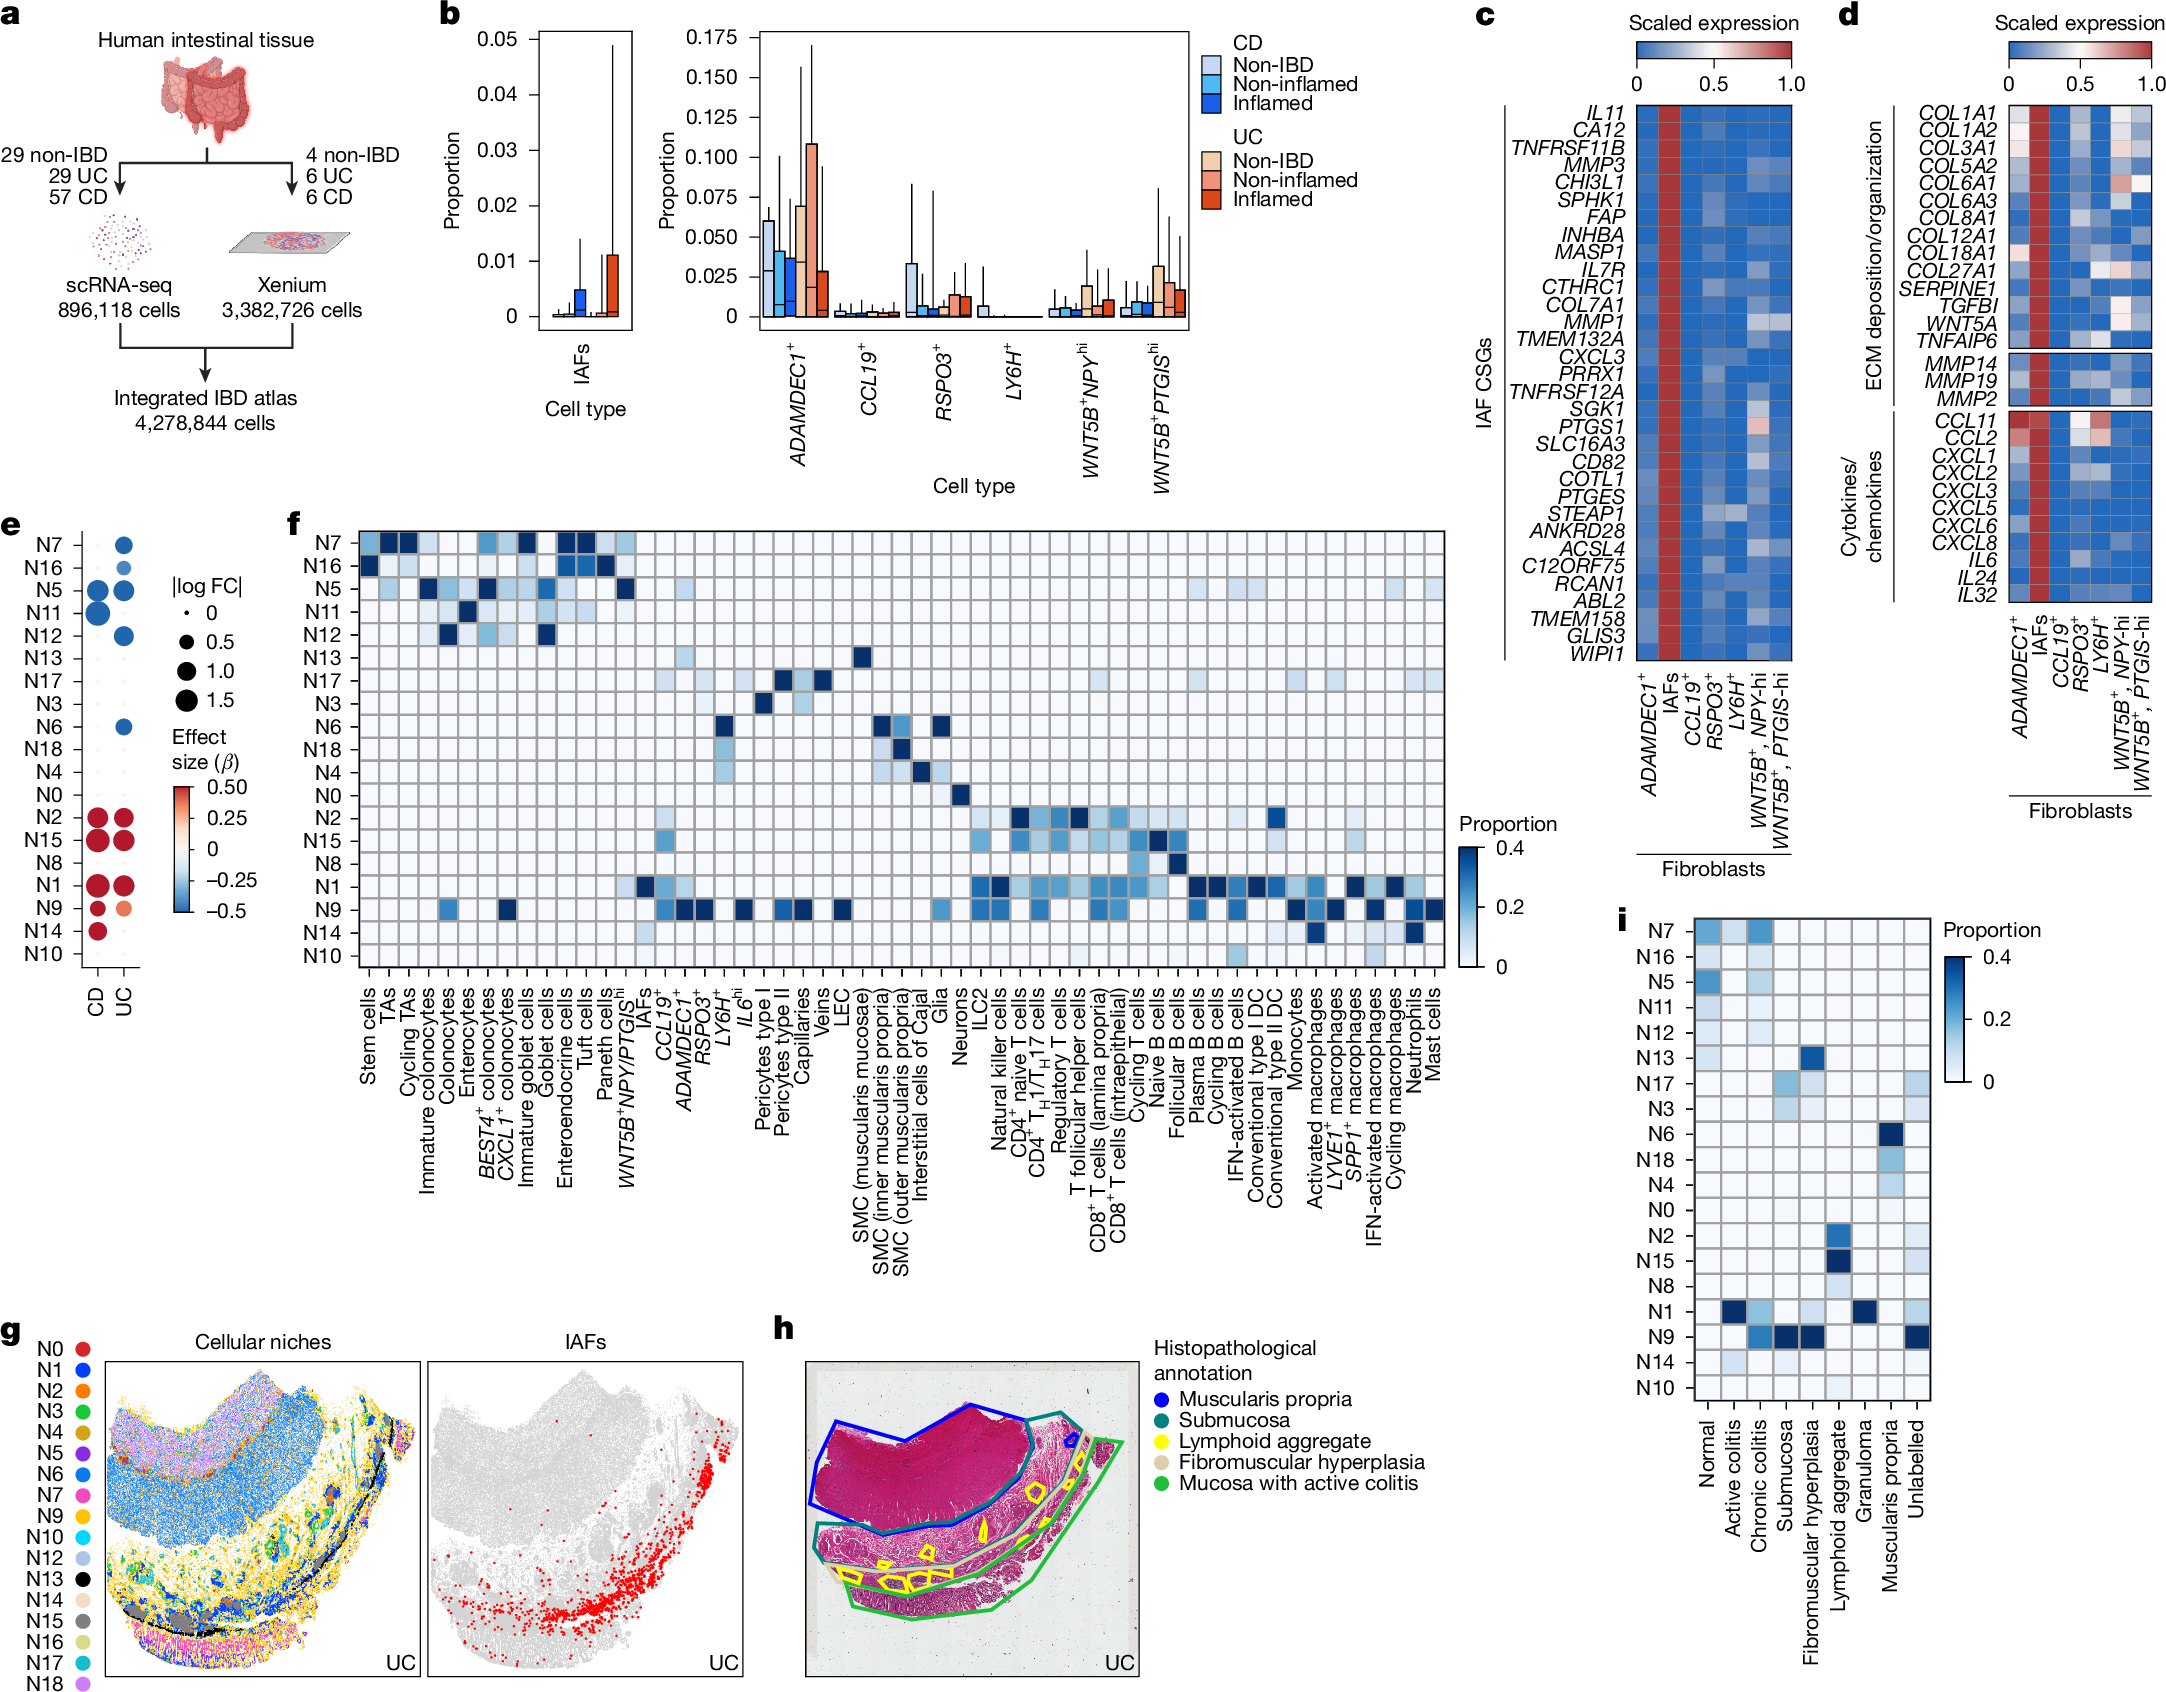
a, Schematic of the integrated IBD atlas workflow using scRNA-seq or Xenium to profile non-IBD individuals and patients with CD or UC. b, Changes in proportions of fibroblasts stratified by disease. Box plots represent quartiles, with medians as the centre and whiskers the 10–90% range. Statistics were analysed using scCODA (Bayesian Dirichlet multinomial model) with smooth muscle cells as reference (false discovery rate (FDR) < 20%) (Methods). Numbers of samples for each category: non-IBD, 29; CD inflamed, 28; CD non-inflamed, 54; UC inflamed, 25; UC non-inflamed, 22. c, Pseudobulk expression heatmap of scaled average IAF-specific genes (Wilcoxon signed-rank test (two-sided), P < 0.05; log fold change > 3; expression in more than 25% of IAFs, fewer than 10% of non-IAFs). d, Pseudobulk scaled expression heatmap of IAF genes involved in ECM deposition and organization or in cytokine and chemokine production. e, Dot plot showing effect size (β) and absolute log2 fold change (FC) for niche enrichment across CD and UC compared with non-IBD samples. Blue indicates enrichment in non-IBD samples and red in CD and UC samples. scCODA with N3 reference niche was used for the analysis. FDR < 20% for niche change in abundance. f, Heatmap of statistically enriched cell type proportion abundance across niches. Chi-squared test with P < 0.05 as the significance threshold. g, Left, visualization of cellular niches projected on to a Xenium-profiled UC tissue section. Right, distribution of IAFs on the same tissue section, showing dense distribution in niche N1. h, Haematoxylin and eosin (H&E) section of UC tissue from g showing annotated anatomical and pathological tissue regions. Images are representative of the sample cohort; n = 16 patients. i, Heatmap depicting the enriched niches within anatomical and pathological tissue domains. CSGs, cell-specific genes; DC, dendritic cell; ILC2, type 2 innate lymphoid cell; LEC, lymphatic endothelial cell; SMC, smooth muscle cell; TA, transit-amplifying cell; TH1 cell, T helper 1 cell. Illustrations in a were created using BioRender. Pokatayev, V. (2025) https://BioRender.com/gnpbg27.
Across IBD samples, we observed significant changes in cell type abundance within defined intestinal compartments (Extended Data Fig. 1c). In the fibroblast compartment, most cells did not show any change in abundance between diseases, with the exception of reparative ADAMDEC1+ fibroblasts14, which decreased in abundance in inflamed CD and UC, and a subset of IL11-expressing IAFs that was expanded in inflamed CD and UC (Fig. 1b). IL-11 is a constituent of the IL-6 family, a group of cytokines that dictate the balance between tissue repair and fibrosis, with IL-11 having emerged as a profibrotic cytokine15. In addition to IL11, IAFs specifically expressed genes associated with fibrosis and impaired tissue functionality, including CD82, PRRX1 and CHI3L1 (refs. 16,17,18) (Fig. 1c). IAFs also upregulated extracellular matrix (ECM) remodelling genes, including COL1A1 and COL6A1, as well as ABL2, which drives cytoskeletal rearrangement19,20 (Fig. 1c,d). Furthermore, IAFs expressed neutrophil-recruiting chemokines (CXCL3, CXCL5, CXCL8), indicating that they may direct immune cell activity during disease9,11 (Fig. 1d). Pathway analysis of the IAF transcriptome demonstrated enrichment of ECM organization alongside inflammatory gene expression (Extended Data Fig. 1d). We previously reported that several IAF genes are associated with a signature or refractory response to anti-TNF treatment2,21 (Extended Data Fig. 1e).
Given the increased prevalence of IAFs in patients with inflamed UC or CD, we proposed that their expansion could reflect concurrent intestinal tissue remodelling. We defined IAF-anchored multicellular niches by implementing cell neighbourhood analysis, systematically quantifying cellular neighbours within a 30-µm radius to capture contact-ligand–receptor and secreted-ligand–receptor interactions22. We identified 19 distinct cellular niches, each comprising 5,298 to 778,470 cells summed across all samples (Extended Data Fig. 2a). The niches corresponded to distinct anatomical layers, and several showed significant changes in abundance between diseases (Extended Data Fig. 2b,c). To account for anatomical variation, we examined niche–cell-type composition separately in colonic and ileal samples. Whereas niche compositions remained broadly consistent between anatomical sites, several epithelial cell niches (N5, N11, N12) showed greater compositional variation (Extended Data Fig. 2d). In CD and UC, mucosal epithelial niches (N7, N16, N5, N11, N12) were depleted; conversely, lymphocyte-enriched (N2 and N15) and myeloid-enriched (N1, N9, N14) niches were significantly expanded (Fig. 1e,f). IAFs were statistically enriched in niches N1 and N14 in both colon and ileum; these comprised stromal and immune cells, with the cell type showing the strongest shared enrichment being FCN1+IL1B+ macrophages (activated macrophages), which resemble CD68+ infiltrated mucosal macrophages in IBD23 (Fig. 1f and Extended Data Fig. 2e). These monocyte-derived macrophages were characterized by canonical activation pathways and specifically expressed proinflammatory cytokines (IL1B, TNF, OSM) and innate immune sensors (TLR2, NLRP3), indicating that N1 and N14 mark inflamed regions influenced by stromal–immune interactions (Extended Data Fig. 2e,f). Histological characterization suggested that N1 and N14 were highly prevalent in tissues in advanced stages of fibrosis and ulceration (Extended Data Fig. 2g–i). We then refined our analyses to map the specific histopathological regions associated with these niches, observing that N1 and N14 were localized to mucosal regions with active or chronic colitis (Fig. 1g–i and Extended Data Fig. 2j). Collectively, these results showed that IAFs localize to niches associated with active disease, potentially integrating signals from the tissue microenvironment to enact fibroinflammatory programs associated with disease.
An IL-11 cell circuit governs fibrosis
To define the spatial roles of IAFs, we generated conditional Il11-knockout mice alongside a reporter line, enabling elucidation of IAF function and distribution in a colitis model with stromal-driven fibrosis. We flanked Il11 exons 2–4 with loxP sites (Il11f/f) and bred this line on to tamoxifen-inducible cre/ERT2, enabling temporal deletion of Il11 (Il11f/f;cre) (Extended Data Fig. 3a,b). We also engineered a novel Il11 reporter mouse by inserting T2A-mNeonGreen (mNG) before the Il11 stop codon (Il11mNG), thereby leveraging selective expression of IL11 in IAFs (Extended Data Fig. 3c).
We modelled chronic intestinal inflammation with features of stromal-driven fibrosis using the chronic dextran sodium sulfate (DSS) regimen of three 7-day DSS cycles, each followed by a recovery phase. Il11f/f and Il11f/f;cre mice were injected with tamoxifen after each DSS cycle to ablate Il11 expression in Il11f/f;cre mice. To assess whether IL-11 promoted fibrotic collagen deposition, we performed Masson’s trichrome staining on DSS- or water-treated colon Swiss rolls and quantified the collagen-positive area as a percentage of the total tissue area. Chronic DSS exposure increased collagen deposition in Il11f/f mice relative to water-treated controls, but this was reduced in DSS-treated Il11f/f;cre mice (Fig. 2a). Correspondingly, tissue hydroxyproline, a proxy for total collagen content, was elevated in DSS-treated Il11f/f mice but reduced in DSS-treated ll11f/f;cre mice (Fig. 2b). Expression of profibrotic collagen genes (Col1a1, Col5a1, Col5a2, Col6a1) followed the same pattern of reduction in DSS-treated ll11f/f;cre compared with Il11f/f mice (Fig. 2c), indicating that IL-11 promotes injury- and inflammation-induced fibrosis. The two genotypes exhibited shared trends with respect to weight loss and histopathological scores for tissue inflammation, indicative of a similar extent of colitis development in the absence of Il11; however, DSS-treated Il11f/f;cre mice exhibited reduced inflammation-driven tissue remodelling (Fig. 2d and Extended Data Fig. 3d,e). These findings extend those of previous studies that reported exacerbated colitis after acute intestinal injury of Il11−/− mice and spontaneous or aggravated colitis in transgenic or recombinant IL-11-treated mice24,25,26, thereby highlighting a key role for endogenous Il11 in promotion of fibrotic remodelling during chronic colitis.
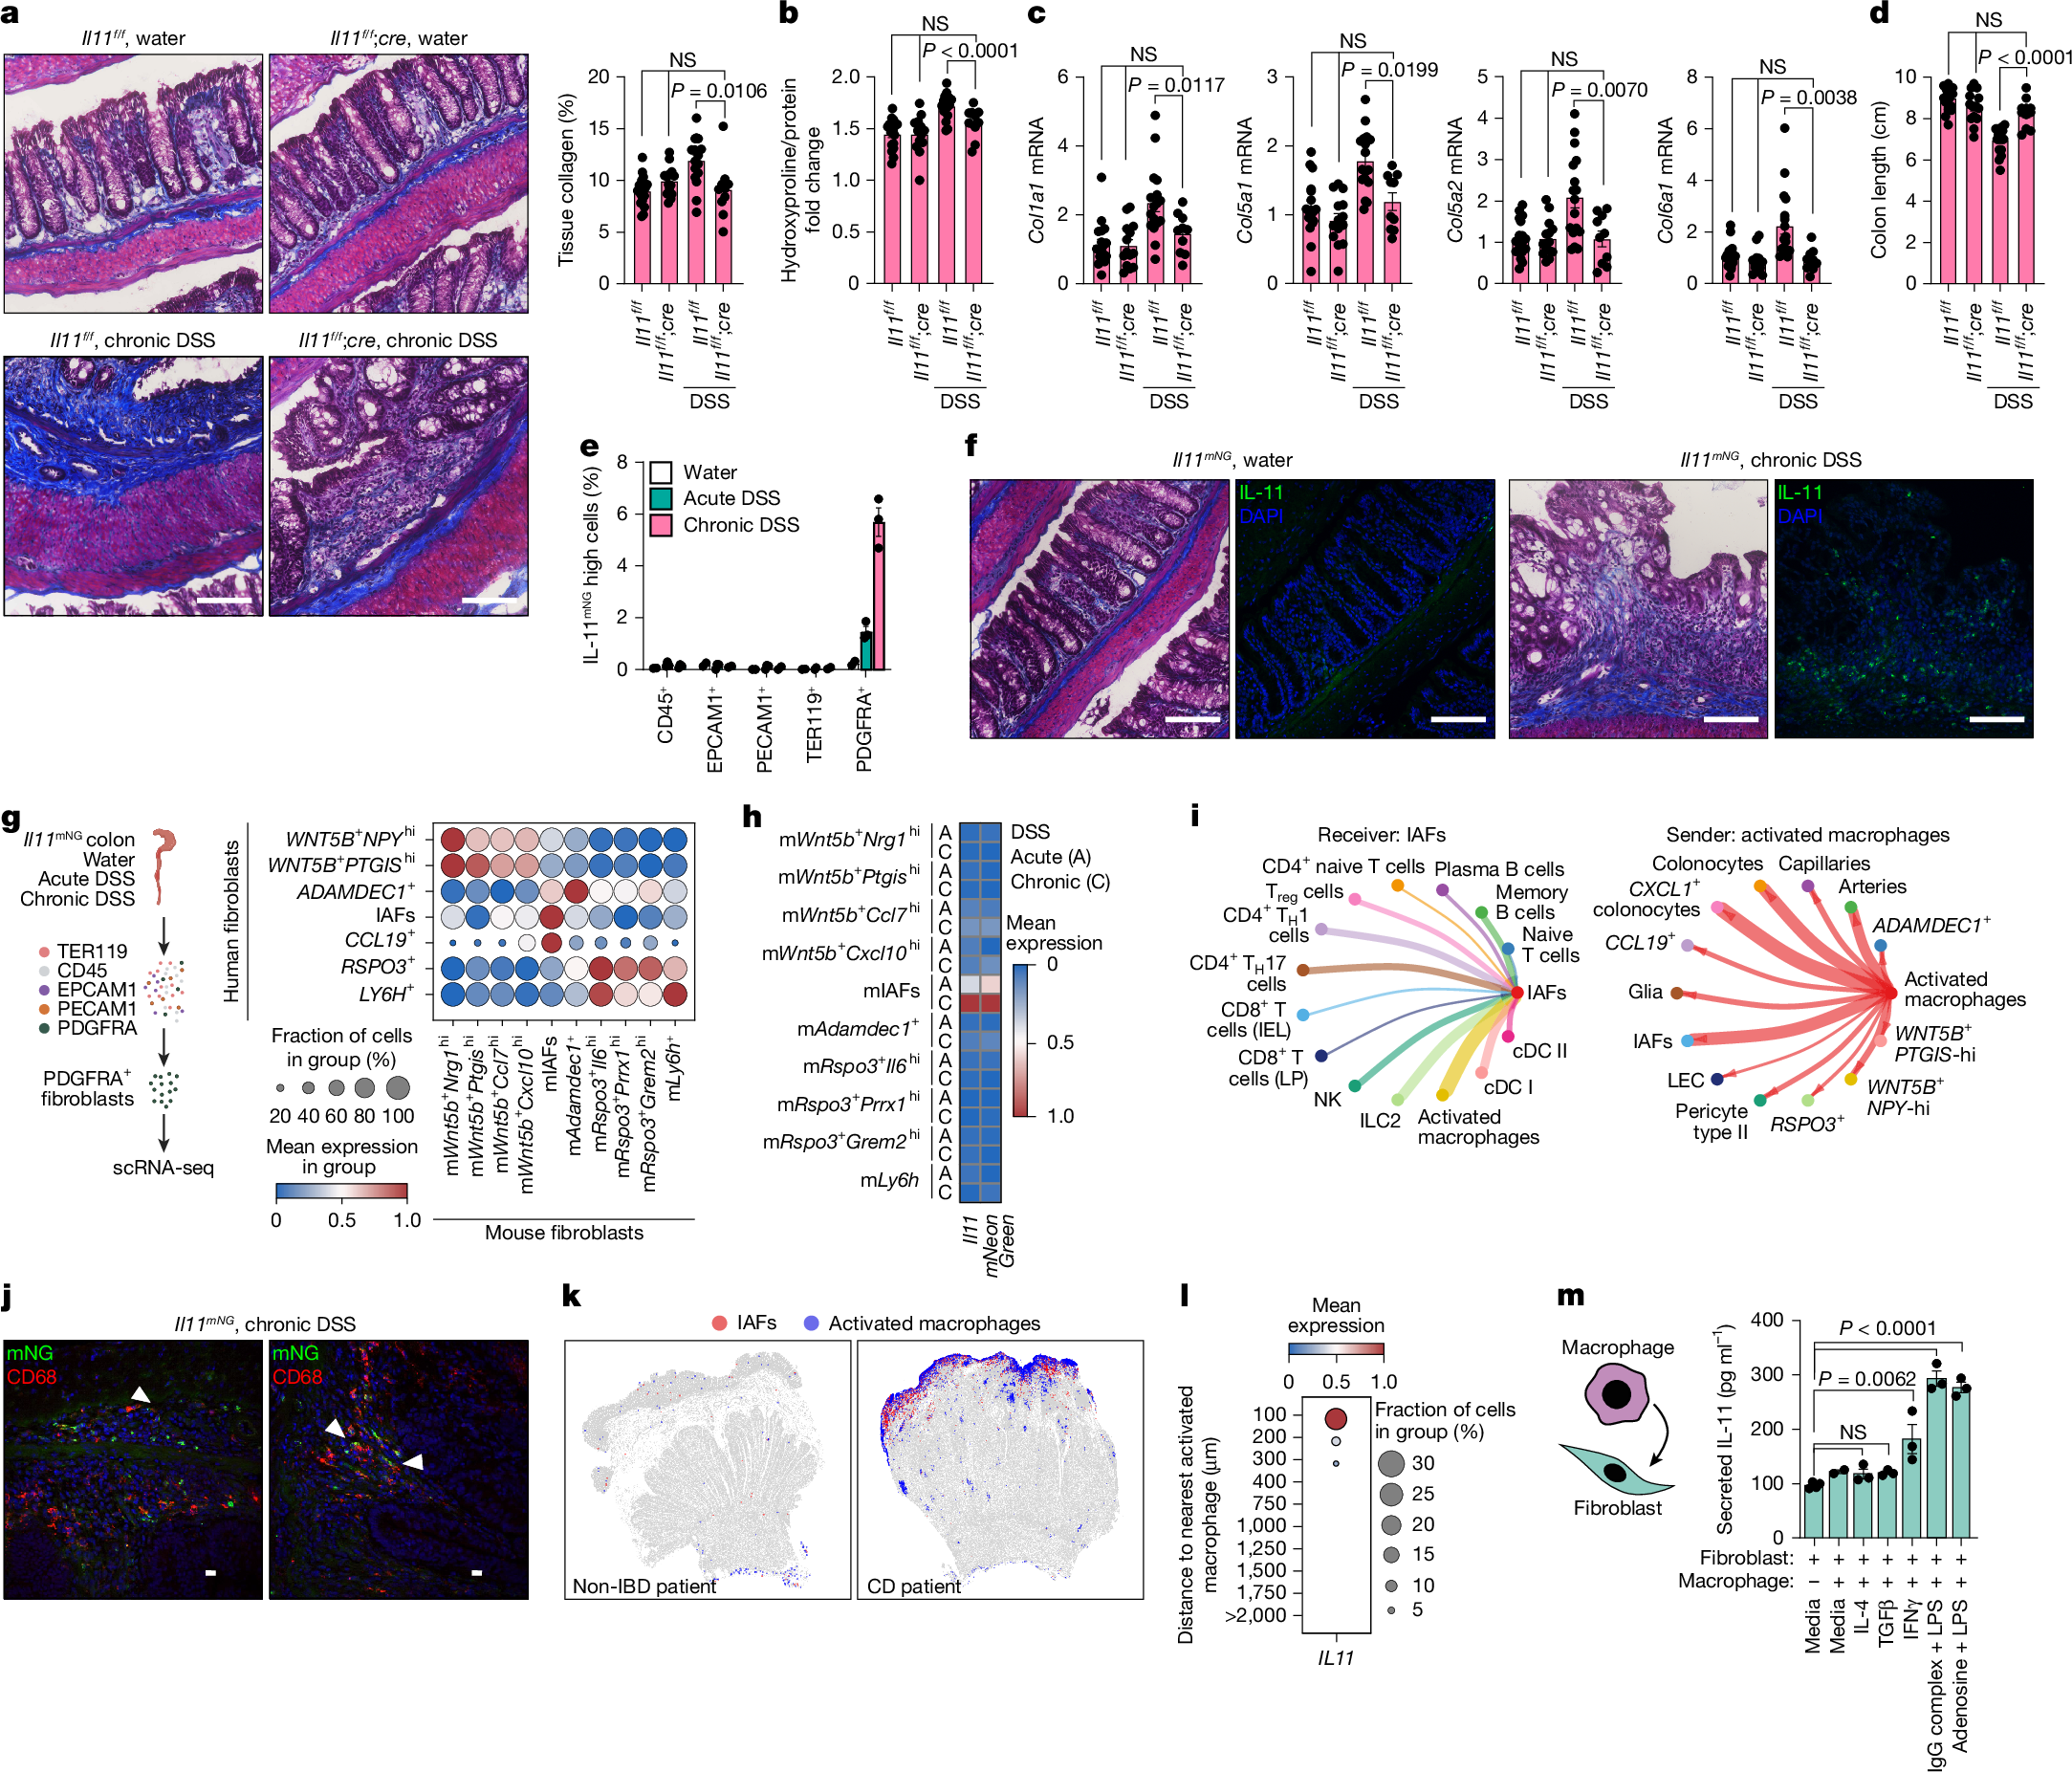
a, Masson’s trichrome-stained Il11f/f and Il11f/f;cre colons (8–18 weeks) treated with water or chronic DSS (left). Total collagen percentage from three pooled experiments (right). Il11f/f-water, n = 10; Il11f/f;cre-water, n = 14; Il11f/f-DSS, n = 17; Il11f/f;cre-DSS, n = 10 mice. b, Colonic hydroxyproline normalized to total protein for tissues from a. c, qPCR quantification of collagens normalized to Eef2 from tissues from a. d, Colon length measurements from a. e, Percentage of IL-11mNG cells across lineages after the indicated treatments. Water-treated, n = 2; DSS-treated, n = 3 mice. f, Masson’s trichrome-stained (left) and immunofluorescence-stained (right) Il11mNG tissues after DSS. Images are representative of three independent experiments. g, Schematic of PDGFRA+ fibroblast isolation from acute and chronic DSS-treated Il11mNG mice (8–14 weeks) (left). Dot plot mapping human fibroblast gene signatures across mouse fibroblasts (right). h, Pseudobulk expression heatmap depicting scaled average expression of Il11 and mNeonGreen from acute and chronic DSS treatment groups. i, Spatial niche-aware probability of intercellular communication. Edge thickness or node size depicts communication strength. Significant signals received by IAFs (left) and sent from activated macrophages (right). j, Immunofluorescence of chronic DSS-treated colons from Il11mNG mice depicting proximal macrophage (CD68, red) and IL-11mNG fibroblast (green) localization. Arrowheads indicate signal adjacency. Images are representative of three independent experiments. k, Spatial projection of IAFs and activated macrophages in non-IBD and CD tissues. l, Dot plot of IAF IL11 expression as a function of proximity to activated macrophages. m, Secreted IL-11 measured from co-cultures of polarized primary human monocyte-derived macrophages, after removal of agonists, with colonic fibroblasts for 24 h. Fibroblasts only, n = 4; fibroblasts + macrophages, n = 2; fibroblasts + polarized macrophages, n = 3 cell lines. Mice were co-housed, and DSS treatment followed the same regimen: acute (2.0%, 7 days), chronic (2.0%, 42 days). Unless otherwise stated, statistics are from two-way analysis of variance (ANOVA) with Tukey’s multiple-comparison test on distinct biological replicates, and error bars indicate s.e.m. NS, not significant. cDC, conventional dendritic cell; IEL, intraepithelial lymphocyte; LP, lamina propria; NK, natural killer; Treg cells, regulatory T cells. Scale bars, 100 μm (a,f), 10 μm (j). Illustrations in g and m created using BioRender. Pokatayev, V. (2025). g, https://BioRender.com/1ildc4h; m, https://BioRender.com/gp42jp3.
We next used Il11mNG mice to map the spatial distribution of Il11 expression within the colon and interrogate its associated histopathological features. Following water or acute (one 7-day cycle) or chronic DSS treatment, we stained dissociated colonic cells for lineage-specific markers. mNG fluorescence was undetectable under water treatment and in non-fibroblast lineages, emerging exclusively in DSS-treated PDGFRA+ fibroblasts, with higher intensities observed after chronic DSS treatment (Fig. 2e). Immunofluorescence detected IL-11mNG fibroblast clusters only after DSS treatment, where they localized to regions of epithelial damage as in acute intestinal injury25,27. Notably, IL-11mNG fibroblasts accumulated in areas of pronounced collagen deposition and inflammation after repeated injury–repair cycles, modelling progressive stromal-driven tissue remodelling (Fig. 2f). These findings indicate an interplay with infiltrating immune cells that may influence IAF development or function, including collagen deposition.
To determine the relevance of Il11mNG mouse fibroblasts to human IAFs, we used scRNA-seq to profile PDGFRA+ fibroblasts recovered after acute and chronic DSS treatment and identified ten distinct fibroblast clusters (Extended Data Fig. 3f,g). Cross-species comparison showed that mouse IAFs (mIAFs) had the strongest enrichment for human IAF and anti-TNF resistance genes21<