Population-scale sequencing resolves determinants of persistent EBV DNA
TL;DR
Population-scale whole genome sequencing data from UK Biobank and All of Us reveals genetic determinants of persistent EBV DNA, linking it to autoimmune, respiratory, and cardiovascular diseases. Key findings include heritability in immune regions and MHC class II variation affecting antigen processing.
Key Takeaways
- •EBV DNA persistence is associated with respiratory, autoimmune, neurological, and cardiovascular diseases in large cohorts.
- •Genetic studies show heritability enrichment in immune regulatory regions and 148 genes, with MHC class II variation as a key modulator.
- •Retrospective analysis of WGS data enables scalable quantification of EBV DNA, offering a framework for studying viral persistence.
Tags
Abstract
Epstein–Barr virus (EBV) is an endemic herpesvirus implicated in autoimmunity, cancer and neurological disorders. Although primary infection is often subclinical, persistent EBV infection can drive immune dysregulation and long-term complications. Despite the ubiquity of infection, the determinants of EBV persistence following primary exposure remain poorly understood, although human genetic variation partially contributes to this phenotypic spectrum1,2,3. Here we demonstrate that existing whole genome sequencing (WGS) data of human populations can be used to quantify persistent EBV DNA. Using WGS and health record data from the UK Biobank (n = 490,560) and All of Us (n = 245,394), we uncover reproducible associations between blood-derived EBV DNA quantifications and respiratory, autoimmune, neurological and cardiovascular diseases. We evaluate genetic determinants of persistent EBV DNA via genome association studies, revealing heritability enrichment in immune-associated regulatory regions and protein-altering variants in 148 genes. Single-cell and pathway level analyses of these loci implicate variable antigen processing as a primary determinant of EBV DNA persistence. Further, relevant gene programs were enriched in B cells and antigen-presenting cells, consistent with their roles in viral reservoir and clearance. Human leukocyte antigen genotyping and predicted viral epitope presentation affinities implicate major histocompatibility complex class II variation as a key modulator of EBV persistence. Together, our analyses demonstrate how re-analysis of human population-scale WGS data can elucidate the genetic architecture of viral DNA persistence, a framework generalizable to the broader human virome4.
The influence of human genetic variation on Epstein–Barr virus sequence diversity
Epstein–Barr virus and multiple sclerosis
Main
In 1964, Anthony Epstein, Yvonne Barr and Burt Achong observed actively replicating viral particles from Burkitt lymphoma, discovering the virus that now bears their names: the Epstein–Barr virus (EBV)5. EBV was subsequently recognized as the first known human oncogenic virus6, the cause of infectious mononucleosis6, and an agent in developing and exacerbating multiple autoimmune diseases7. Despite these wide-ranging pathogenic roles, EBV infection is nearly ubiquitous, infecting >90% of adults worldwide, with most individuals remaining asymptomatic8. EBV primarily transmits via saliva, infecting oral epithelial cells, spreading to B cells and establishing persistent infections in the human host that can last for a lifetime9. Why clinical outcomes of EBV infection—ranging from asymptomatic infection to severe disease—vary so widely remains poorly understood. The most severe manifestation, EBV-triggered cancers, collectively account for 130,000–200,000 annual deaths worldwide10. By contrast, immunocompetent individuals may harbour latent EBV within peripheral memory B cells, where the virus expresses a minimal gene program4,11. As with other herpesvirus infections, EBV can reactivate sporadically or in response to acute stressors or host immunosuppression, resulting in expanded viral reservoirs and potentially lethal clinical complications11,12. This vast phenotypic spectrum following acute and chronic infection underscores extensive individual variability, which can be partially attributed to host genetic variation1,2,3. However, genetic association studies of common infections with complex phenotypes such as EBV have been underpowered owing to small cohort sizes13, motivating new approaches to study infection, viral persistence and host–phenotype associations.
Beyond its role in human disease, EBV has been instrumental in advancing human population genetics research. EBV can transform primary B lymphocytes from healthy individuals into immortalized lymphoblastoid cell lines (LCLs)14, critical resources that historically enabled long-term storage and large-scale genetic studies15. Consequently, immortalized LCLs were the primary material used in the HapMap16 and 1000 Genomes15 projects to profile genetic variation across the globe. These foundational efforts laid the groundwork for more expansive population-scale cohorts, such as the UK Biobank (UKB)17 and All of Us (AOU)18, which include sequencing and phenotypic data from hundreds of thousands of individuals: a scale that can interrogate the genetic underpinnings of complex phenotypes following infection.
As modern biobanks perform whole genome sequencing (WGS) on peripheral blood rather than on LCLs, we posited that EBV DNA reflecting EBV persistence in circulating cells could be captured and quantified in these libraries. Building on recent work that quantifies viral nucleic acids in petabyte-scale datasets to infer host–virus interactions retrospectively19,20, we sought to develop a scalable computational pipeline to estimate individual-level EBV DNA loads. By leveraging the inclusion of the EBV genome as a contig in the human reference genome, we demonstrate how ordinarily excluded sequencing reads can be reanalysed to create a new molecular feature for genome-wide and phenome-wide association studies at petabase-scale.
Biobank WGS data harbour EBV DNA
To address the high levels of EBV DNA present in the LCL-derived libraries—including those used in foundational efforts such as the 1000 Genomes Project15—the EBV genome (chrEBV, NC_007605) was incorporated into the human reference genome assembly (as of hg38)21. This alternative contig was designated as a sink for viral nucleic acids to improve variant calling and interpretation in the human genome21. We hypothesized that reads mapping to this contig from blood-derived WGS data would reflect persistence of EBV DNA following a primary infection. We thus extracted all sequencing reads from the aligned .cram files that mapped to chrEBV, enabling a quantification of the per-individual, per-base EBV DNA coverage across 490,560 individuals in the UKB (Fig. 1a,b). In addition to regions with low coverage corresponding to poor mappability, we identified two distinct loci with disproportionately high read depths, which corresponded to repetitive sequences (Fig. 1b and Methods). As these regions were covered at levels that were orders of magnitude higher than the median coverage of the viral contig, we reasoned that they would confound EBV DNA quantification. As an orthogonal measure of past infection, we used EBV serostatus ascertained on a subset of 9,687 individuals from the UKB, noting that EBV seropositivity requires sufficient antibody titres for at least two of four EBV antigens. We observed a nominal association between presence of EBV DNA and seropositivity when including these two repetitive regions (Fisher’s exact test odds ratio = 1.2, P = 0.03; Fig. 1c and Methods); however, discarding these two repetitive regions revealed that >40% of the UKB cohort only had aligned reads in these regions, and masking these regions before binarizing individuals resulted in a markedly stronger association (Fisher’s exact test odds ratio = 14.6, P = 1.7 × 10⁻²⁶; Fig. 1c). The next strongest association of detected EBV DNA with serostatus was for human immunodeficiency virus (HIV) 1 (Fisher’s exact test odds ratio = 4.6, P = 0.0023), consistent with reports of EBV DNA detection in blood following immunosuppression due to HIV 22 (Fig. 1d). Taken together, our sequencing-based approach readily scales to hundreds of thousands of individuals: a more than a 100-fold increase in sample size compared with serology-based association studies13.
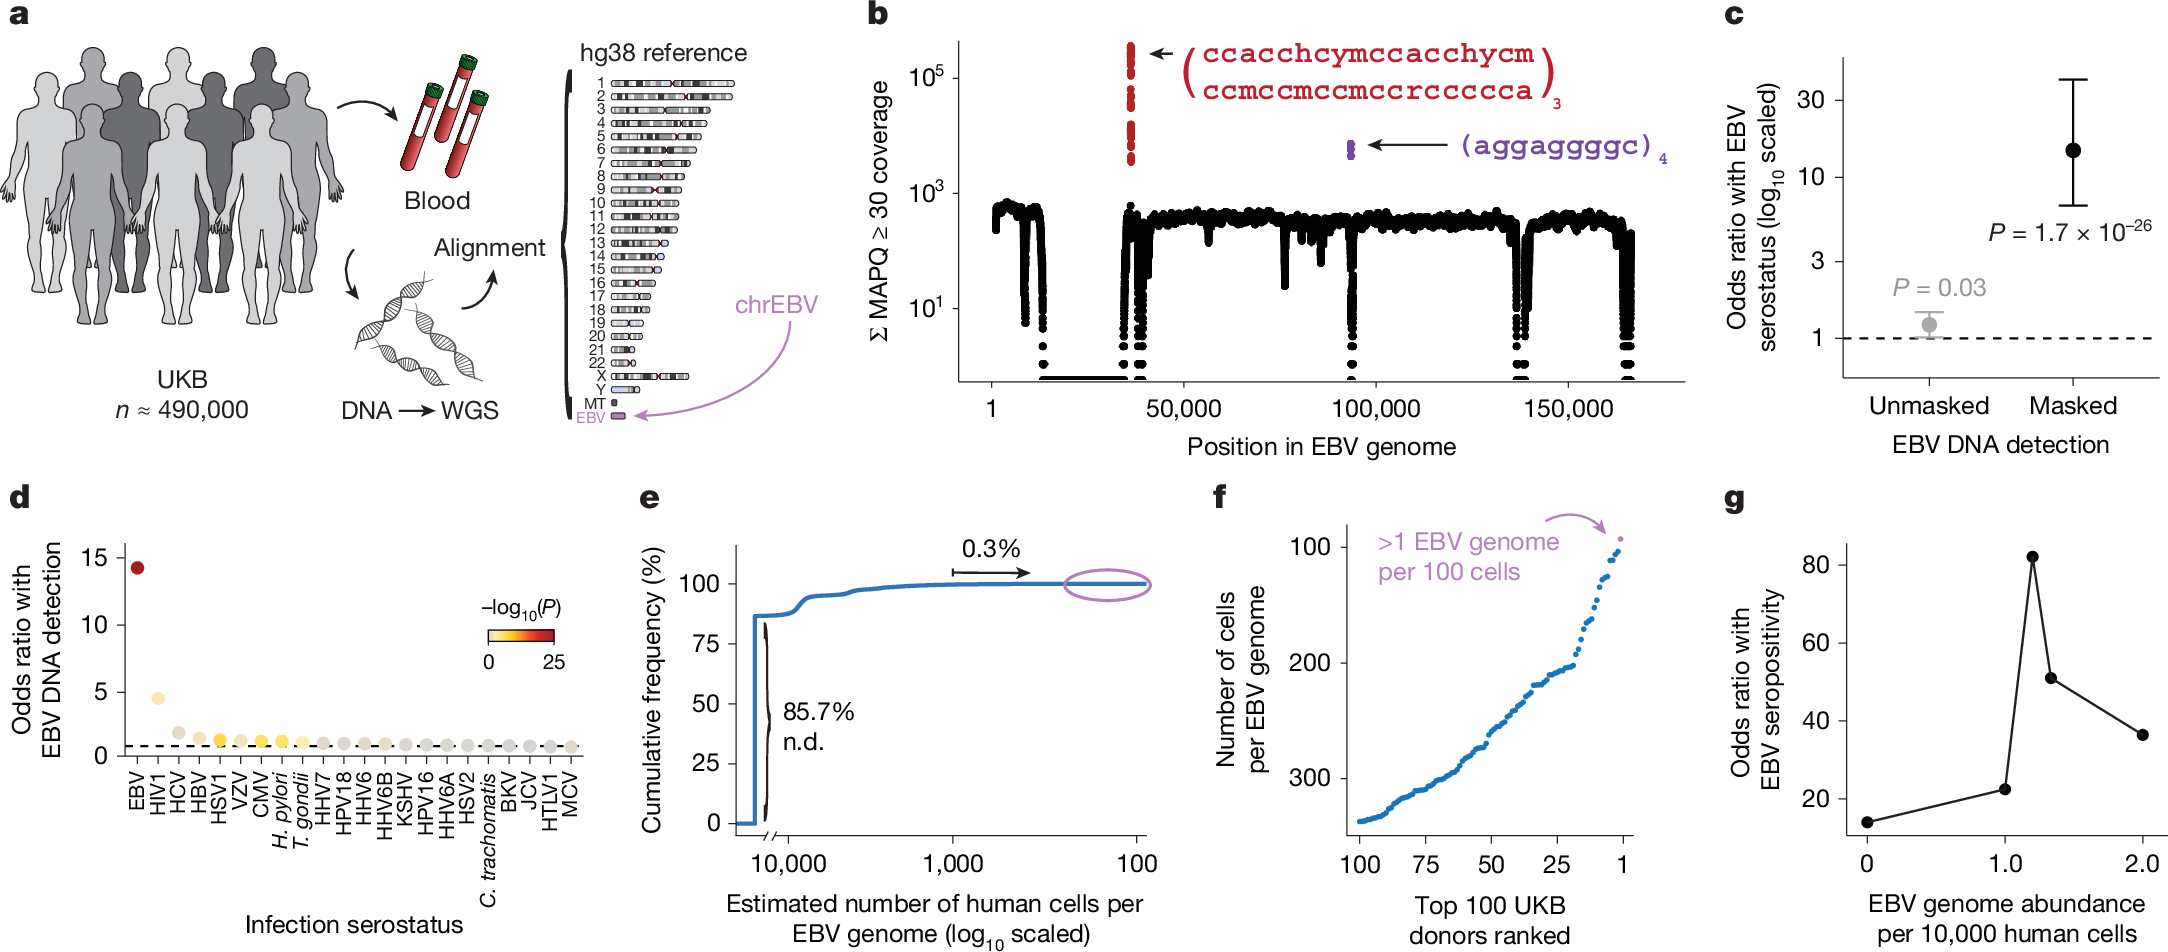
a, Schematic of the approach. WGS libraries from peripheral blood were aligned to the hg38 reference genome, which contains an EBV reference contig (chrEBV). Reads mapping to chrEBV were extracted for downstream analyses. b, Sum of per-base read coverage of high-confidence EBV-mapping reads. Two repetitive regions with inflated coverage are noted in red and purple (following IUPAC convention: h = A/C/T, y = C/T, m = A/C, r = A/G; subscripts indicate the number of repeats). c, Association summary of individual-level serostatus and EBV DNA quantification with variable region masking. Statistical test: two-sided Fisher’s exact test. Error bars represent 95% confidence intervals for the point effect estimate (centre dot). d, Summary of EBV DNA detection with serostatus of 22 infectious agents. Statistical test: two-sided Fisher’s exact test. HHV-6 was partitioned into strains HHV-6A and HHV-6B. e, Empirical cumulative distribution of detected EBV DNA across the entire cohort (85.7% of individuals had no detectable (n.d.) EBV DNA; 0.3% had EBV DNA at a copy number of 1+ EBV genome per 1,000 human cells). f, Top 100 individuals on the basis of EBV DNA copy number, from the circled population in e. g, Association between EBV seropositivity and EBV DNA detection thresholds at variable levels. Statistical test: two-sided Fisher’s exact test. Sample size of full UKB cohort: n = 490,560. The images in panel a were adapted from ref. 19, Springer Nature Ltd.
To further interpret our metric, we estimated the EBV DNA copy number per 1,000 cells by normalizing read counts between viral and host genome sizes. At the extremes of the distribution, 85.7% of individuals had no detectable bias-corrected EBV DNA, whereas 0.3% exhibited EBV DNA copy numbers of at least one viral genome per 1,000 human cells, including one individual with at least one EBV genome per 100 human cells (Fig. 1e,f). This range—which is derived from predominantly healthy individuals—is consistent with past quantitative polymerase chain reaction (qPCR)-based measurements of EBV DNA copy numbers in healthy populations, which reported upper ranges of one copy per 200 cells23 (Methods). Using serostatus as a ground truth and accounting for standard covariates, a cutoff of 1.2 viral genomes per 104 human cells yielded the strongest concordance with seropositivity (odds ratio = 82.2, P = 2.2 × 10⁻¹⁶), noting that all donors with detectable EBV DNA had at least one positive response against the four tested EBV antigens (Fig. 1g, Extended Data Fig. 1b and Methods). We classified 47,452 (9.7%) individuals with EBV DNAemia (defined as detectable EBV DNA levels >1.2 genomes per 104 cells) for subsequent analyses (Extended Data Fig. 1c). As the proportion of individuals with EBV DNAemia (9.7%) is lower than the seropositivity rate (>90%) in the UKB, we interpret our metric as capturing the subset of individuals with the highest levels of circulating EBV DNA at the time of WGS sampling. Indeed, simulated data from a censored log-normal distribution of per-person EBV DNA levels closely approximated the empirical distribution (Extended Data Fig. 1d–g and Methods).
Next, we sought to better understand the profile of individuals with EBV DNAemia in the UKB cohort (Supplementary Table 1). Annotating each individual by birth location, we observed a higher proportion of EBV DNAemia in individuals born in more northern latitudes in the UK, consistent with previous reports of increased EBV infection further from the equator24 (Extended Data Fig. 1h). We also observed a sex-biased (higher in male) and age-associated increase in EBV DNAemia rates, the latter consistent with EBV serology (Extended Data Fig. 1i). EBV DNAemia rates also differed among genetic ancestries and had a modest increase among individuals taking immunosuppressive medications (Extended Data Fig. 1j,k and Supplementary Table 2). We performed parallel analyses in the AOU cohort, spanning 245,394 individuals with blood-derived WGS (Extended Data Fig. 2a and Methods). Results from the independent analyses of AOU replicated key attributes of the UKB data, including a clear repetitive region that was similarly masked, yielding 11.9% of individuals with EBV DNAemia and consistent associations with age, sex, genetic ancestry and prescription of immunosuppressive drugs (Extended Data Fig. 2b–f).
As primary EBV infection occurs earlier in life25, we hypothesized that donors with EBV DNAemia probably reflected a previous infection that persisted until sampling. Conversely, lytic herpesvirus infection would be concomitant with viral transcription, including in peripheral blood11,19. As the UKB and AOU collected DNA but not RNA-seq data, we reprocessed bulk and single-cell RNA-seq from the OneK1K26 and Genotype-Tissue Expression27 consortia to assess for EBV transcription in peripheral blood cells (Supplementary Note 1 and Supplementary Fig. 1a,f). Across these 1,663 donors, we detected minimal evidence of EBV transcripts, suggesting that the vast majority of blood-derived EBV DNA from our cohorts probably reflects latent infection, which is concordant with the lack of EBV lytic reactivation gene expression detected in peripheral B cells of healthy individuals28 (Supplementary Note 1 and Supplementary Fig. 1c,g). Furthermore, analysed saliva-derived WGS samples for another set of 48,899 AOU participants showed a markedly higher rate of EBV DNAemia (50.9%), reflecting a distinct environmental and cellular reservoir for EBV (Supplementary Note 2 and Supplementary Fig. 2a–d). Together, our findings demonstrate that EBV DNA can be retrospectively quantified from existing large-scale WGS datasets with reproducible signals, including sequences collected from different anatomical sites.
Associations with complex traits
Next, we investigated whether our WGS-enabled measure of EBV DNAemia could serve as a biomarker of complex disease. To assess this, we performed a phenome-wide association study (PheWAS) to map systematic outcomes catalogued via International Classification of Diseases, 10th revision (ICD-10) codes with EBV DNAemia as an exposure (Methods). Using individuals from the UKB of predominantly non-Finnish European (NFE) genetic ancestry (n = 426,563) as a discovery cohort, we tested for the association between EBV DNAemia and 13,290 binary phenotypes as well as 1,931 quantitative phenotypes, following our previously described PheWAS workflow29 (Supplementary Table 3 and Methods). Among binary traits, we observed 271 significant (P < 3.3 × 10⁻⁶) ICD-10 codes, including well-established associations with splenic diseases and Hodgkin lymphoma. We also observed significant associations with rheumatoid arthritis11, chronic obstructive pulmonary disease (COPD30) and systemic lupus erythematosus28, each of which has been previously associated with EBV using orthogonal approaches (Fig. 2a). Past case studies have anecdotally reported associations between EBV infection and various conditions in small-scale studies relative to our population-scale cohorts. Our analyses reinforced evidence for these relationships, including chronic ischemic heart disease (odds ratio = 1.19, P = 2.8 × 10⁻¹⁸), acute kidney failure (odds ratio = 1.21, P = 1.4 × 10⁻¹⁶), depressive episodes (odds ratio = 1.19, P = 4.0 × 10⁻²⁶) and stroke (odds ratio = 1.20, P = 6.1 × 10⁻¹³). We emphasize that these associations may also reflect a general state of immunosuppression, and additional work is required to determine which of these associations are causal rather than correlational.
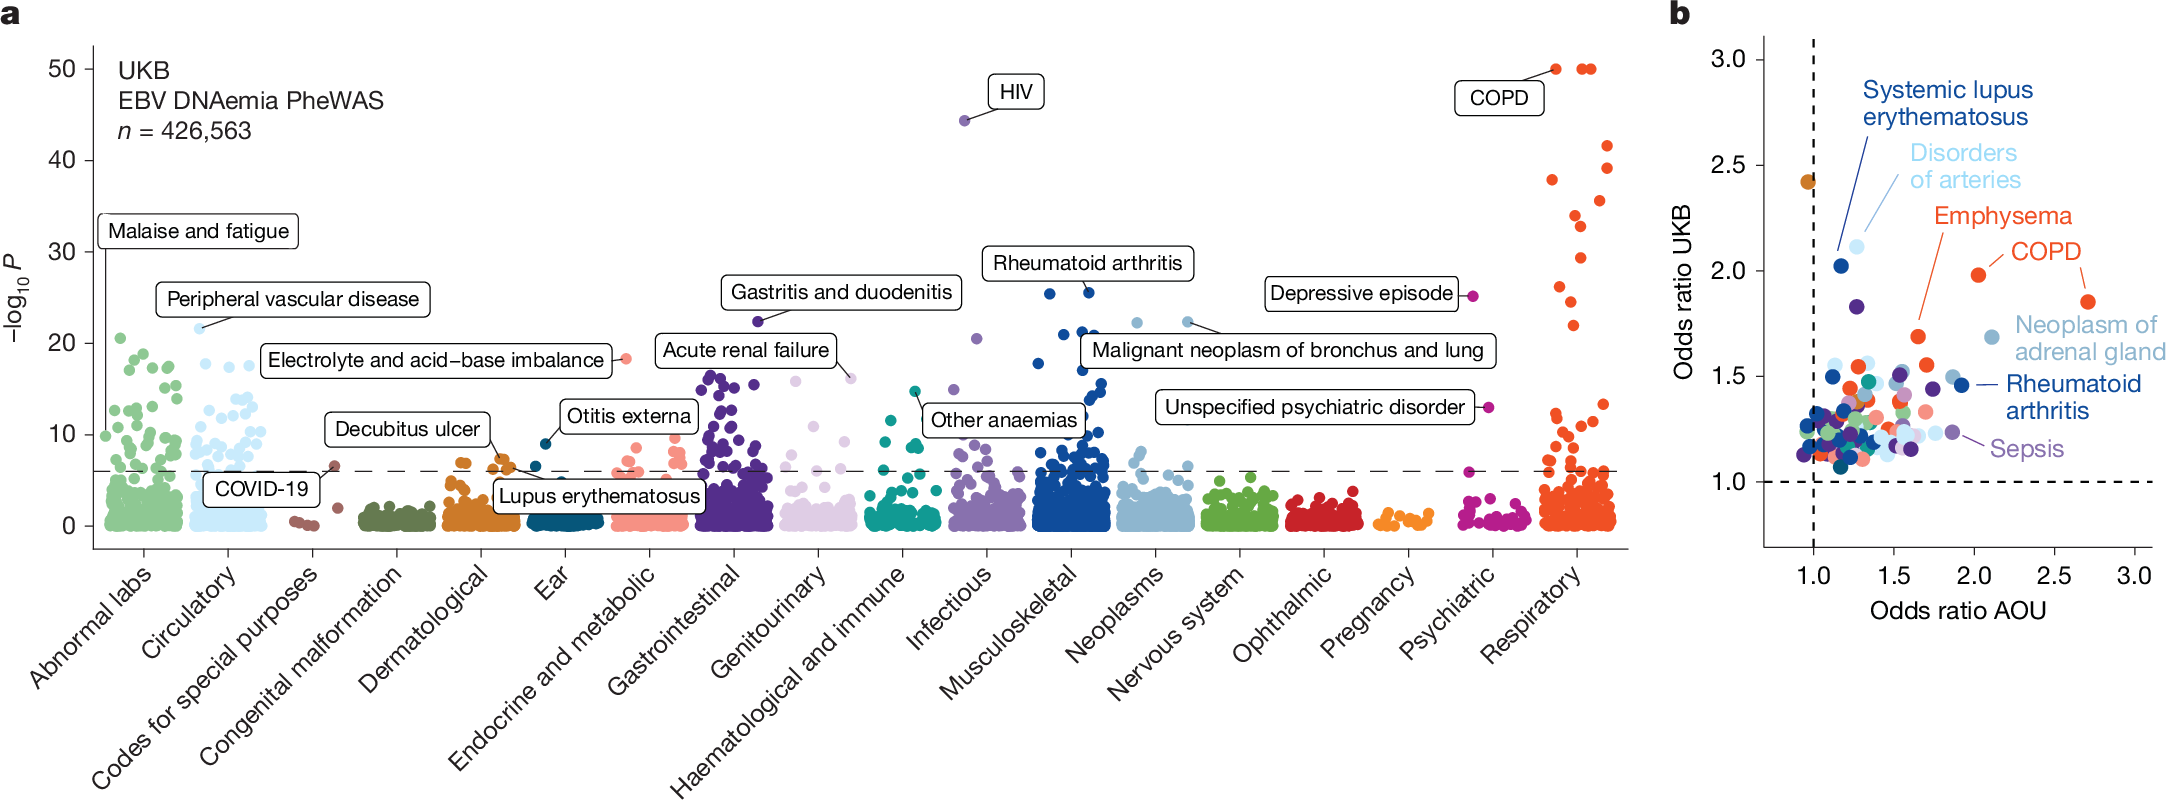
a, Summary of associations between EBV DNAemia and binary phenotypic traits in the UKB, with individuals of broadly NFE ancestry. The horizontal dashed line represents the phenome-wide significant P-value threshold (3.3 × 10⁻⁶). The y axis is capped at –log10(P) = 50, with those exceeding this threshold plotted at 50. Union phenotypes are plotted to reduce redundancy. Selected traits are highlighted based on biological interest. Statistical test: Wald test from logistic regression model (two-sided). b, Effect sizes for matching ICD-10 codes between the UKB and AOU, with individuals of European ancestry in AOU. Dotted lines at odds ratio = 1 represent null associations. Sample size: n = 426,563 UKB NFE individuals; n = 133,578 for AOU European ancestry individuals. The colours are the same as in a.
Statistically significant quantitative associations (n = 156) included leukocyte count, neutrophil percentage, smoking pack years, telomere length and compositions of omega-3 fatty acids, consistent with previous observations of lipogenesis induction following EBV infection