Limited thermal tolerance in tropical insects and its genomic signature
TL;DR
Tropical insects show limited thermal tolerance, with heat tolerance not tracking environmental temperatures proportionally and approaching an asymptote in lowlands. High-elevation species use plasticity to cope with warming, but lowland species have limited capacity, with up to 52% of future Amazonian temperatures potentially causing heat mortality.
Key Takeaways
- •Thermal tolerance in tropical insects does not increase linearly with environmental temperature but saturates in lowlands, indicating an upper limit to heat adaptation.
- •High-elevation insects exhibit plasticity to increase heat tolerance, while lowland species show reduced or negative plasticity, suggesting they are already near their thermal limits.
- •Heat tolerance varies significantly among insect orders and families, correlated with protein thermal stability, implying evolutionary constraints rooted in protein architecture.
- •Future climate scenarios predict that up to 52% of surface temperatures in Amazonian lowlands could cause heat coma in half of insect communities, highlighting vulnerability to warming.
- •Phylogenetic factors explain more variation in thermal tolerance than local adaptation, with protein melting temperatures predictive of critical thermal maxima across insect lineages.
Tags
Abstract
Insects make up the majority of all animal species, with 70% occurring in the tropics1, yet the impacts of warming on tropical insects remain highly uncertain2. This stems from sparse, taxonomically biased data on thermal tolerance of tropical insects and an incomplete understanding of the underlying physiological mechanisms3. Here we compared environmental temperatures with field-measured upper and lower thermal tolerance limits of around 2,300 insect species along Afrotropical and Neotropical elevational gradients and identified genomic signatures of thermal tolerance across the insect tree of life. We show that thermal tolerances do not proportionally track environmental temperatures but approach an asymptote in tropical lowlands. Insects at high elevations utilize plasticity to cope with rising temperatures, whereas lowland species have limited plastic abilities. Heat tolerance showed strong differences among insect orders and families, reflected in the thermal stability of proteins, suggesting that variation in thermal tolerance is founded in the fundamental protein architecture. Up to 52% of future surface temperatures and 38% of air temperatures in the Amazonian lowlands can cause heat mortality in half of the studied community. Our data suggest a limited capacity of insects in the Earth’s most biodiverse regions to buffer future warming.
Main
As global temperatures rise, insect diversity continues to decline at alarming rates in many regions4. More than 70% of all insect species are found in the tropics1, where they are essential for ecosystem functioning5. As small ectotherms, insects are particularly vulnerable to increasing temperatures6, yet our knowledge of their heat response is limited. Despite their immense diversity, data on thermal tolerances of tropical insects are sparse and heavily biased towards a few groups (for example, ants and fruit flies)3. Previous analyses suggest that upper thermal limits are relatively static along climate gradients with little plasticity7,8,9, indicating that insects may have a low capacity to tolerate further warming10.
Currently, tropical lowland places are experiencing increasing average and extreme temperatures due to anthropogenic warming2, underscoring the urgency of understanding the ability of insect communities to respond to increasing temperatures and to reveal upper boundaries of heat tolerance. Besides heat, cold waves also challenge tropical animal communities and are expected to increase in intensity under future climate scenarios11. Species turnover, local adaptation to climate and evolutionary constraints influence thermal tolerance limits in insects12, but their relative importance across insect lineages remain unclear.
Heat tolerance is assumed to be strongly related to the ability of organisms to counter the destabilizing effects of high temperature on proteins13. Although production of heat shock proteins can counteract destabilization from heat to some degree, upper thermal limits of protein stability (measured as protein melting temperatures) are, in ectotherms, ultimate indicators of the threshold at which environmental temperature will have high costs and cause thermal injuries and mortality10. Although protein melting temperatures are commonly studied in structural biology, it is unclear whether they vary among insect orders and families, and how they are related to physiological heat tolerance.
Here, we experimentally quantified thermal tolerance ranges across 2,300 insect species spanning 242 families along Afrotropical (Kenya) and Neotropical (Peru) elevational gradients. We compared the relationship of critical thermal maxima (CTmax) to protein melting temperatures for several thousand proteins from more than 600 species across the insect tree of life. Finally, we predicted the thermal effects of current and future climates for Andean-Amazonian and East African insects.
Heat tolerance and plasticity
We tested whether thermal tolerances of insect communities track temperature trends along elevation gradients (Fig. 1a) and whether there are indications of an upper limit in community responses to increasing temperatures. We measured the thermal tolerance of around 8,000 insects from approximately 2,300 DNA-barcoded species in the field using a common dynamic assay approach14,15 (10 min acclimatization at 28 °C, ramping rate of 0.5 °C min−1). Thermal tolerance decreased from low to high elevation and was higher along the East African than along the Neotropical elevation gradient (Fig. 1b). This suggests stronger adaptations of climatic niches in tropical insects compared with species with a Holarctic distribution, whose upper thermal limits did not vary with elevation in a global study16. Long-term impacts of a less forested vegetation and higher exposure to heat in large parts of East Africa over the past million years have potentially shaped the greater heat tolerance of insect communities.
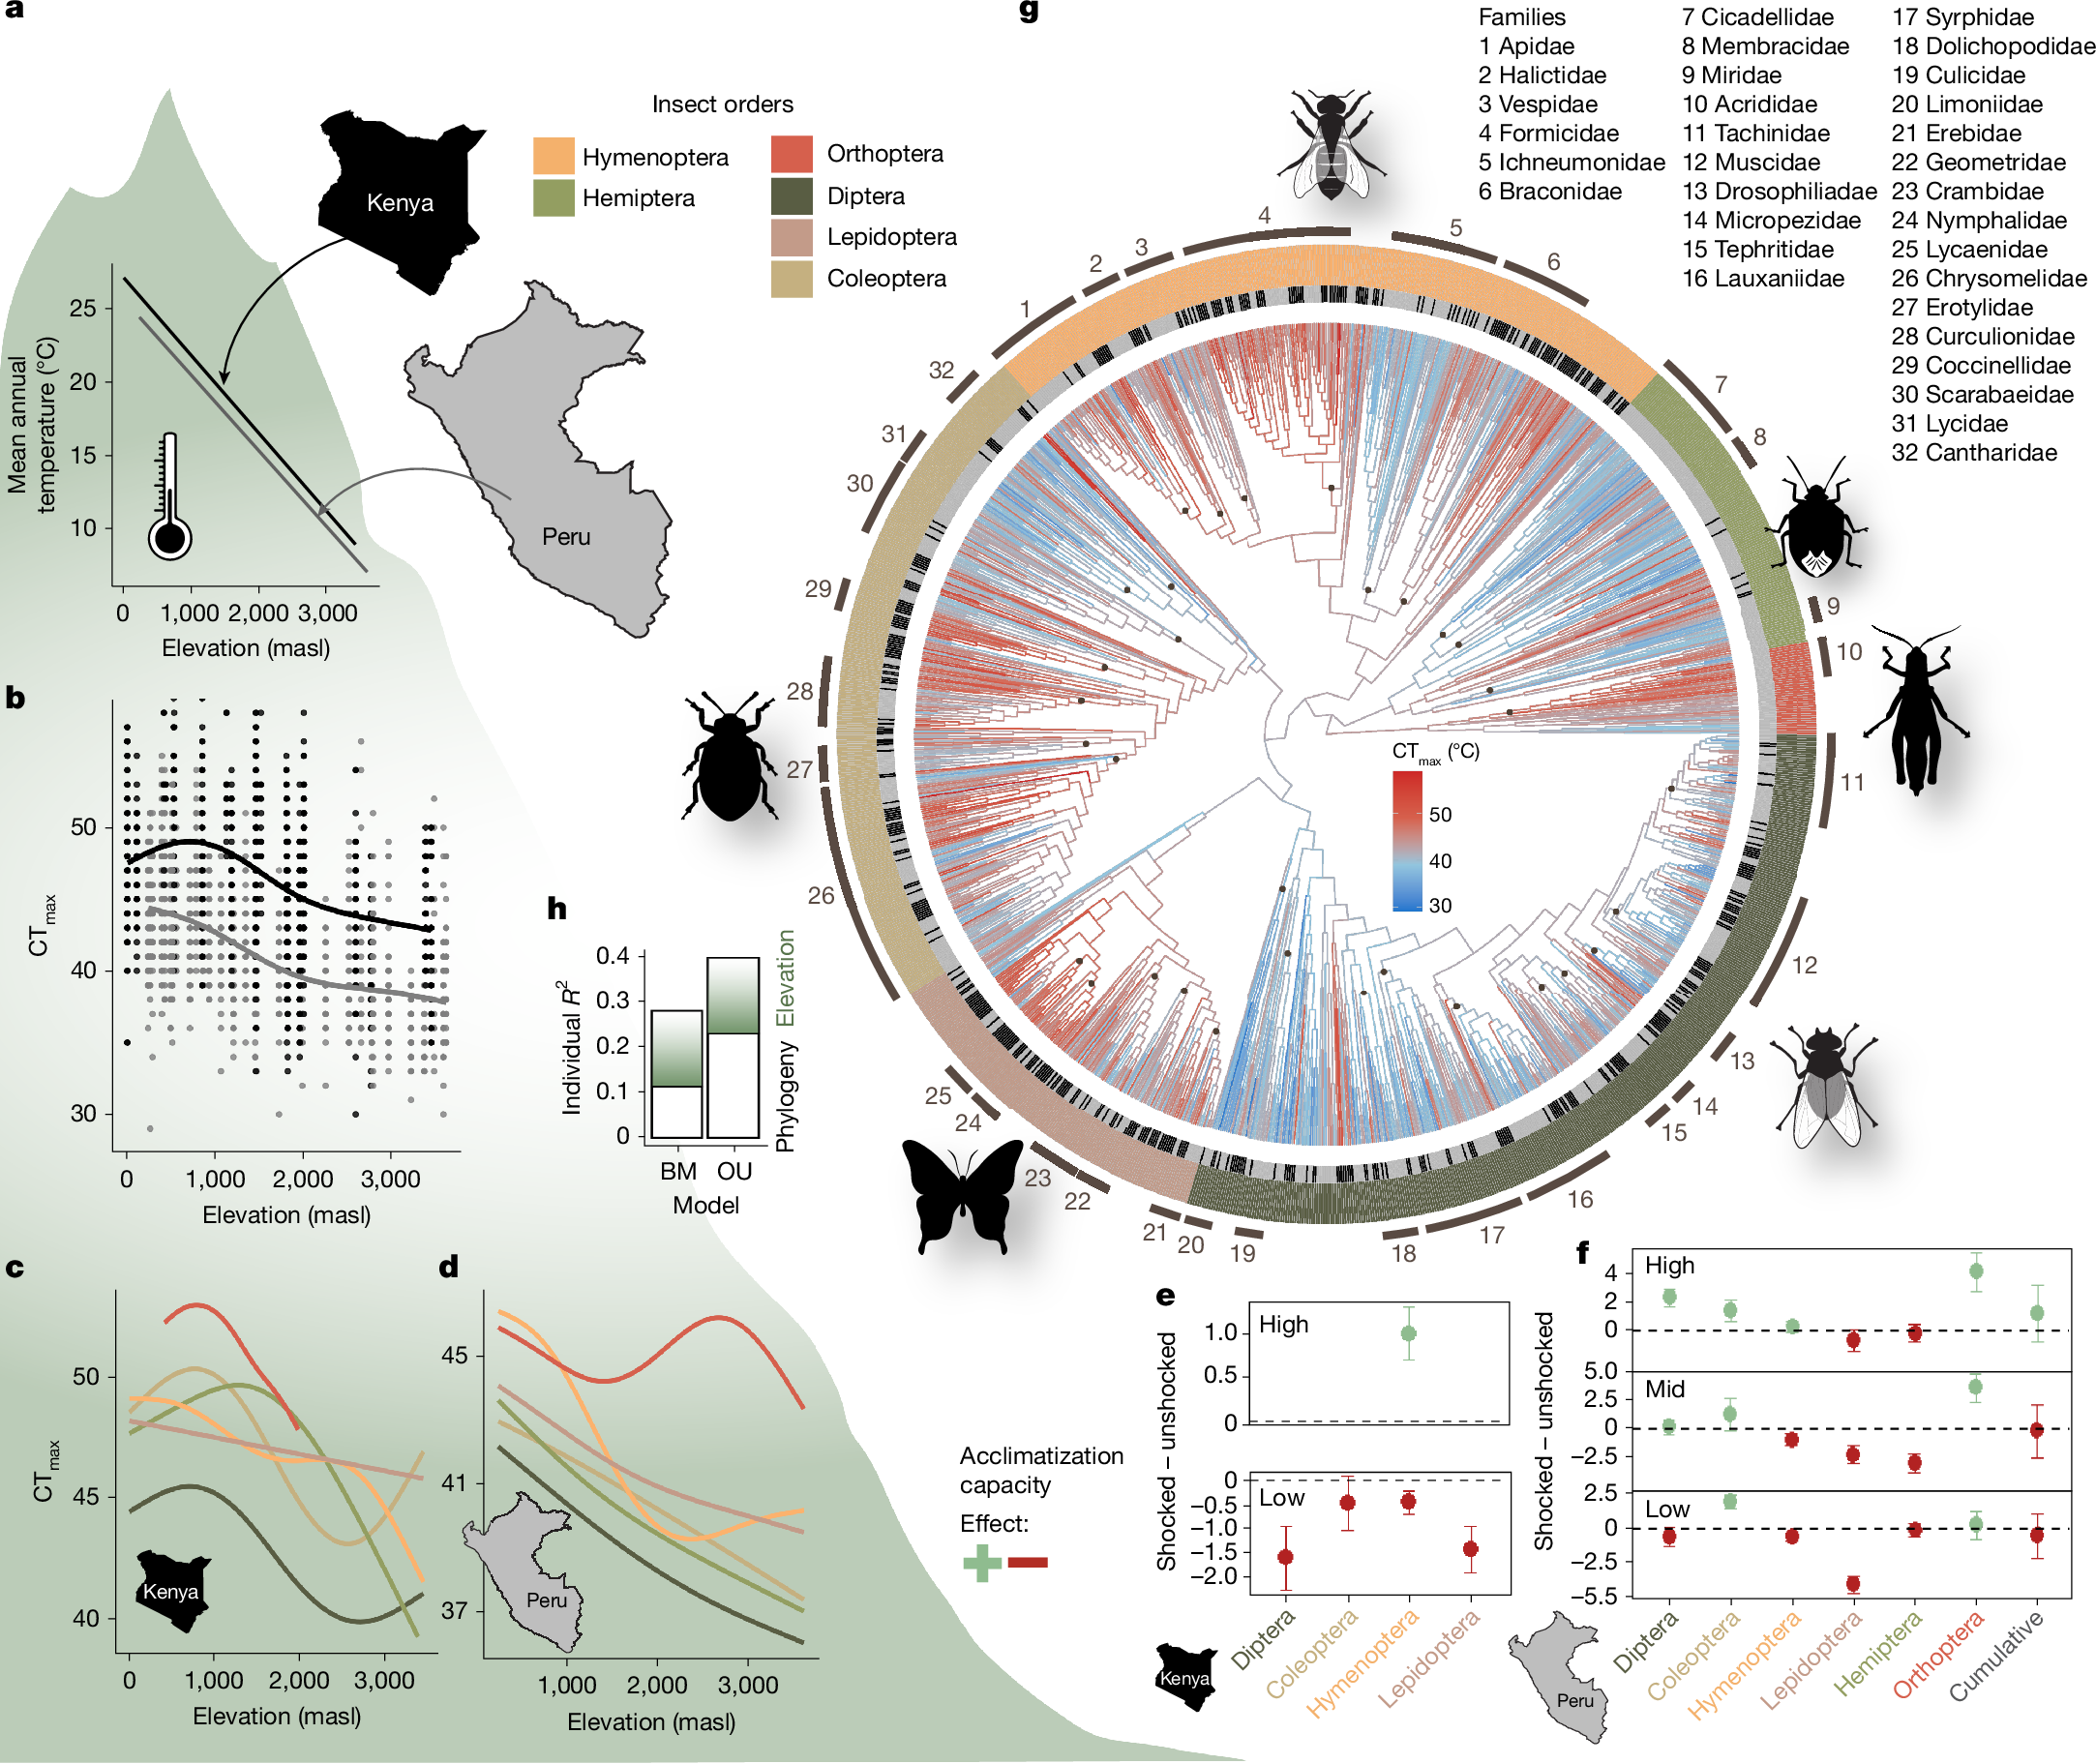
a, Mean annual temperature decreased linearly and was slightly lower at the Neotropical (Peru) gradient compared with the Afrotropical gradient (Kenya). b, Field-measured critical thermal maxima (CTmax) of insects (n = 3,229) decreased along both gradients. c,d, This pattern was also visible along the Afrotropical gradient (c) and the Neotropical gradient (d) for each major insect order. Trend lines were calculated with generalized additive models with the smooth term parameter set to k = 5. e,f, For both the Afrotropical gradient (e) and the Neotropical gradient (f), a potential to tolerate higher temperatures after a heat shock treatment was evident at high elevations (high, >1,200 masl) but the effect decreased with elevation (mid, 600–1,200 masl) and became negative in lowland habitats (low, <600 masl) in most insect orders (n = 777 insects). Data are mean ± s.e.m. g, Phylogenetic supertree constructed by adding trees constructed from DNA sequences (from all sampled insects from which sequences could be derived) onto a family-level backbone tree with ancestral trait value reconstruction of CTmax. h, The variation in CTmax was more strongly constrained by phylogeny than by effects of local temperature conditions (elevation), as indicated by variance partitioning. The Ornstein–Uhlenbeck (OU) model had better support than the Brownian motion (BM) model.
Thermal tolerance did not increase in direct proportion to environmental temperature along the elevational gradients. More precisely, for every 1 °C of increase in mean annual temperature, CTmax changed approximately by 0.41 °C in the Neotropics and by 0.31 °C in the Afrotropics. Trends in CTmax and differences between geographic regions were evident in all major insect orders (Fig. 1c,d). Upper thermal safety margins, defined as the difference between environmental temperatures (here, mean annual temperature and the mean of the warmest month across a year) and thermal tolerance limits, increased significantly from the warm lowlands to the cold highlands (Extended Data Fig. 1). Along the East African elevation gradient, CTmax increased linearly from high elevations to about 500 m above sea level (masl) and approached an asymptote at lower elevations (Fig. 1b). A tendency for a saturation curve was also observed in CTmax along the Neotropical elevation gradient, but the pattern was less clear than along the Afrotropical gradient.
Insects may acclimatize to higher temperatures through stimulated changes in cell signals, metabolism and the production of heat shock proteins that stabilize proteins at stressful temperatures17,18. However, plasticity in upper thermal tolerance may be limited in insects that live in areas that are already exposed to very high environmental temperatures. To study plastic responses to environmental temperature, we conducted a heat shock experiment, exposing insects for 10 min to a sublethal temperature of 40 °C (for insects >2,700 masl: 35 °C) before exposing them gradually to increasing heat. The increase of CTmax in response to a heat shock was on average 1.01 ± 0.31 °C (Afrotropics) and 1.10 ± 2.06 °C (Neotropics) at high elevations, matching results of a global meta-analysis testing plasticity in thermal limits of insects8. However, plasticity in CTmax decreased from high to low elevations at both elevational gradients. In the warm lowlands, a sublethal heat shock did not increase thermal tolerance but led, on average, to reductions in CTmax of insects (effect of heat shock on CTmax, −1.61 ± 1.04 °C in the Neotropics; −0.66 ± 1.59 °C in the Afrotropics; Fig. 1e,f). These results suggest that insect species at higher elevations have a modest potential to increase their heat tolerance by upregulating mechanisms that stabilize metabolic processes against heat. Our finding that a heat shock treatment negatively affects the thermal tolerance of insect species in the warm lowlands suggests that even without the experimental heat shock, protective metabolic mechanisms were already upregulated. Consequently, additional heat exposure from the heat shock treatment could have impaired the ability to withstand more heat19.
We constructed a phylogenetic supertree by mapping DNA sequence-based trees from species to family level, derived from the insects tested for thermal tolerance, onto a family-level backbone tree of insect evolution20 (Fig. 1g). Using CTmax values of the surveyed species, we modelled ancestral trait values and assessed the phylogenetic signal in thermal limits across the insect tree of life. Visual inspection of the plotted CTmax values on the phylogenetic tree and a formal phylogenetic correlogram (Extended Data Fig. 2) revealed a strong phylogenetic signal in CTmax (Pagel’s λ = 0.76, P < 0.001; Blomberg’s K = 0.33, P < 0.001 and 10,000 randomizations), with positive correlations of CTmax among related taxa21. Diptera showed, with few exceptions, generally low CTmax values whereas high thermal tolerance measures characterized aculeate Hymenoptera (bees, ants and others) and Orthoptera. This suggests that thermal tolerance is a conserved trait which may have reciprocally influenced the evolution of microclimatic niches and optimization strategies within different insect orders: Whereas most Diptera are small organisms, which mostly depend on rapid development in temporary shaded and moist habitats22, Orthoptera are often larger, have longer development times, and are often active in open, sun-exposed habitats23.
We tested whether local adaptation and species turnover, reflected in elevational changes in CTmax, or phylogenetic constraints drive CTmax, and whether trait evolution follows a Brownian motion model, assuming random evolutionary drift, or an Ornstein–Uhlenbeck model, with stabilizing selection towards an optimum (Fig. 1h). In both models, elevation and phylogeny explained variation in CTmax significantly, but the Ornstein–Uhlenbeck model was better supported by the data than the Brownian motion model (Extended Data Table 1). The long-term evolutionary optimum from the Ornstein–Uhlenbeck model of trait evolution corresponds to 42.20 °C (θ parameter). Variance partitioning of the preferred Ornstein–Uhlenbeck model showed that the phylogenetic relationship explained slightly more variation in CTmax (partial r2 = 0.23) than elevation (partial r2 = 0.17; Fig. 1). Reconstructions of ancestral traits, a phylogenetic signal in thermal tolerance, the estimation of the long-term evolutionary optimum (θ parameter) and elevational trends in CTmax were robust against sampling completeness, the exclusion of potentially paraphyletic families, problems in family-level assignments of individuals, the method for constructing family trees from DNA sequence information, and potential errors in branch length estimation (Extended Data Fig. 3 and Supplementary Table 1). Our data show, contrary to results of past meta-analyses16, that insect communities show flexibility in responding to decreasing temperatures along elevation gradients. However, our results indicate upper limits in thermal tolerance set by evolutionary constraints, which could have already been reached by tropical lowland insects9.
Cold tolerance and plasticity
As insect responses to heat are costly, increases in CTmax should be paralleled by reduced energetic investments in cold tolerance (critical thermal minima (CTmin)), such that thermal tolerance ranges (CTmax − CTmin) remain constant along temperature gradients10. To investigate thermal tolerance ranges, we additionally measured lower thermal limits along elevations in both geographic regions. The Neotropical data revealed only a slightly lower CTmin of 5.53 ± 3.75 °C compared to the East African data with an average CTmin of 6.04 ± 3.54 °C (Extended Data Fig. 4), so that the overall tolerance range was greater in the Afrotropics (40.25 °C versus 36.36 °C in the Neotropics). In both geographic regions, the thermal tolerance range across the whole insect community did not significantly change with elevation (Neotropics: estimate = 0.00036, F1,23 = 1.785, P = 0.195; Afrotropics: estimate = 0.00003, F1,13 = 0.004, P = 0.951). However, at the order level the thermal tolerance range significantly increased with elevation in the Neotropics in Hymenoptera (estimate = 0.00094, F1,21 = 4.941, P = 0.037), Hemiptera (estimate = 0.00079, F1,20 = 4.511, P = 0.046) and Orthoptera (estimate = 0.00251, F1,14 = 10.39, P = 0.006), potentially indicating relaxed trade-offs between cold and heat tolerance in some lineages (Extended Data Fig. 5). We found no significant changes in thermal tolerance ranges in the Afrotropics. Along the Neotropical gradient, we tested the plastic capacity towards cold (cold hardening), by keeping insects for 10 min at 14 °C before gradually cooling them down. At high elevations, insects tolerated lower temperatures after the cold exposure, indicating the activation of cold hardening mechanisms24, but this was not the case in the lowlands (Extended Data Fig. 4). The lack of a significant hardening potential in the lowlands might be due to the generally warm conditions making protection strategies for tolerating low temperatures unnecessary. However, a reduced cold tolerance could make insect communities in the lowlands sensitive to cold waves, which are predicted to become more frequent in the Amazon in the course of climate change11.
Thermal stability of proteins
Protein instability is assumed to be a major contributor to thermal coma and the eventual death of insects when exposed to heat25. Metabolic and physiological responses to heat are rarely studied but are assumed to be phylogenetically conserved12. Finding a strong phylogenetic signal in CTmax, we assessed whether variation in protein architecture among insect orders can explain variation in CTmax. We predicted the melting temperature (Tm) of a random selection of 1,000 proteins per species from published genomic data of 677 insect species (InsectBase 2.0; https://insect-genome.com) using the deep learning model DeepSTABp (https://rptu.de), which predicts protein thermal stability by estimating Tm from protein sequence information26. We found—across all insect orders—the 25% most heat-sensitive proteins per species to have an average Tm of 42.15 ± 0.73 °C (46.88 ± 0.61 °C for all proteins). The lowest heat-sensitive Tm values were in Diptera with a mean Tm = 41.17 ± 1.29 °C, and the highest Tm values were in Orthoptera with Tm = 43.40 ± 1.95 °C. Protein stability differed significantly across taxonomic orders (F5,88637 = 1,951, P < 0.001) and families (F73,88569 = 226, P < 0.001; Fig. 2) while controlling for species and protein identity in a linear mixed effect model. Predicted Tm across insect orders and families were highly predictive of the observed CTmax values (Fig. 2). This suggests that a part of the phylogenetic variation in organism-level CTmax is due to fundamental differences in protein architecture across insect orders, which may have been optimized to different temperature levels in the early evolution of insects. Differences in Tm among insect orders were consistently found for analyses including all proteins, the 25% proteins with the lowest Tm per species and for analyses restricted to the 43 proteins shared in the randomly selected set of proteins across all orders (Extended Data Fig. 6).
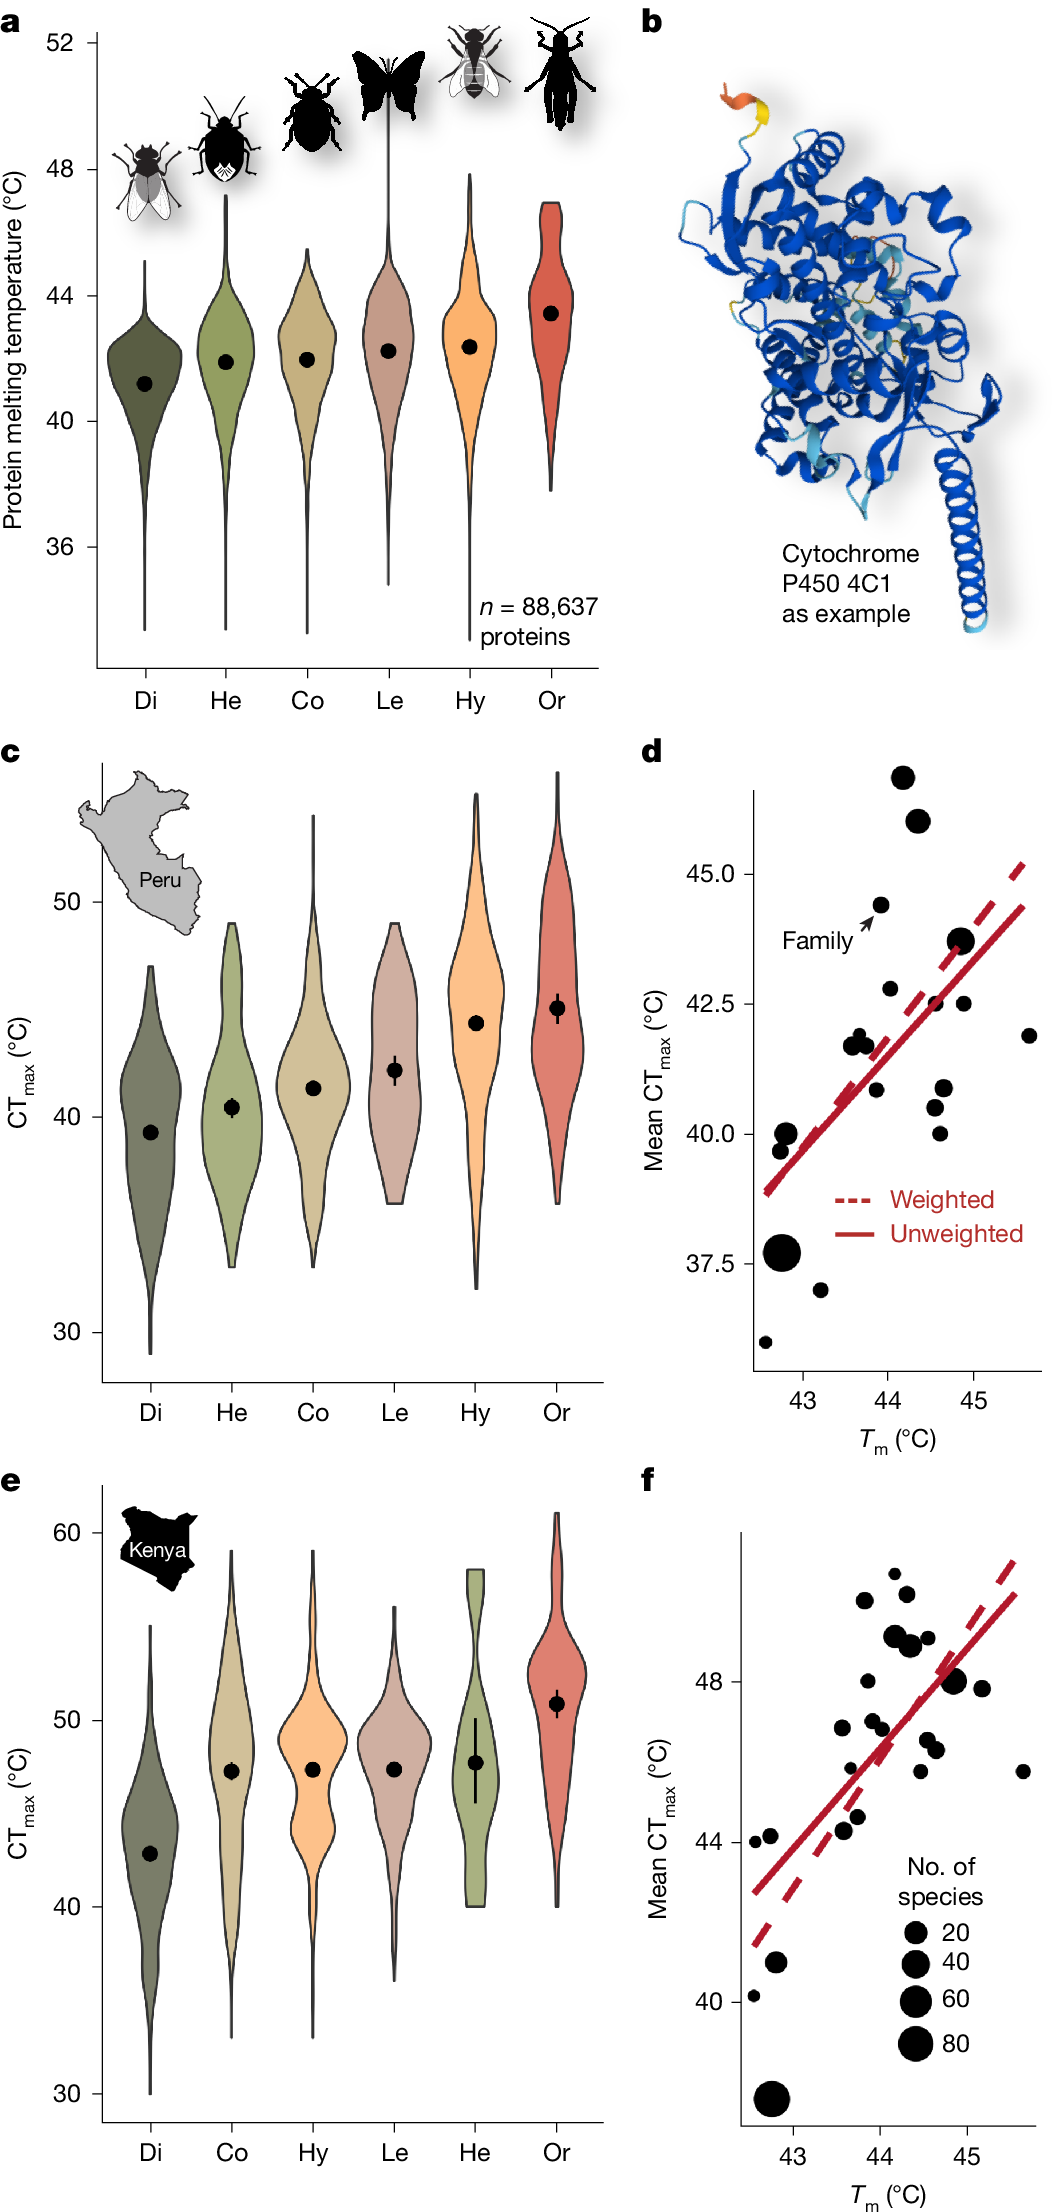
a, Predicted protein melting temperatures (Tm) across insect orders. Data for the 25% of proteins with the lowest Tm per species are shown (a visualization of data of all proteins is shown in Extended Data Fig. 6). b, Melting temperatures depend on the stability of the structure of proteins, such as cytochrome P450 4C1 (example AlphaFold predicted structure). c,e, Experimentally tested critical thermal maxima (CTmax) of the six major insect orders (n = 3,229 individuals) for the Neotropics (c) and Afrotropics (e). Dots and bars represent mean ± 95% CI and violin polygons show data density. d,f, Correlation of mean CTmax and mean Tm across all insect families from the Neotropics (d) and Afrotropics (f) for which both genomic data and data on CTmax were available. The size of the dots is proportional to the number of species with genomic data per family. Trend lines show predictions of simple linear models and linear models weighted by the number of species with genomic data. Di, Diptera; Co, Coleoptera; He, Hemiptera; Le, Lepidoptera; Hy, Hymenoptera; Or, Orthoptera; ordered from lowest to highest mean.
Thermal sensitivity under climate change
Although tropical insects already operate at very high temperatures, future warming of Amazonian or African ecosystems may push them beyond their physiological limit6, as has been shown for other ectothermic taxa (for example, in amphibians27). We used CTmax data to predict potential thermal injuries in insect communities caused by current (Fig. 3a,b) and future (Fig. 3c–h) surface (insects exposed to direct sunlight on surfaces) and air temperatures (insects in shaded above-ground environments). Notably, thermal tolerance limits are dependent on the interplay of temperature and exposure time15. Temperatures several °C below the measured CTmax can already cause thermal injuries, resulting in heat coma if they accumulate over time19,28. Temperatures higher than the CTmax determined by our protocol can lead to heat coma within time periods below 2 min. We calculated the knockdown time until coma (tcoma) for field-measured shaded air and surface temperatures19. Shaded air temperatures were continuously measured with loggers at our study sites (loggers were unavailable for the Afrotropical gradient, therefore the shaded air temperatures were modelled; Methods). Surface temperatures were derived from the Ecosystem Spaceborne Thermal Radiometer Experiment on Space Station (ECOSTRESS) sensor aboard the International Space Station, which provides unique high-resolution temporal and spatial measurements of land surface temperatures29. We calculated site-specific tcoma values: first, for an average CTmax per study site (using the median CTmax of all measured insects per study site; Extended Data Fig. 7); second, for heat-sensitive insects (using the 25% quantile of CTmax of all measured insects per study; Fig. 3); and third, for most heat-sensitive insects (using the 10% quantile of CTmax; Extended Data Fig. 7). Moreover, we calculated tcoma for temperatures projected for three future climate change scenarios (SSP1-2.6, SSP3-7.0 and SSP5-8.5; Methods), adjusted for taking short-term variation in microclimatic temperature into account.
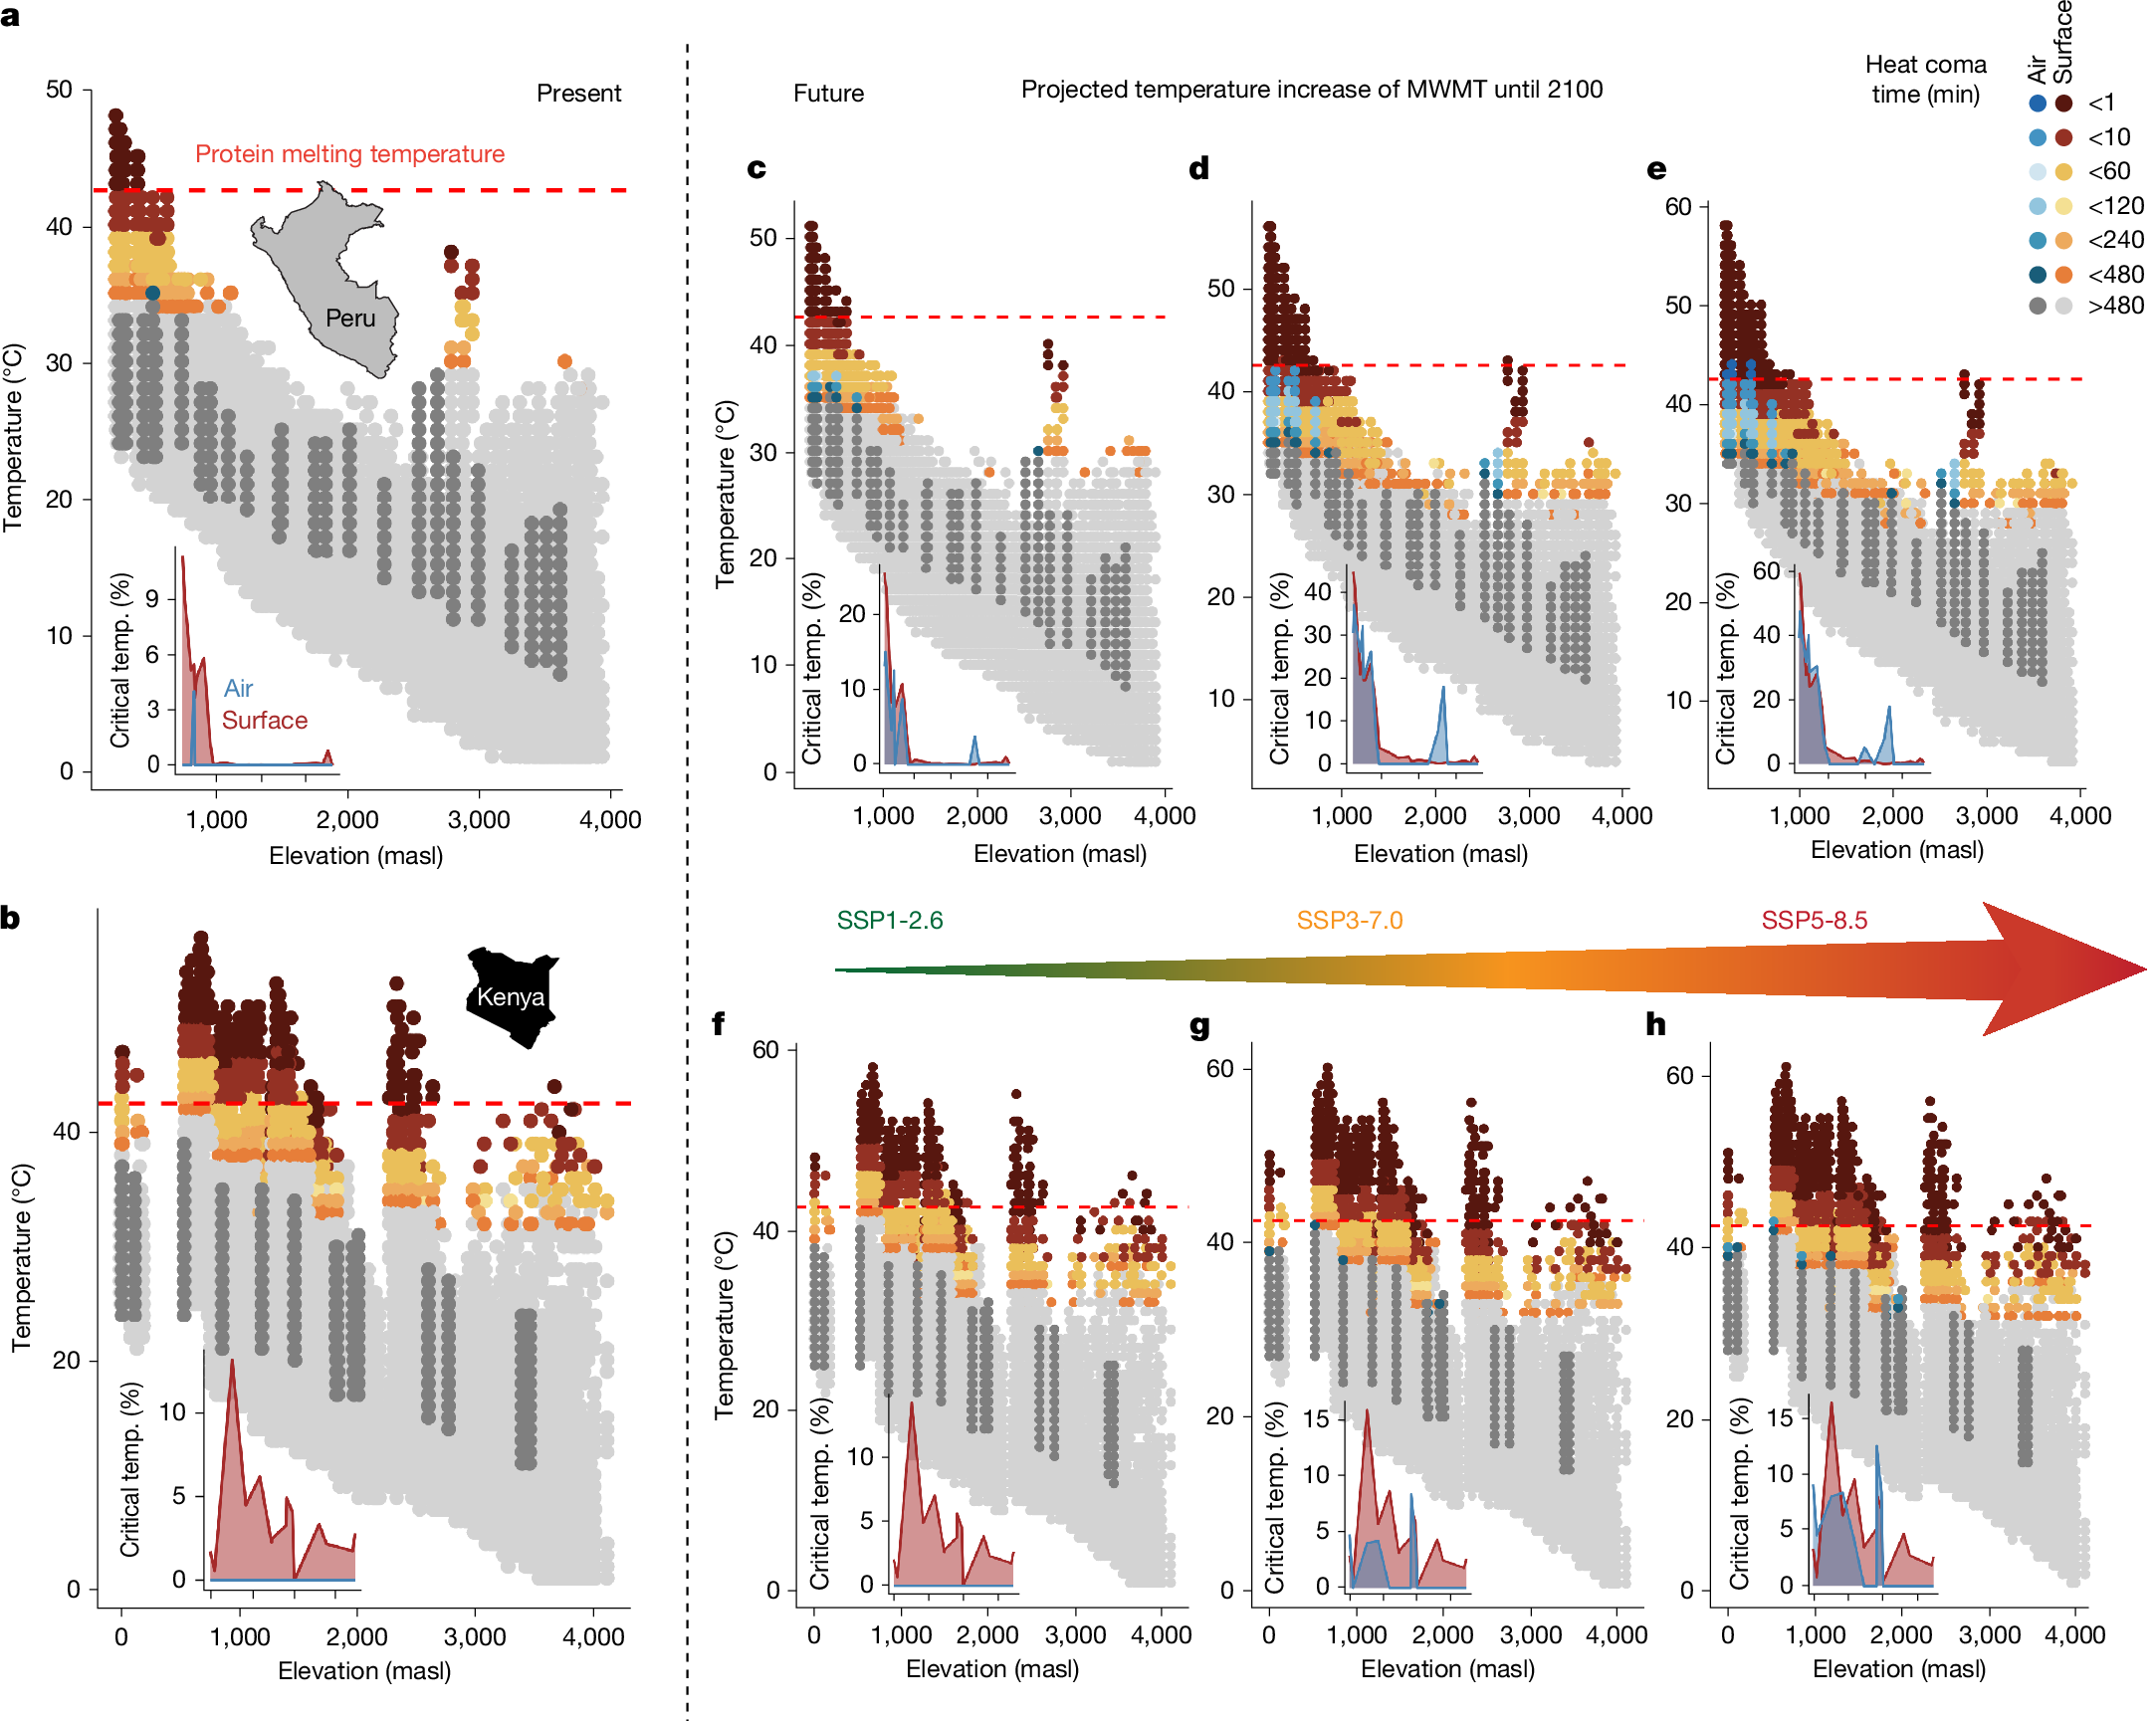
Heat coma time for insect communities along Neotropical (a,c–e) and Afrotropical (b,f–h) elevation gradients, for present day surface and air temperatures (a,b) and surface and air temperatures predicted under three common climate change scenarios (climate model GFDL-ESM4 under SSP1-2.6 (c,f), SSP3-7.0 (d,g) and SSP5-8.5 (e,h)). In the main graphs, blue dots depict air temperatures that are high enough to cause thermal coma with an exposure of less than 8 h (critical temperature (temp.)), and dark grey dots indicate non-stressful air temperatures (shown are the highest 50% of all temperature measurements). Similarly, orange and red dots indicate critical surface temperatures, and light grey dots indicate temperatures below the threshold that causes substantial thermal injuries. The inset graphs show the percentage of all measured air (blue) and surface (red) temperatures that are critical for heat-sensitive insects (upper 25% of CTmax); ticks on the x axis represent the same elevations as those in the main graphs. The dashed red line shows the predicted mean protein melting temperature (42.15 °C), in line with the prediction that insects do not survive these temperatures.
Under current climate, lowland insects in the Andean-Amazonian ecosystems are most affected by heat, where some measured surface temperatures can cause heat coma in less than 1 min (Fig.