The molecular basis of force selectivity by PIEZO2
TL;DR
PIEZO2의 힘 선택성은 PIEZO1보다 더 강성인 구조와 액틴 세포골격에 연결된 필라민-B(FLNB) 분자 테더에 의해 결정됩니다. 이 상호작용은 세포 함몰에 대한 민감도와 선택성을 높여 PIEZO2가 터치 감각을 전문화된 기계수용체로 만듭니다.
Key Takeaways
- •PIEZO2는 PIEZO1보다 구조적으로 더 강성이며, 서로 다른 기계적 자극에 대해 반대되는 형태 변화와 개폐 반응을 보입니다.
- •PIEZO2의 선택적 기계수용은 액틴 세포골격과의 연결, 특히 필라민-B(FLNB) 분자 테더에 의해 매개됩니다.
- •이 연결은 힘이 PIEZO2로 전달되는 방식을 변경하여 세포 함몰 자극에 대한 높은 민감도와 선택성을 부여합니다.
- •PIEZO2와 FLNB는 체성감각 뉴런에서 공동 발현되며, 피부 기계감각 구심신경의 말단 기관에서 나노미터 단위로 공동 위치합니다.
- •이러한 발견은 PIEZO2가 전문화된 기계수용체인 이유를 설명하고, 세포가 다양한 기계적 자극을 해독하는 분자적 청사진을 제공합니다.
Tags
Abstract
PIEZOs are mechanically gated ion channels that transduce force into electrochemical signals1. PIEZO1 responds to diverse stimuli including membrane stretch2 and shear stress3, whereas PIEZO2 is generally tuned to detect cellular indentation4,5. The functional specialization of PIEZO2 is proposed to underlie its distinct physiological roles, including mediating the sense of touch6,7. How PIEZO2 achieves this selectivity despite its close structural similarity to PIEZO1 is unclear. Here we combine single-molecule MINFLUX fluorescence nanoscopy with electrophysiology to link the conformational states of PIEZO2 to channel gating in intact cells. We find that PIEZO2 is intrinsically more rigid than PIEZO1, and that disparate mechanical stimuli paradoxically evoke opposite conformational and gating responses in each channel. These unique gating properties arise in part from a connection to the actin cytoskeleton, and we identify filamin-B (FLNB) as a molecular tether that is required for this interaction. This complex alters how force is transmitted to PIEZO2 and confers heightened sensitivity to and selectivity for cellular indentation. PIEZO2 and FLNB are co-expressed in somatosensory neurons and colocalize within tens of nanometres at the end organs of cutaneous mechanosensory afferents. These findings help to explain why PIEZO2 is a specialized mechanosensor and provide a molecular blueprint for understanding how cells decode diverse mechanical stimuli across tissues and organ systems.
Main
PIEZO2 is a mechanotransduction channel that mediates an array of physiological processes in vertebrates, including touch6, proprioception8 and respiration9. Pathogenic loss- or gain-of-function mutations in this channel can cause extensive mechanosensory defects or debilitating neurological diseases such as Gordon syndrome, Marden–Walker syndrome or distal arthrogryposis type 5 (ref. 10). Despite recent advances in understanding the physiological roles of PIEZO2, the underlying structural correlates of function remain poorly understood.
PIEZO1 and PIEZO2 are homotrimeric membrane proteins with three identical subunits that assemble to form a triskelion11 (Fig. 1a). Each subunit has a blade of 36 transmembrane domains extending outward and upward from a central C-terminal pore domain, forming a concave shape around 24 nm in diameter in membrane-free structural models12,13,14,15. The blades are proposed to function as the primary sensors of mechanical force because they directly connect to the ion-conducting pore and, in the case of PIEZO1, blade expansion by membrane tension correlates with channel activation16,17,18. Mechanosensitive ion channels are generally gated through either a ‘force from lipid’ mechanism driven by membrane tension, a ‘force from filament’ mechanism involving force transmission through cytoskeletal tethers, or a hybrid of the two19. While membrane tension has been established as the primary gating stimulus for PIEZO12,12,20,21, comparatively little is known about how PIEZO2 is gated by physiologically relevant forces.
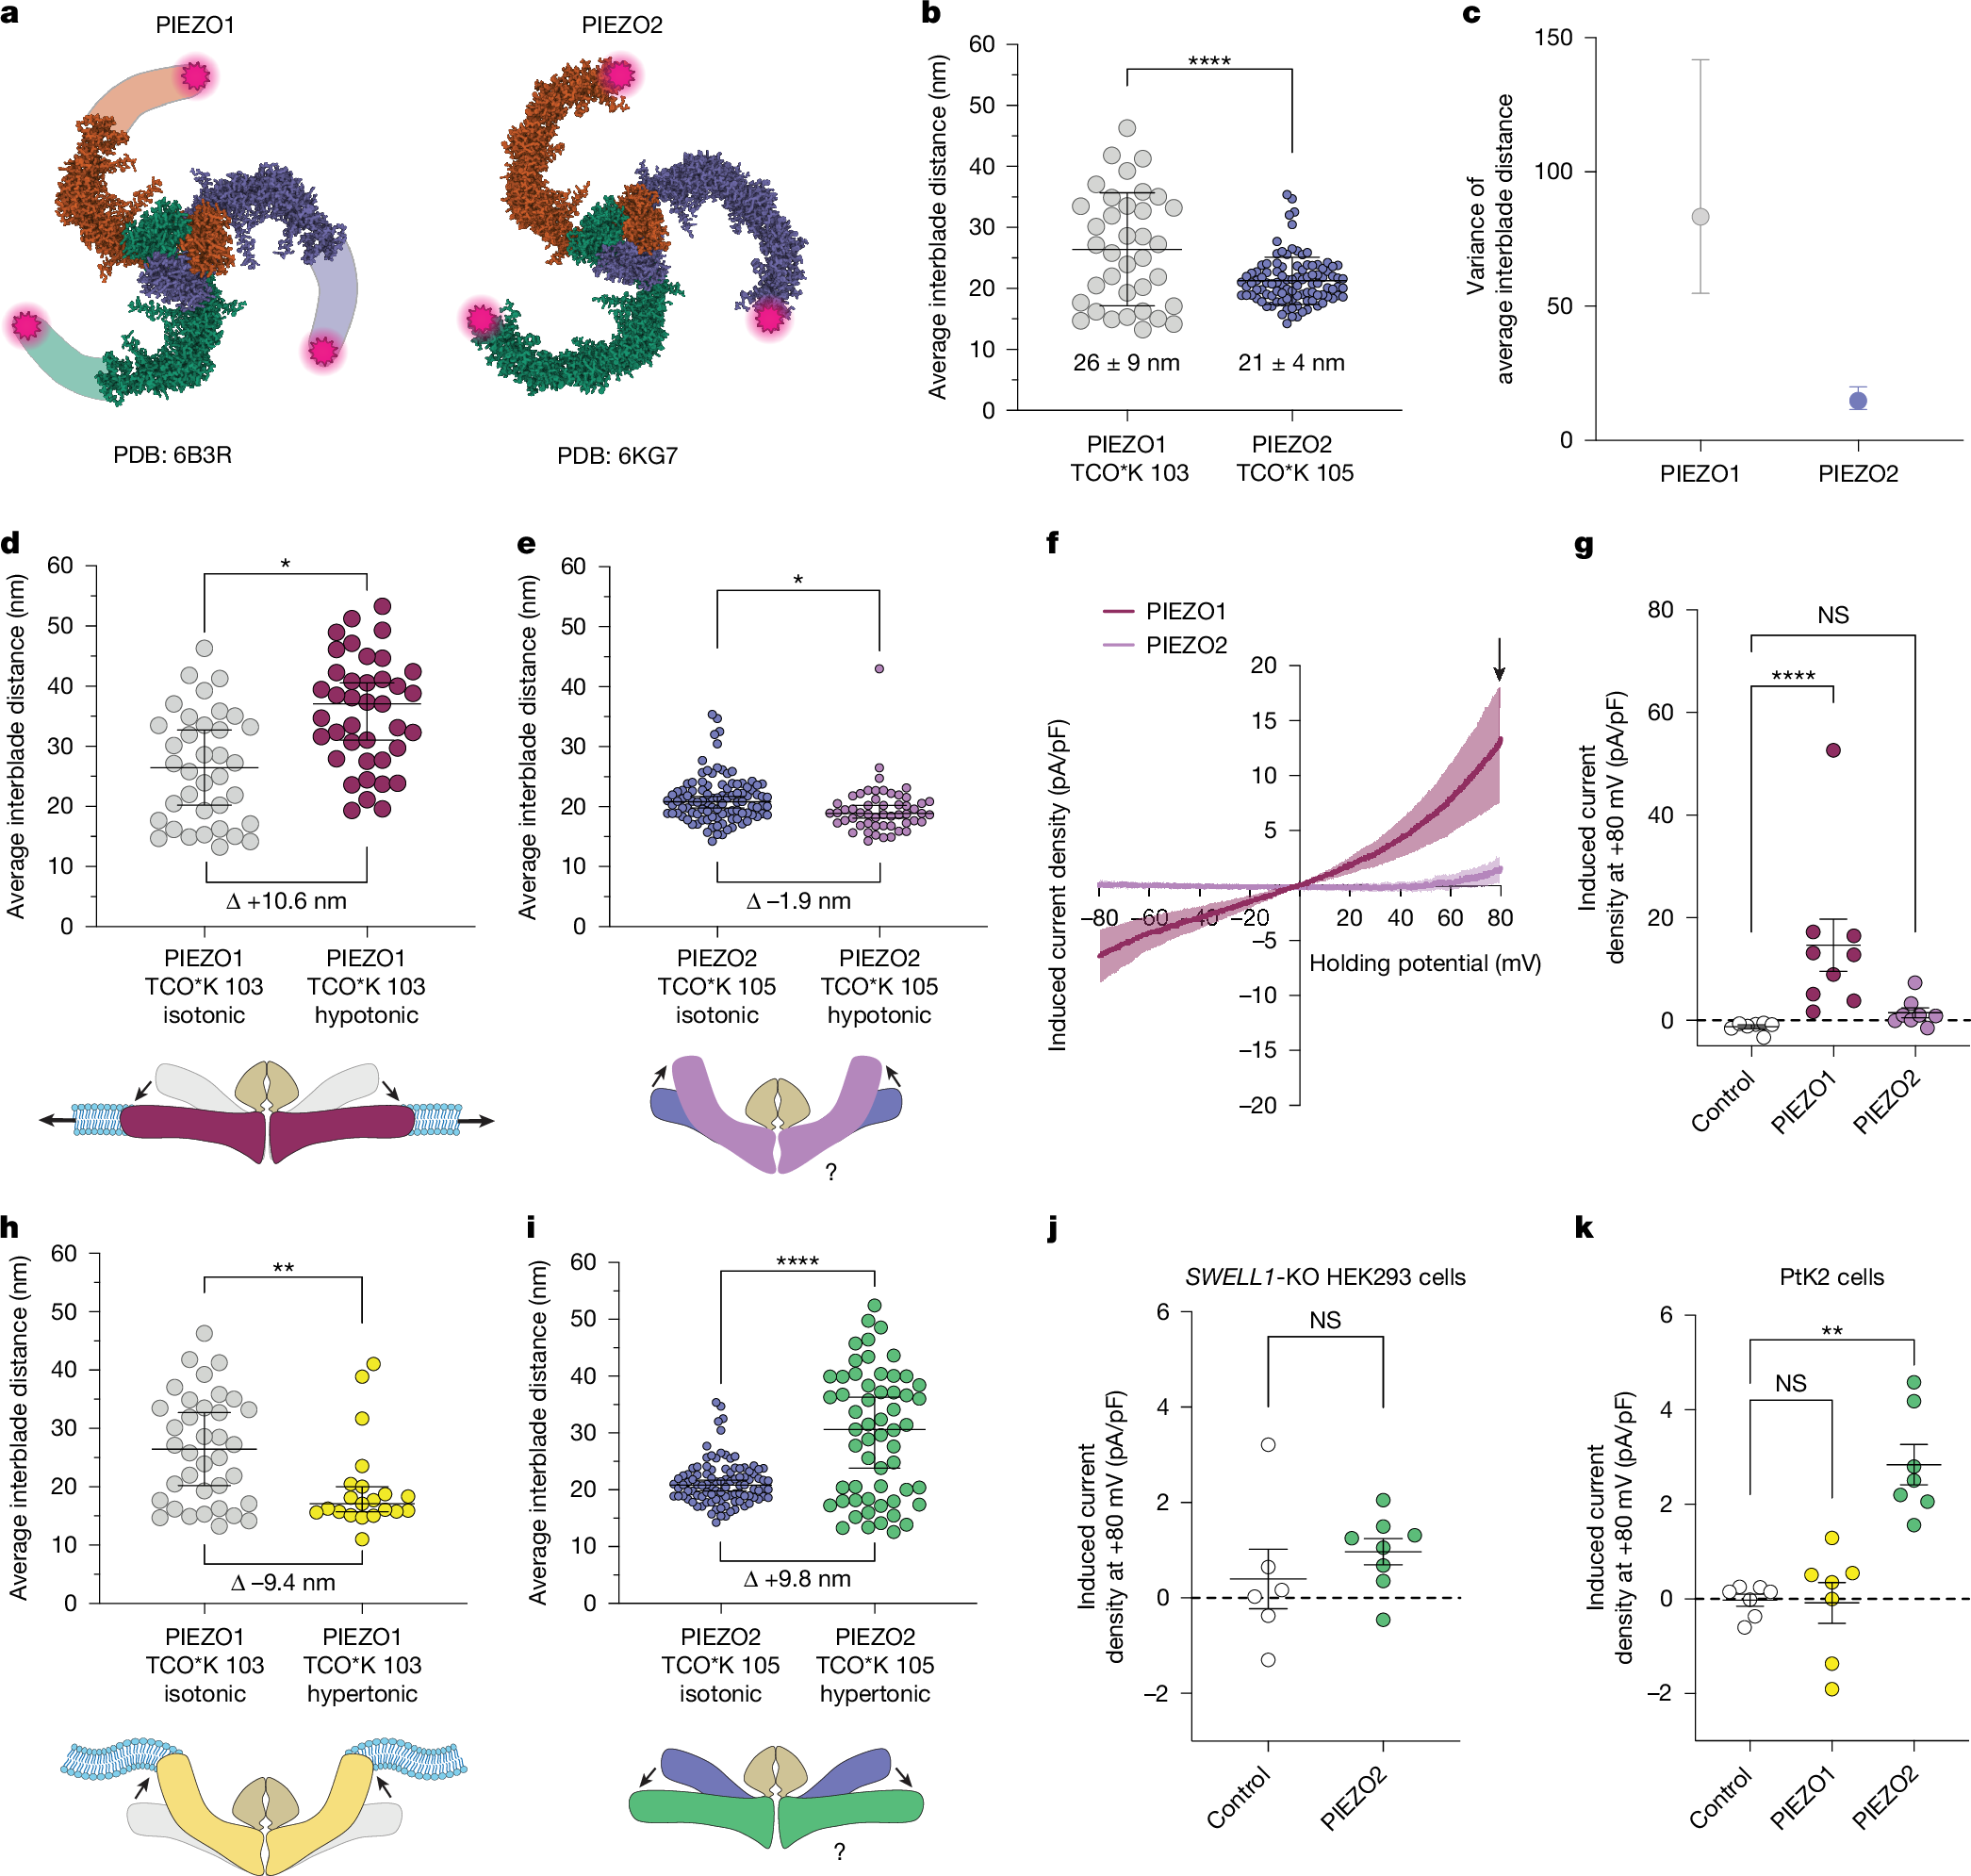
a, Structural models of PIEZO1 and PIEZO2, showing the tag positions (magenta stars). b, Interblade distances for mouse PIEZO1 tagged at residue 103 (grey; n = 36 molecules, n = 4 cells) and PIEZO2 tagged at residue 105 (blue; n = 52 molecules, n = 4 cells) in unstimulated PtK2 cells. Kolmogorov–Smirnov test, ****P = 6.3 × 10⁻⁵, D = 0.44. c, The variance and 95% confidence intervals (CI) of the mean interblade distances in b. F test of equality of variances, P = 8.5 × 10⁻⁸, F = 5.6. d, PIEZO1 interblade distances from expansive membrane stretch (red; median = 34.7 nm; n = 41 molecules, n = 3 cells) versus unstimulated (grey; median = 26.5 nm). Kolmogorov–Smirnov test, *P = 0.01, D = 0.38. e, PIEZO2 during expansive membrane stretch (magenta; median: 18.9 nm; n = 53 molecules, n = 3 cells) versus unstimulated (blue; median = 19.9 nm). Kolmogorov–Smirnov test, *P = 0.01, D = 0.26. f, Current–voltage curves of hypo-osmotic-swelling-evoked current density for PIEZO1 (n = 9 cells) and PIEZO2 (n = 8 cells) in SWELL1-KO HEK293 cells. The arrow denotes the current at +80 mV, used for quantification. g, Peak stretch-induced current density at +80 mV for f, including untransfected controls (n = 7 cells). Kruskal–Wallis test with Dunn’s post hoc test, ****P = 6.2 × 10⁻⁵. h, PIEZO1 interblade distances from hyperosmotic stimulus (yellow; median = 19.8 nm; n = 21 molecules, n = 3 cells) versus unstimulated (grey). Kolmogorov–Smirnov test, **P = 0.008, D = 0.46. i, PIEZO2 during hyperosmotic stimulus (green; median = 30.6 nm; n = 57 molecules, n = 3 cells). Kolmogorov–Smirnov test; ****P = 1.3 × 10⁻⁹, D = 0.54. j, Peak stretch-induced current from hyperosmotic stimulus in SWELL1-KO HEK293 cells expressing PIEZO2 (n = 8 cells) and untransfected controls (n = 6 cells). Mann–Whitney U-test, P = 0.181. k, The peak induced current density from hyperosmotic stimulus in PtK2 control cells (n = 6 cells) versus cells expressing PIEZO1 or PIEZO2 (n = 7 cells each). Kruskal–Wallis test, **P = 0.001. Data are mean ± s.d. (b), median ± 95% CI (d, e, h and i) and mean ± s.e.m. (f, g, j and k). All statistical tests were two-sided.
PIEZO1 and PIEZO2 have distinct roles in physiology. While PIEZO1 is predominantly expressed in non-neuronal cells, such as erythrocytes22 and chondrocytes23, PIEZO2 is primarily expressed in somatosensory neurons6, such as those that mediate proprioception and touch. These divergent physiological roles are consistent with their distinct functional properties. PIEZO1 is primarily activated by membrane tension, but PIEZO2 is preferentially activated by cellular indentation4, the mode of stimulus that many cutaneous mechanosensory neurons are tuned to detect24. Indentation stimuli, for example by poking a cell with a blunt probe, apply a localized force that both deforms the membrane and strains the underlying cytoskeleton25. By contrast, techniques like cell-attached pressure clamp recordings expand the membrane like a balloon and produce relatively uniform lateral membrane tension25. Comparing the responses of mechanotransduction channels to each of these stimulus modalities can provide clues about their gating mechanism. Notably, atomic-force-microscopy experiments show that PIEZO2 is approximately threefold more sensitive to indentation compared with PIEZO1 in heterologous cells5 yet, paradoxically, PIEZO2 is equally less sensitive to membrane tension in cell-attached or excised patch recordings26. Moreover, only a small minority of PIEZO2-transfected cells exhibits mechanosensitive currents in cell-attached recordings, and these currents are consistently small4,27. These observations suggest that PIEZO2 might not be gated purely through a force-from-lipid mechanism. Despite these clear differences in function, the cryo-electron microscopy (cryo-EM) structures of each channel are highly similar (Fig. 1a) and provide few clues about their functional specialization, highlighting the need to investigate their structural mechanics in a cellular context.
Distinct nanomechanics of PIEZO channels
To compare the structural mechanics of PIEZO1 and PIEZO2, we combined MINFLUX fluorescence nanoscopy with fluorogenic DNA PAINT to measure the conformation of individual molecules in a cell membrane. We previously used MINFLUX to measure the conformational states of PIEZO1 using conjugated spontaneously photoblinking dyes16; however, these dyes irreversibly bleach on excitation and produce variable photon counts. To increase the photon yield per molecular position, we used DNA PAINT, which exploits transient binding of fluorophore-labelled oligonucleotides28. Programmable binding kinetics through sequence design and the use of more stable dyes can yield far more localization events per molecule, which in turn can resolve a molecular position with higher confidence. We chose Potorous tridactylus kidney (PtK2) cells for imaging because they have an exceptionally flat morphology29 that allows imaging probes to easily reach molecules on the apical membrane adjacent to the coverslip. This minimizes optical aberrations, eliminates the complication of restricted diffusion of probes between the basal membrane and the coverslip and removes the need for permeabilization, which could otherwise expose intracellular channels that are not functionally active.
Using genetic code expansion, the click chemistry substrate trans-cyclooctene-lysine (TCO*K) was incorporated into equivalent extracellular loops of the distal blade in PIEZO1 and PIEZO2 (Methods). These sites were labelled with a tetrazine-conjugated DNA oligonucleotide that served as a transient docking site for a complementary oligonucleotide conjugated to the fluorescent dye ATTO 643 freely diffusing in the imaging buffer (Extended Data Fig. 1a). The cells were fixed in an isosmotic cross-linking solution to preserve morphology and imaged without permeabilization to keep the plasma membrane intact. Conventional DNA PAINT is hindered by background from unbound fluorophores, so we used self-quenching fluorogenic imager probes with ATTO 643 and an IowaBlack fluorescence quencher on opposite termini that become unquenched when bound to a docking strand30. Under identical imaging conditions, fluorogenic DNA PAINT yielded lower background, higher localization precision and more detections per binding event (Extended Data Fig. 1b–d). We verified that fluorogenic DNA-PAINT did not introduce measurable bias in MINFLUX localizations due to quencher–fluorophore interactions, and that we maintained nanometre-scale stability over extended acquisitions (Extended Data Fig. 2). Raw localizations were clustered and fit with three-dimensional (3D) Gaussian mixture models to obtain precise fluorophore positions, enabling us to directly measure 3D distances between the distal blade domains of individual PIEZO channels (Methods). The resulting enhanced localization density, especially compared with traditional photoblinking dyes16, enabled us to apply more stringent parameters in our 3D clustering algorithm (Methods and Extended Data Fig. 3), increasing confidence that each cluster corresponds to a single PIEZO protomer.
Compared with PIEZO1, the blades of PIEZO2 are significantly less expanded in the absence of stimulation (Fig. 1b). Notably, while thermal fluctuations alone are thought to cause large deformations in the shape of PIEZO116,17, the markedly narrower range of conformational states in PIEZO2 also reveals that the blade domains are much more conformationally rigid than PIEZO1 (Fig. 1c). If blade expansion generally correlates with activation, the larger force required to gate PIEZO2 in excised membrane patches26 might reflect the extra energy required to bend the more rigid blades by the same distance. These differences in flexibility might also explain why the distal blades of PIEZO2 were resolved by cryo-EM but were not for PIEZO112,14.
The primary gating stimulus for PIEZO1 is membrane tension2,12,20,21. Expansive membrane stretch from osmotic swelling increases tension31, similarly to cell-attached pressure clamp recordings25. To isolate PIEZO-mediated currents, we used SWELL1-knockout (KO) HEK293 cells, which lack the ubiquitous SWELL1-dependent chloride current evoked by hypotonic stimuli that otherwise obscures the measurements of mechanosensitive cation channels16. We replicated our previous findings16, and show that membrane tension from osmotic swelling expands the blades of PIEZO1 (Fig. 1d) and gates the channel (Fig. 1f). This behaviour is well explained by a force-from-lipids model, whereby mechanical energy from the bilayer is transmitted directly to the channel without requiring intermediary components19. Notably, osmotic swelling significantly compacted the blade domains of PIEZO2 by 1.9 nm on average (Fig. 1e) and did not significantly activate the channel (Fig. 1f,g). This lack of activation appears consistent with cell-attached pressure-clamp recordings in heterologous cells, in which only a small minority of cells expressing PIEZO2 displays mechanosensitive currents, and those with responses are invariably small4,27. These distinct gating properties indicate that PIEZO2 does not follow a strict force-from-lipids mechanism and may instead recruit additional cellular components that alter how force is transmitted to the channel.
The mismatch in curvature between the concave PIEZO1 structure and planar lipid bilayer results in a bending stress that can substantially expand the blades without externally applied tension16,17. A hypertonic extracellular environment reduces cell volume and causes plasma membrane slackening and folding32. Consequently, the blades should compact as residual tension is relieved and as the channel partitions into membrane folds matching its intrinsic curvature. While we observed this effect for PIEZO1 (Fig. 1h), we found that the blade domains of PIEZO2 are significantly expanded by the same stimulus (Fig. 1i). This raises the question of how a stimulus that reduces membrane tension can expand the blades of PIEZO2. In addition to slackening, hyperosmotic shrinkage is thought to fold slack membrane into the gaps of the comparably rigid cortical actin meshwork32. If PIEZO2 is tightly coupled to actin, we hypothesize that this might recruit a membrane bending force that expands the blade domains. Consistent with this idea, a hypertonic stimulus does not significantly activate PIEZO2 in SWELL1-KO HEK293 cells (Fig. 1j), but it does activate the channel in PtK2 cells (Fig. 1k), of which the actin cortex is roughly one order of magnitude stiffer33,34 and more tightly anchored to the plasma membrane35. Together, these data favour a tether-coupled membrane gating model for PIEZO2, whereby deformation of the membrane relative to a connection to actin can apply a gating force to the channel (Fig. 2a).
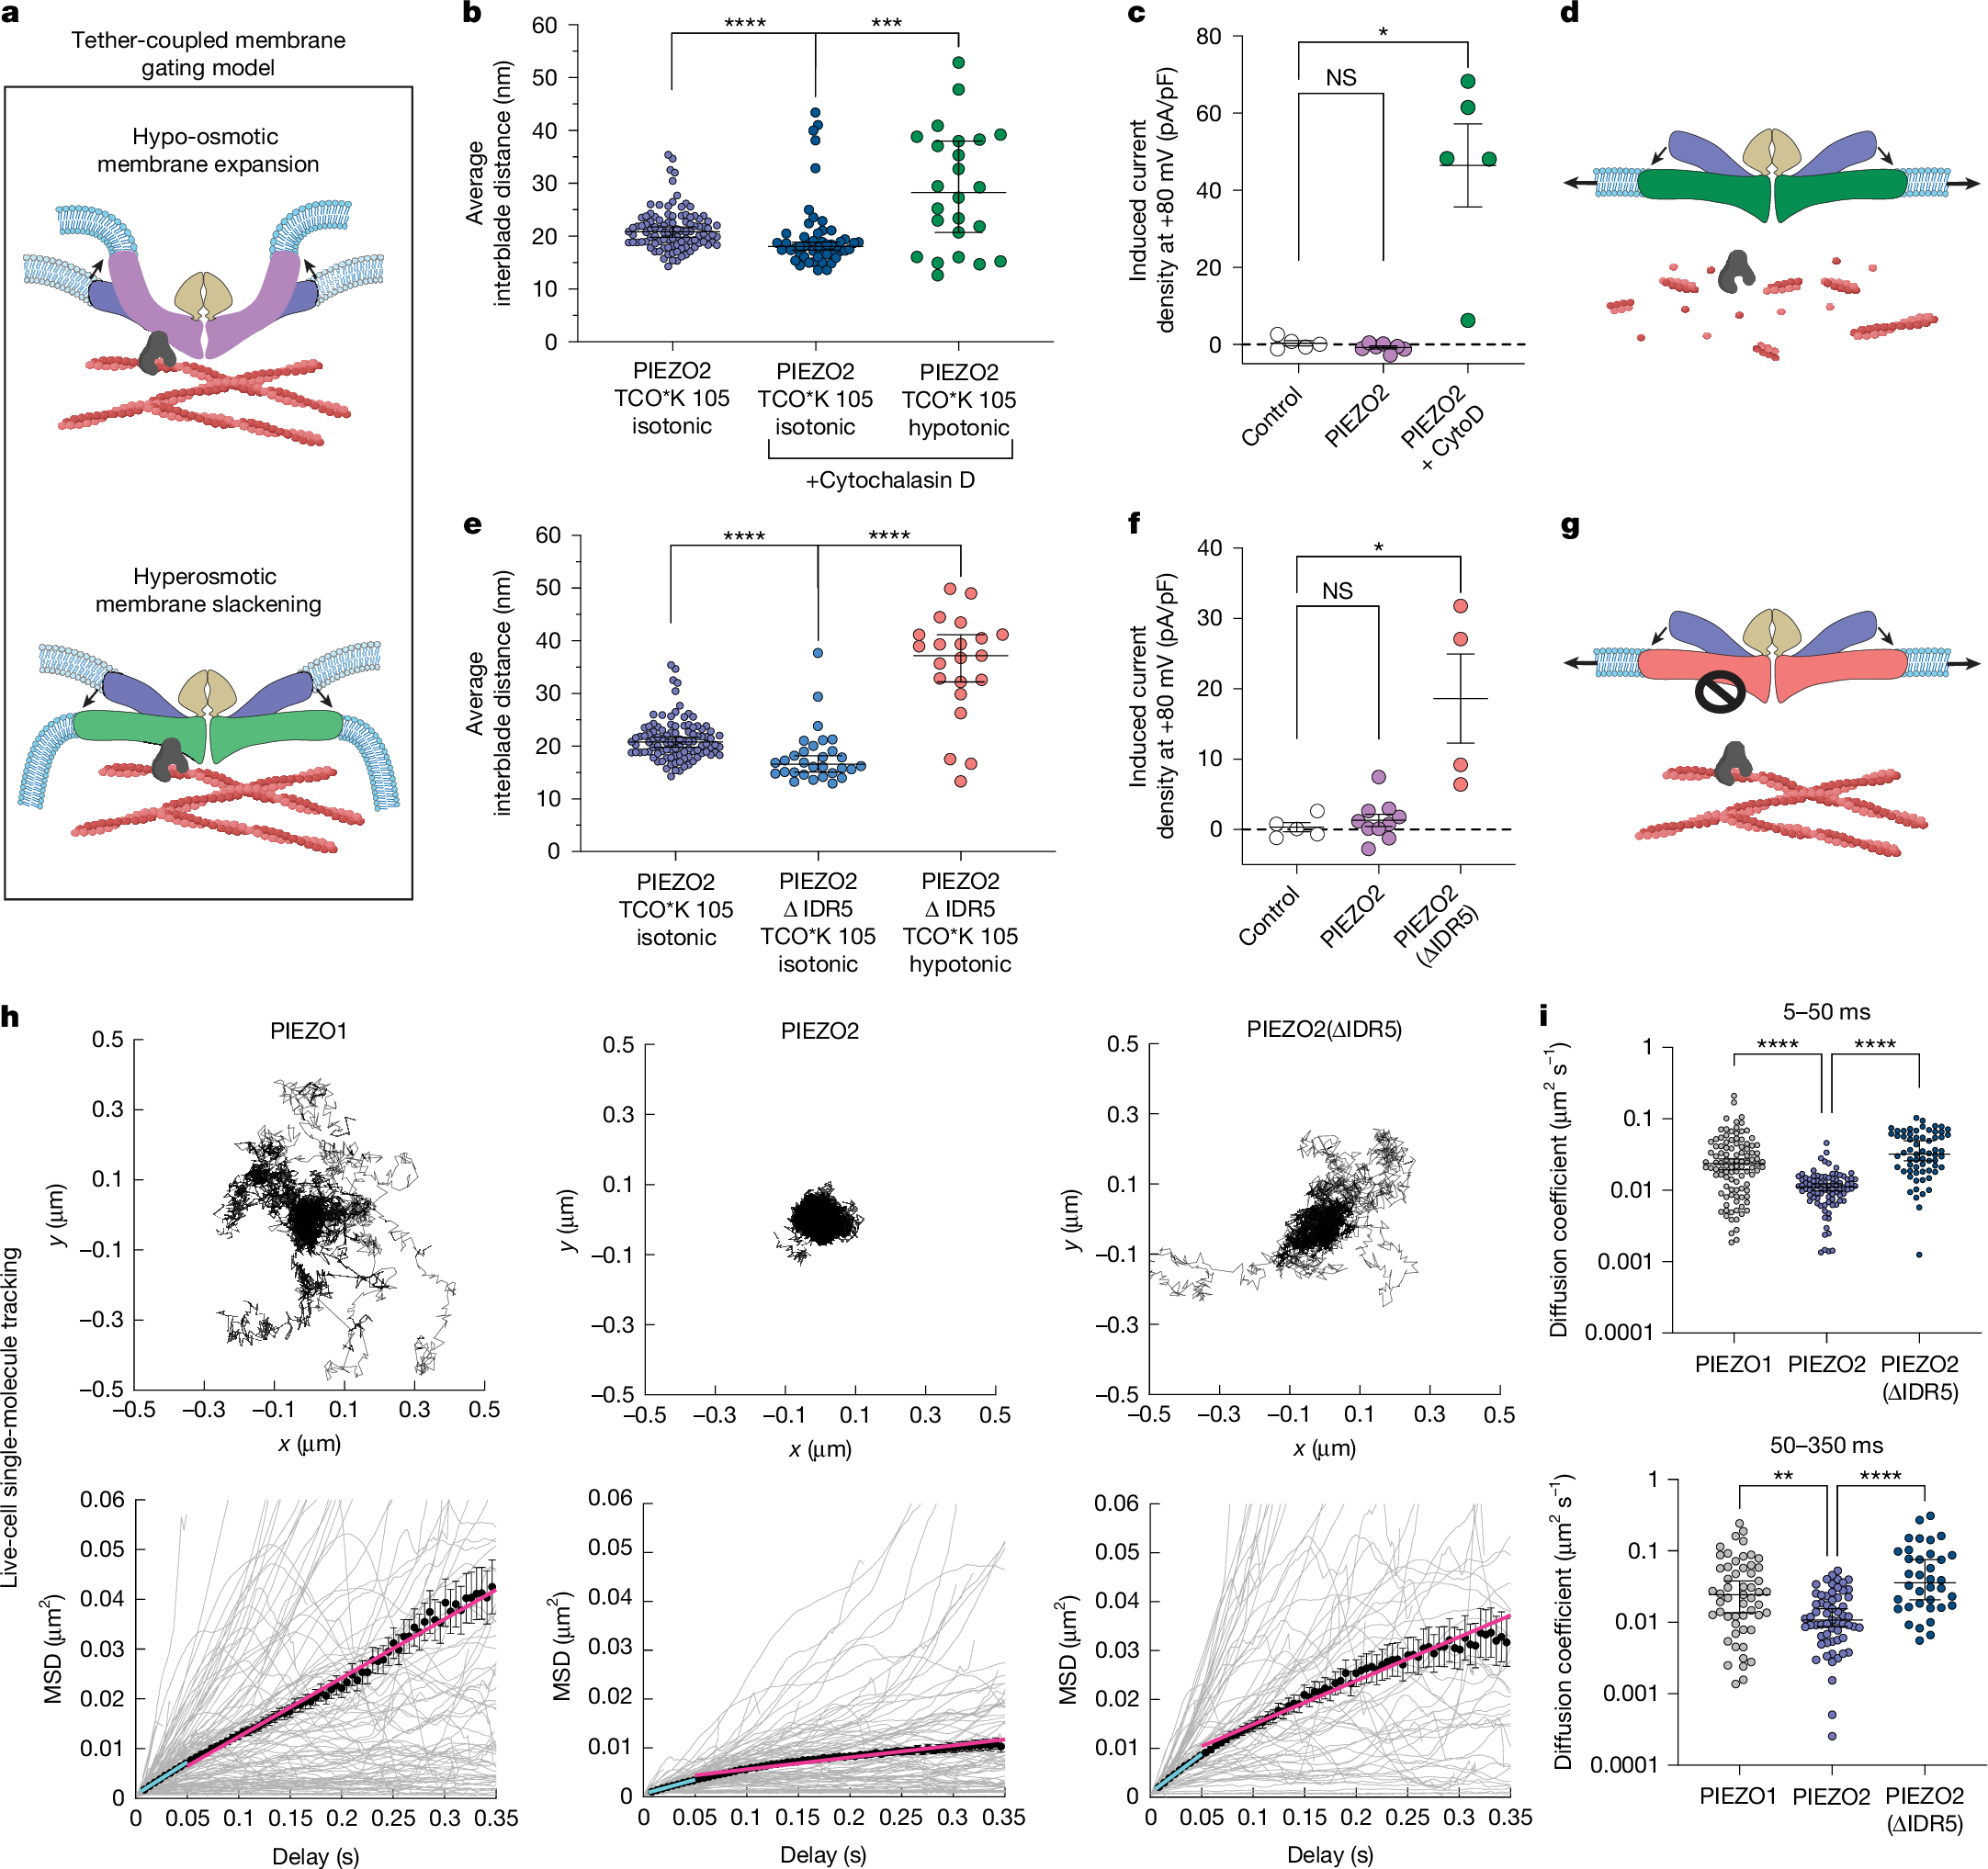
a, Tether-coupled gating model: changes in membrane properties (for example, curvature) relative to a cytoskeletal tether exert force on the blade domains. b, Cytochalasin D (CytoD) decreases the resting PIEZO2 interblade distance (dark blue; median = 20.1 nm; n = 51 molecules, n = 3 cells; Kolmogorov–Smirnov test, ****P = 3.4 × 10⁻⁵, D = 0.40) and permits blade expansion from expansive membrane stretch (green; median = 28.3 nm; n = 24 molecules, n = 5 cells; Kolmogorov–Smirnov test, ***P = 0.0002, D = 0.53). c, CytoD enables stretch-evoked PIEZO2 activation in SWELL1-KO HEK293 cells. n = 5 (control), n = 7 (PIEZO2) and n = 5 (PIEZO2 + CytoD) cells. Kruskal–Wallis test, *P = 0.048. d, Schematic of PIEZO2 blade expansion after actin disruption. e, PIEZO2(ΔIDR5) shows reduced interblade distance at rest (light blue; median = 16.6 nm; n = 30 molecules, n = 4 cells; Kolmogorov–Smirnov test, ****P = 9.7 × 10⁻⁶, D = 0.57) and robust expansion from hypo-osmotic swelling (orange; median = 37.2 nm; n = 21 molecules, n = 6 cells; Kolmogorov–Smirnov test, ****P = 3.9 × 10⁻⁷, D = 0.79). f, Hypo-osmotic swelling gates PIEZO2(ΔIDR5) in SWELL1-KO cells. n = 5 (control), n = 10 (PIEZO2) and n = 4 (PIEZO2(ΔIDR5)). Kruskal–Wallis test, *P = 0.011. g, Schematic of PIEZO2(ΔIDR5) blade expansion from expansive membrane stretch. h, Overlaid MINFLUX single-molecule trajectories aligned by centre of mass (≥1 s) (top). Bottom, MSD analysis for trajectories with ≥200 localizations. Trajectories (grey) were averaged (50 bins in 350 ms; black circles) and fit at 5–50 ms (cyan, microscopic D: PIEZO1 = 0.0218, PIEZO2 = 0.0096, PIEZO2(ΔIDR5) = 0.0264 µm2 s−1) and 50–350 ms (magenta, macroscopic D: PIEZO1 = 0.0197, PIEZO2 = 0.0041, PIEZO2(ΔIDR5) = 0.0149 µm2 s−1). n = 55 (PIEZO1), n = 61 (PIEZO2) and n = 36 (PIEZO2(ΔIDR5)) trajectories. i, Diffusion coefficients from individual trajectories in h. Top, microscopic D for PIEZO2 (blue; median = 0.011 µm2 s−1), PIEZO1 (grey; median = 0.024 µm2 s−1) and PIEZO2 ΔIDR5 (dark blue; median = 0.032 µm2 s−1). Kruskal–Wallis test, ****P = 3.8 × 10⁻⁹ (PIEZO1 versus PIEZO2), ****P = 1.3 × 10⁻¹⁴ (PIEZO2 versus PIEZO2(ΔIDR5)). n = 104 (PIEZO1), n = 87 (PIEZO2) and n = 65 (PIEZO2(ΔIDR5)) trajectories. Bottom, macroscopic D for PIEZO2 (blue circles; median = 0.011 µm2 s−1), PIEZO1 (grey; median = 0.024 µm2 s−1) and PIEZO2(ΔIDR5) (dark blue; median = 0.036 µm2 s−1). Kruskal–Wallis test, **P = 0.0023, ****P = 1.2 × 10⁻⁹. n = 55 (PIEZO1), n = 61 (PIEZO2) and n = 36 (PIEZO2(ΔIDR5)) trajectories. Data are mean ± s.e.m. (c, f and h) and median ± 95% CI (b, e and i). All statistical tests are two-sided. The diagrams in a, d and g were created using BioRender; Mulhall, E. M. https://BioRender.com/5k5114d (2026).